
Health Fact Sheets
Blood pressure of children and adolescents, 2016-2019

The combined results of the 2016-2019Note Canadian Health Measures Survey (CHMS) indicate that the average resting blood pressure of children and adolescents aged 6 to 19 was 96/62 mmHg. Among this group, 94.3% had a measured blood pressure that was considered normal and 5.7% had results considered borderline or elevated (data not shown). Reliable estimates of hypertension in children are scarce, however studies have shown that children’s hypertension has increased over the past decade partially due to an increase in childhood obesity. A systematic review estimated that the global prevalence of childhood hypertension in 2015 ranged from 4.3% among children aged 6 years to 3.2% among those aged 19 years and peaked at 7.9% among those aged 14 years.Note
The CHMS results indicate that in children aged 6 to 11, average resting blood pressure was 93/61 mmHg, while youth aged 12 to 19 had an average resting blood pressure of 99/62 mmHg.
The proportion of girls aged 12 to 19 with blood pressure in the normal range was significantly higher than that of girls aged 6 to 11 (Chart 1).

Data table for Chart 1
| Blood pressure classification | ||
|---|---|---|
| Normal | Elevated or Hypertensive | |
| percent | ||
| Total | ||
| 6 to 11 years | 91.6 | 8.4 |
| 12 to 19 years | 96.2 | 3.8Note E: Use with caution |
| Boys | ||
| 6 to 11 years | 91.5 | 8.5 |
| 12 to 19 years | 95.6 | 4.4Note E: Use with caution |
| Girls | ||
| 6 to 11 years | 91.8 | 8.2 |
| 12 to 19 years | 96.9 | 3.1Note E: Use with caution |
|
E use with caution Source: Canadian Health Measures Survey, Cycle 5 (2016 and 2017) and Cycle 6 (2018 and 2019). |
||
Blood pressure and body composition
Height and weight were measured for all CHMS respondents. Children and youth who were classified as being overweight (98/62 mmHg) or obese (104/66 mmHg) had a significantly higher average blood pressure than normal weight children (95/61 mmHg). Average systolic blood pressure was significantly higher in overweight and obese children compared with those in the normal weight category (Chart 2). As well, overweight and obese children had significantly higher average diastolic blood pressure when compared with their normal weight counterparts (Chart 3).Note Note Note Note

Data table for Chart 2
| Thinness/normal weight | Overweight | Obese | |
|---|---|---|---|
| mmHG | |||
| Total | |||
| 6 to 11 years | 92 | 95 | 100 |
| 12 to 19 years | 97 | 101 | 108 |
| Boys | |||
| 6 to 11 years | 92 | 94 | 100 |
| 12 to 19 years | 97 | 103 | 109 |
| Girls | |||
| 6 to 11 years | 92 | 95 | 101 |
| 12 to 19 years | 97 | 99 | 105 |
|
Note: The body mass index (BMI) classification is based on de Onis et al. for children and youth aged 6 to 17, and on the Canadian guidelines for body weight classification in adults (Health Canada, 2003) for youth aged 18 to 19. Source: Canadian Health Measures Survey, Cycle 5 (2016 and 2017) and Cycle 6 (2018 and 2019). |
|||
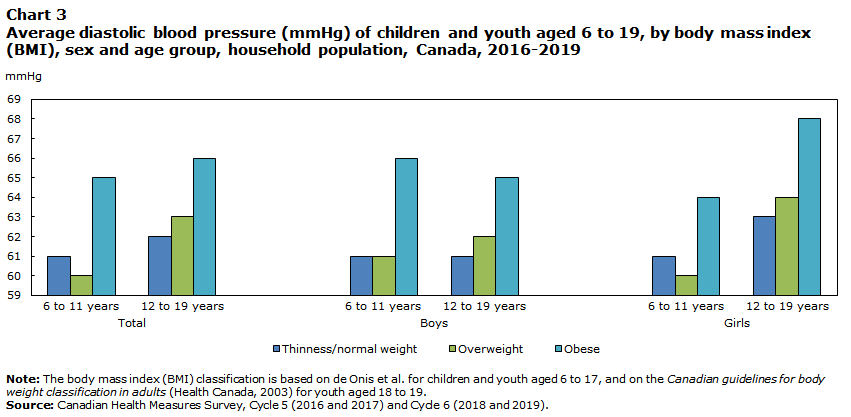
Data table for Chart 3
| Thinness/normal weight | Overweight | Obese | |
|---|---|---|---|
| mmHg | |||
| Total | |||
| 6 to 11 years | 61 | 60 | 65 |
| 12 to 19 years | 62 | 63 | 66 |
| Boys | |||
| 6 to 11 years | 61 | 61 | 66 |
| 12 to 19 years | 61 | 62 | 65 |
| Girls | |||
| 6 to 11 years | 61 | 60 | 64 |
| 12 to 19 years | 63 | 64 | 68 |
|
Note: The body mass index (BMI) classification is based on de Onis et al. for children and youth aged 6 to 17, and on the Canadian guidelines for body weight classification in adults (Health Canada, 2003) for youth aged 18 to 19. Source: Canadian Health Measures Survey, Cycle 5 (2016 and 2017) and Cycle 6 (2018 and 2019). |
|||
Start of text box
Blood pressure is a measure of the force of blood against the artery walls, and is expressed as systolic pressure/diastolic pressure in millimetres of mercury (e.g., 120/80 mmHg). The systolic pressure (top number) is the pressure when the heart contracts and pushes the blood out, and the diastolic pressure (bottom number) is the lowest pressure when the heart relaxes between beats.
Resting blood pressure was measured in the CHMS using an automated device (BPTru™) following a five-minute rest period. The BPTru™ recorded six measurements, one minute apart. The average systolic and diastolic blood pressure were calculated using the last five out of six measurements.
The criteria for blood pressure classification in children and youth are as follows:
| Category | Description | |
|---|---|---|
| Ages 6 to 17Table 1 Note 1 | Ages 18 and 19Table 1 Note 2 | |
| Normal | SBP and DBP < 90th percentile | Mean SBP/DBP < 120/80 mmHg |
| Borderline | SBP or DBP ≥ to the 90th percentile, but < the 95th percentile OR Measured mean SBP/DBP > 120/80 mmHg |
Mean SBP of 120-139 mmHg and mean DBP of 80-89 mmHg OR Mean SBP of 120-139 mmHg and mean DBP < 80 mmHg OR Mean SBP < 120 mmHg and mean DBP of 80-89 mmHg |
| Elevated | SBP or DBP ≥ 95th percentile OR Respondent reported using BP medication within the past month |
Mean SBP/DBP of ≥ 140/90 mmHg OR Respondent reported using BP medication within the past month |
SBP: systolic blood pressure DBP: diastolic blood pressure |
||
End of text box
Data
The Canadian Health Measures Survey (CHMS) is a two-step survey. The first step is a personal interview at the respondent's household. The second step is a visit to the CHMS mobile clinic where physical measurements and blood and urine samples are taken.
The 2016-2019 reference period refers to combined results from Cycle 5 (2016 and 2017) and Cycle 6 (2018 and 2019) of the CHMS.
The target population for the CHMS consists of persons 3 to 79 years of age living in the 10 provinces. The observed population excludes: persons living in the three territories; persons living on reserves and other Aboriginal settlements in the provinces; full-time members of the Canadian Forces; the institutionalized population and residents of certain remote regions. Altogether these exclusions represent approximately 3% of the target population.
Survey weight and bootstrap weight files and instructions are available for combining Cycle 6 Canadian Health Measures Survey data (where possible) with equivalent data from Cycles 1 to 5.
Canadian Health Measures Survey data related to this Health Fact Sheet are available in data tables 13-10-0319-01, 13-10-0326-01 and 13-10-0373-01.
- Date modified: