
Health Fact Sheets
Primary health care providers, 2019
Skip to text
Text begins
In 2019, 14.5% of Canadians aged 12 and older (roughly 4.6 million people) reported that they did not have a regular health care provider they see or talk to when they need care or advice for their health.Note 1
Significantly more males (17.4%) than females (11.7%) reported they were without a regular health care provider in 2019.Note 2 Among both males and females, compared to all age groups, those aged 18 to 34 were most likely to be without a regular health care provider. Comparatively, Canadians aged 65 and older were the least likely (6.0% for males and 5.5% for females; Chart 1).
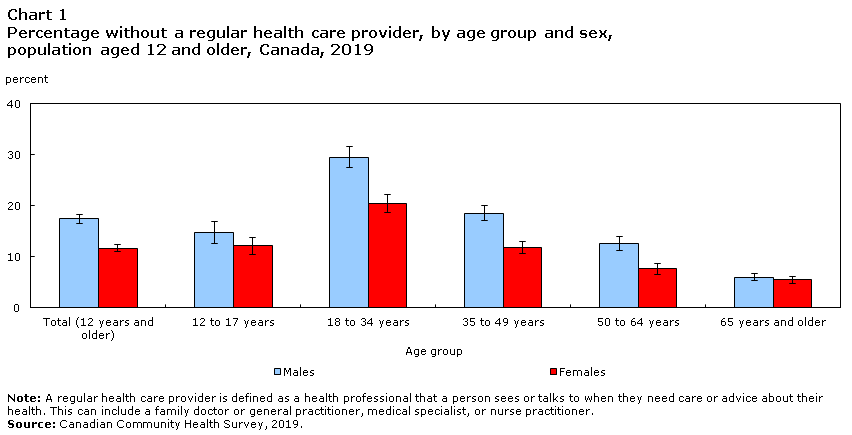
Data table for Chart 1
| Males | Females | |||||
|---|---|---|---|---|---|---|
| percent | lower 95% confidence interval | upper 95% confidence interval | percent | lower 95% confidence interval | upper 95% confidence interval | |
| Total (12 years and older) | 17.4 | 16.7 | 18.2 | 11.7 | 11.1 | 12.3 |
| 12 to 17 years | 14.7 | 12.6 | 16.8 | 12.1 | 10.3 | 13.8 |
| 18 to 34 years | 29.5 | 27.6 | 31.5 | 20.4 | 18.7 | 22.2 |
| 35 to 49 years | 18.5 | 17.0 | 20.0 | 11.8 | 10.5 | 13.0 |
| 50 to 64 years | 12.6 | 11.3 | 13.9 | 7.6 | 6.6 | 8.6 |
| 65 years and older | 6.0 | 5.3 | 6.7 | 5.5 | 4.9 | 6.2 |
|
Note: A regular health care provider is defined as a health professional that a person sees or talks to when they need care or advice about their health. This can include a family doctor or general practitioner, medical specialist, or nurse practitioner. Source: Canadian Community Health Survey, 2019. |
||||||
Access to a regular health care provider is very important for preventative health care and the management of ongoing medical conditions. Since 2015, the proportion of Canadians reporting that they did not have a regular health care provider decreased from 16.8% in 2015 to 14.5% in 2019. Among the provinces, there were differences in this trend. Between 2015 and 2019, Quebec and Alberta saw a decrease in the proportion of residents without a regular health care provider, whereas Nova Scotia saw an increase (Table 1).
| 2015 | 2019 | |
|---|---|---|
| percent (%) | ||
| Canada | 16.8 | 14.5Note * |
| Newfoundland and Labrador | 11.9 | 12.5 |
| Prince Edward Island | 11.3 | 14.9 |
| Nova Scotia | 11.3 | 14.4Note * |
| New Brunswick | 9.2 | 10.2 |
| Quebec | 27.8 | 21.5Note * |
| Ontario | 10.4 | 9.4 |
| Manitoba | 18.2 | 15.8 |
| Saskatchewan | 19.1 | 17.2 |
| Alberta | 19.5 | 14.9Note * |
| British Columbia | 16.2 | 17.7 |
|
||
Compared to the national average (14.5%), Quebec (21.5%), Saskatchewan (17.2%) and British Columbia (17.7%) all had a higher proportion of residents without a regular health care provider. New Brunswick (10.2%) and Ontario (9.4%) both had a lower proportion of residents who did not have a regular health care provider, and all other provinces had a rate that was similar to the national average.
Nova Scotians were more likely to report their regular care provider retired or left
In 2019, the main reasons as to why an individual did not have a regular health care provider differed based on their province of residence. Compared to all other provinces, residents in Nova Scotia were most likely to report that the reason they did not have a regular health care provider was because they had one who had retired or left (Table 2).Note 3 Residents living in Prairie Provinces were more likely to report that they had not tried to find a primary care provider or they did not need one but had a usual place of care.
| Felt they did not need one but had a usual place of care, or have not tried to find one | No one available in the area or no one in the area was taking new patients | Had one who left or retired | Other reason | |
|---|---|---|---|---|
| percent (%) | ||||
| Newfoundland and Labrador | 47.4 | 40.0 | 30.2 | 5.8Note E: Use with caution |
| Prince Edward Island | 38.4Note E: Use with caution | 38.4 | 25.7Note E: Use with caution | 12.8Note E: Use with caution |
| Nova Scotia | 23.9 | 45.8 | 41.3 | 15.5Note E: Use with caution |
| New Brunswick | 31.4 | 43.9 | 25.3Note E: Use with caution | 15.2Note E: Use with caution |
| Quebec | 44.6 | 34.8 | 23.2 | 16.2 |
| Ontario | 46.8 | 24.1 | 25.4 | 22.0 |
| Manitoba | 61.7 | 12.7Note E: Use with caution | 24.5 | 19.8Note E: Use with caution |
| Saskatchewan | 67.8 | 12.3Note E: Use with caution | 26.4 | 16.7Note E: Use with caution |
| Alberta | 65.9 | 12.7 | 18.2 | 18.9 |
| British Columbia | 46.8 | 36.5 | 19.6 | 14.1 |
|
E use with caution Note: Respondents could have reported more than one reason for not having a primary health care provider, so estimates are not exclusive within the population (they can add to more than 100%). Source: Canadian Community Health Survey, 2019. |
||||
Just over 1 in 3 people indicated they can receive a same day or next day appointment
In addition to having a regular health care provider, it is important to have timely access to health care. Among Canadians who had a regular health care provider, 38.7% indicated they could receive a same day or next day appointment with someone from their regular healthcare provider’s office when they needed immediate care for a minor health problem. Canadians living in Nova Scotia (20.8%) and New Brunswick (20.4%) were the least likely to receive care within two days (Chart 2).

Data table for Chart 2
| Percent | Lower 95% confidence interval | Upper 95% confidence interval | |
|---|---|---|---|
| Canada | 38.7 | 37.9 | 39.4 |
| Newfoundland and Labrador | 30.3 | 26.5 | 34.0 |
| Prince Edward Island | 28.7 | 25.0 | 32.4 |
| Nova Scotia | 20.8 | 18.4 | 23.2 |
| New Brunswick | 20.4 | 18.1 | 22.7 |
| Quebec | 32.4 | 31.0 | 33.9 |
| Ontario | 42.8 | 41.4 | 44.1 |
| Manitoba | 40.8 | 37.5 | 44.0 |
| Saskatchewan | 44.9 | 41.3 | 48.4 |
| Alberta | 44.7 | 42.6 | 46.9 |
| British Columbia | 35.9 | 33.9 | 37.9 |
|
Note: A regular health care provider is defined as a health professional that a person sees or talks to when they need care or advice about their health. This can include a family doctor or general practitioner, medical specialist, or nurse practitioner. Source: Canadian Community Health Survey, 2019. |
|||
Start of text box
For many Canadians, the first point of contact for medical care is their regular health care provider. Being without a regular health care provider is associated with fewer visits to general practitioners or specialists—who can play a role in the early screening and treatment of medical conditions.
A regular health care provider is defined as a health professional that a person sees or talks to when they need care or advice about their health. This can include a family doctor or general practitioner, medical specialist, or nurse practitioner.
End of text box
References
Carrière, G. 2005. Consultations with doctors and nurses. Health Reports. Statistics Canada Catalogue no. 82-003. Vol. 16 no. 4. (accessed October 1, 2020).
Nabalamba, A. and W. Millar. 2007. Going to the doctor. Health Reports. Statistics Canada Catalogue no. 82-003. Vol. 18 no. 1. (accessed October 1, 2020).
Data
Additional data from the Canadian Community Health Survey are available from table 13-10-0096-01.
- Date modified: