
Health Fact Sheets
Dental Care, 2018

Archived Content
Information identified as archived is provided for reference, research or recordkeeping purposes. It is not subject to the Government of Canada Web Standards and has not been altered or updated since it was archived. Please "contact us" to request a format other than those available.

Start of text box
Key Findings
- Just over one-third (37.5%) of Canadians both brush their teeth at least twice a day and floss at least once a day.
- In the past year, most Canadians have seen a dental professional (74.7%), however 22.4% avoided going at least once because of the cost.
- Almost two-thirds of Canadians (64.6%) have dental insurance to cover all or part of their expenses.
- Those without insurance were about three times as likely as those with insurance to avoid seeing a dental professional because of cost (39.1% versus 13.7%).
End of text box
Oral health is an important aspect of overall health. Research has shown a connection between poor oral health and other health problems, such as diabetes and respiratory illness. The Canadian Dental Association (CDA) recommends brushing at least twice a day and flossing at least once a day.Note 1 They state that the recommended frequency of dental visits varies by the needs and risks of oral disease of the individual, but for most, the recommended frequency is every 6 months. Routine visits to a dental professional help to prevent and detect problems such as tooth decay, gum disease, oral cancer, and vitamin deficiencies.
As part of the Canadian Community Health Survey (CCHS), when asked about the personal care of their teeth, 78.3% of Canadians aged 12 and older reported brushing their teeth at least two times per day, while less than half (43.0%) reported flossing their teeth at least once per day.Note 2 Together, just over one-third (37.5%) of Canadians reported meeting the CDA recommendations of both brushing teeth twice a day and flossing daily. Significantly more females (45.3%) than males (29.5%) reported meeting the guidelines for both brushing and flossing.Note 3 Among males, those aged 50 to 64 were the most likely to meet the care recommendations. For females, those aged 50 to 64 and 65 and older were the most likely to meet the guidelines (Chart 1).
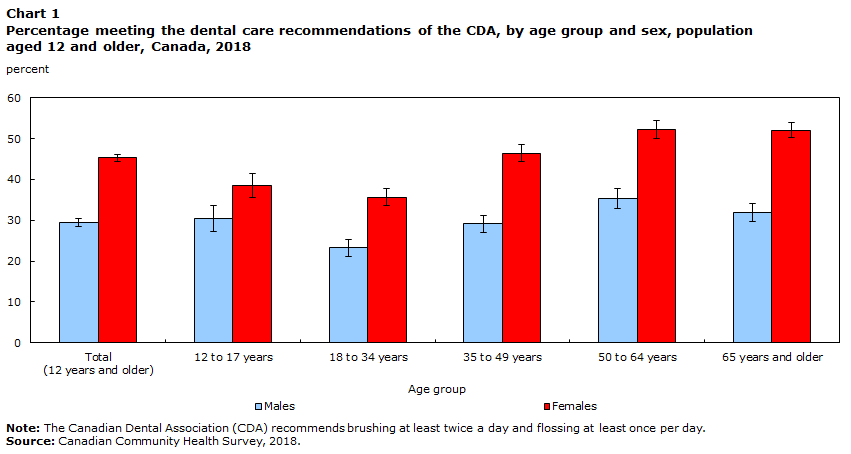
Data table for Chart 1
| Age group | Percent | Confidence Interval | |
|---|---|---|---|
| lower 95% limit | upper 95% limit | ||
| Males | |||
| Total (12 years and older) | 29.5 | 28.4 | 30.5 |
| 12 to 17 years | 30.4 | 27.4 | 33.5 |
| 18 to 34 years | 23.2 | 21.1 | 25.2 |
| 35 to 49 years | 29.1 | 27.0 | 31.2 |
| 50 to 64 years | 35.4 | 33.0 | 37.8 |
| 65 years and older | 31.9 | 29.8 | 34.0 |
| Females | |||
| Total (12 years and older) | 45.3 | 44.3 | 46.2 |
| 12 to 17 years | 38.6 | 35.6 | 41.5 |
| 18 to 34 years | 35.7 | 33.6 | 37.7 |
| 35 to 49 years | 46.4 | 44.3 | 48.5 |
| 50 to 64 years | 52.3 | 50.1 | 54.5 |
| 65 years and older | 52.1 | 50.1 | 54.0 |
|
Note: The Canadian Dental Association (CDA) recommends brushing at least twice a day and flossing at least once per day. Source: Canadian Community Health Survey, 2018. |
|||
Three-quarters of Canadians saw a dental professional in the last year
Overall, 74.7% of Canadians reported that they saw a dental professionalNote 4 in the past year. A lower percentage of males (72.1%) reported visiting a dental professional in the past 12 months compared to females (77.1%). Among both males and females, those aged 12 to 17 were the most likely to report a recent visit to a dental professional (91.5% of males, 92.3% of females). The percentage of females reporting a recent dental visit was lowest among those aged 65 and older (68.8%), while for males the percentage was lowest among those aged 18 to 34 (65.9%) and those aged 65 and older (66.6%; Chart 2).

Data table for Chart 2
| Age group | Percent | Confidence Interval | |
|---|---|---|---|
| Lower 95% limit | Upper 95% limit | ||
| Males | |||
| Total (12 years and older) | 72.1 | 71.2 | 73.1 |
| 12 to 17 years | 91.5 | 89.7 | 93.3 |
| 18 to 34 years | 65.9 | 63.6 | 68.3 |
| 35 to 49 years | 73.9 | 71.9 | 75.8 |
| 50 to 64 years | 75.6 | 73.9 | 77.4 |
| 65 years and older | 66.6 | 64.7 | 68.4 |
| Females | |||
| Total (12 years and older) | 77.1 | 76.3 | 77.9 |
| 12 to 17 years | 92.3 | 90.4 | 94.1 |
| 18 to 34 years | 75.7 | 73.8 | 77.6 |
| 35 to 49 years | 79.8 | 78.0 | 81.6 |
| 50 to 64 years | 78.7 | 77.0 | 80.5 |
| 65 years and older | 68.8 | 67.3 | 70.3 |
|
Note: Respondents were asked to report the last time they visited a dental professional. A dental professional includes dentist, dental hygienist, denturologist, orthodontist, periodontist, dental surgeon or dental therapist.
Source: Canadian Community Health Survey, 2018. |
|||
Just over one-in-five Canadians avoided going to a dentist because of cost
General oral health care is not covered under publicly funded health care insurance, meaning that Canadians have to rely on private insurance, job-based insurance plans, government programs, or pay out of pocket to visit a dental health professional. The use of dental care services is therefore largely influenced by insurance coverage and the ability to pay out of pocket for the expenses. In 2018, 22.4% of Canadians (roughly 6.8 million people) avoided visiting a dental professional due to cost. Females (24.1%) were more likely than males (20.6%) to report cost as a barrier. Canadians aged 18 to 34 (28.3%) were the age group most likely to report cost as a barrier to dental care.
In 2018, 64.6% of Canadians reported they had dental insurance that covered all or part of their expenses. Canadians with dental insurance were more likely to report visiting a dental professional in the past 12 months (82.5%) compared to those without insurance (60.5%). Furthermore, those with insurance were less likely to avoid going to a dental professional due to cost (13.7%) than those who did not have coverage (39.1%).
Canadians living in households with lower income (based on household income quintilesNote 5) were less likely to go to a dental professional, both for those with insurance and for those without. Those who both had dental insurance and lived in households in the highest income quintile were the most likely to have a dental visit (88.5%). Canadians without insurance and in the lowest income quintile were the least likely to see a dental professional in the past year (49.6%; Chart 3).
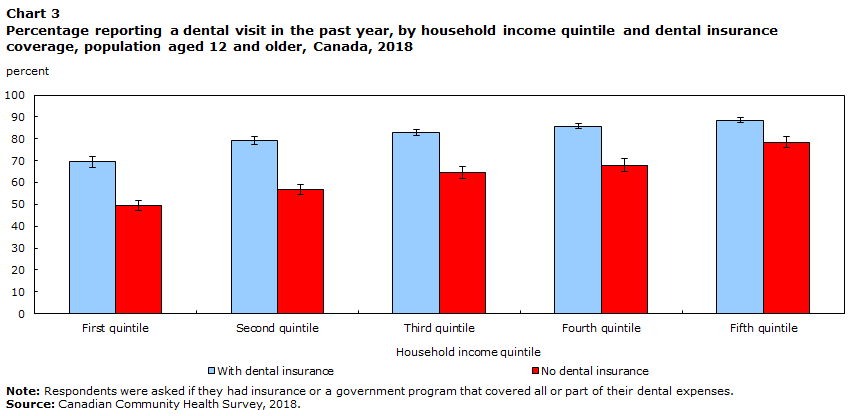
Data table for Chart 3
| Household income quintile | Percent | Confidence Interval | |
|---|---|---|---|
| lower 95% limit | upper 95% limit | ||
| With dental insurance | |||
| First quintile | 69.4 | 66.8 | 72.1 |
| Second quintile | 79.2 | 77.4 | 81.0 |
| Third quintile | 82.8 | 81.2 | 84.3 |
| Fourth quintile | 85.8 | 84.5 | 87.0 |
| Fifth quintile | 88.5 | 87.5 | 89.6 |
| No dental insurance | |||
| First quintile | 49.6 | 47.4 | 51.9 |
| Second quintile | 57.0 | 54.7 | 59.3 |
| Third quintile | 64.7 | 62.0 | 67.5 |
| Fourth quintile | 68.0 | 65.0 | 71.0 |
| Fifth quintile | 78.4 | 75.9 | 81.0 |
|
Note: Respondents were asked if they had insurance or a government program that covered all or part of their dental expenses.
Source: Canadian Community Health Survey, 2018. |
|||
Summary
While most Canadians meet the recommendations for teeth brushing, only a third also floss daily. The majority have also reported seeing a dental professional in the past year, although about one-in-five did avoid going because of the costs. Overall, having dental insurance did lead to more visits and less cost-related avoidance.
References
Canadian Dental Association. (accessed January 4, 2019).
Canadian Dental Association. 2017. The State of Oral Health in Canada. (accessed January 4, 2019).
Millar, W.J., D. Locker. 1999. Dental insurance and use of dental services. Health Reports, Statistics Canada Catalogue no. 82-003 Vol. 11, No. 1. (accessed February 13, 2019).
Millar, W.J. 2004. Dental consultations. Health Reports, Statistics Canada Catalogue no. 82-003 Vol. 16, No. 1. (accessed February 13, 2019).
Statistics Canada. 2010. Oral Health: Edentulous people in Canada 2007 to 2009. Health Fact Sheets, Statistics Canada Catalogue no. 82-625-X. (accessed February 13, 2019).
Data
Additional data from the Canadian Community Health Survey are available from table 13-10-0096-01.
- Date modified: