
Health Fact Sheets
Circumstances surrounding cycling fatalities in Canada, 2006 to 2017

Archived Content
Information identified as archived is provided for reference, research or recordkeeping purposes. It is not subject to the Government of Canada Web Standards and has not been altered or updated since it was archived. Please "contact us" to request a format other than those available.

While cycling, both as a means of transportation and a leisure activity, is a physical activity with recognized health benefits, injury events can occur.
According to data from the Canadian Vital Statistics: Death Database (CVSD), between 2006 and 2017, 890 cyclists died in Canada, an average of 74 deaths per year.Note Over the same period, the age-standardized cycling death rate decreased from 2.5 in 2006 to 1.3 deaths per 1,000,000 population in 2017.Note Similarly, the crude rate of collisions involving a cyclist fell from 228 to 151 per 1,000,000 population between 2006 and 2017.Note
Collisions with a motor vehicle made up 73% of fatal cycling events (CVSD). The other events that led to cycling fatalities include for example, collisions with another cyclist or with a stationary object (25%). In 2% of fatal cycling events the cause remains unknown.
Understanding the circumstances surrounding cycling fatalities is the starting point for implementing preventive measures. Although the circumstances are not always known, important insights can be gained from looking at what has been reported.
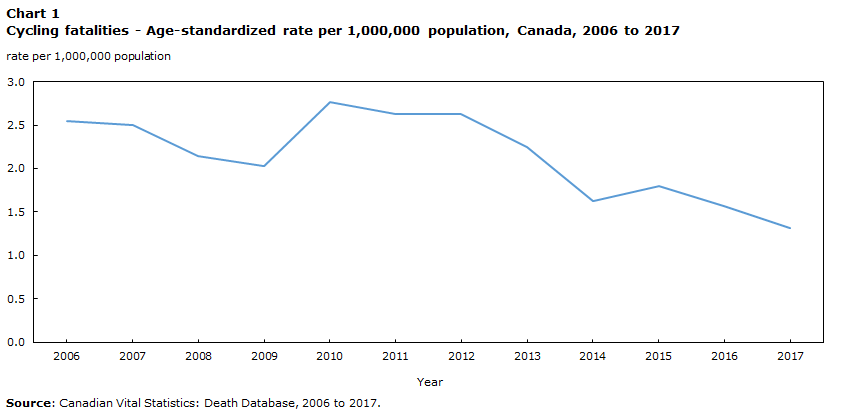
Data table for Chart 1
| Year | Rate per 1,000,000 population |
|---|---|
| 2006 | 2.5 |
| 2007 | 2.5 |
| 2008 | 2.1 |
| 2009 | 2.0 |
| 2010 | 2.8 |
| 2011 | 2.6 |
| 2012 | 2.6 |
| 2013 | 2.2 |
| 2014 | 1.6 |
| 2015 | 1.8 |
| 2016 | 1.6 |
| 2017 | 1.3 |
| Source: Canadian Vital Statistics: Death Database, 2006 to 2017. | |
Nearly 6 male cyclist fatalities were recorded for every female cyclist fatality
From 2006 to 2017, 5.6 male cyclist deaths were recorded for every female cyclist death (CVSD). Just under one-third of deaths involved cyclists aged 50 to 64 years (27%), followed by cyclists aged 35 to 49 years (22%) and 65 years and over (19%). The proportion of deaths was similar for cyclists aged less than 20 years and 20-34 years (16% and 15% respectively).
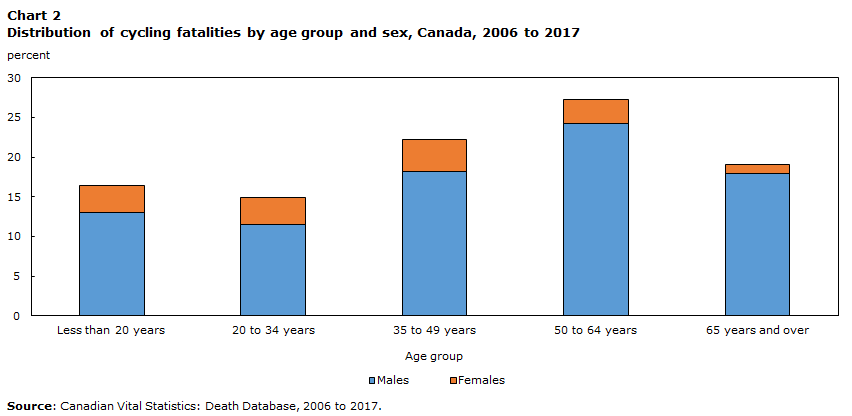
Data table for Chart 2
| Age group | Males | Females |
|---|---|---|
| percent | ||
| Less than 20 years | 13.03 | 3.37 |
| 20 to 34 years | 11.46 | 3.48 |
| 35 to 49 years | 18.20 | 4.04 |
| 50 to 64 years | 24.27 | 3.03 |
| 65 years and over | 17.98 | 1.12 |
| Source: Canadian Vital Statistics: Death Database, 2006 to 2017. | ||
Approximately 1 in 3 cyclists involved in a fatal event was not wearing a helmet
Wearing a helmet is a recognized way to protect against head injuries while cycling. In 48% of cycling fatalities, information about helmet use was reported in the Canadian Coroner and Medical Examiner Database (CCMED).Note From 2006 to 2017, 32% of individuals involved in cycling fatalities were not wearing a helmet.
The proportion of cyclists who died not wearing a helmet was higher among men
In Canada, the proportion of cyclists who reported always wearing a helmet in 2017 was higher among women (49%) than among men (43%).Note According to CCMED data, 34% of male cyclists who died were not wearing a helmet, compared with 21% among female cyclists.

Data table for Chart 3
| Males | Females | |
|---|---|---|
| percent | ||
| Was not wearing a helmet | 33.91 | 20.83 |
| Was wearing a helmet | 13.04 | 15.83 |
| Was probably wearing a helmet | 2.32 | 4.17 |
| Information not available | 50.72 | 59.17 |
|
Notes: Was wearing a helmet refers to the fact that the cyclist was wearing a helmet, but it was not possible to confirm whether the helmet had been worn properly. Was probably wearing a helmet refers to cases when a helmet was observed at the scene of the event, but it was not possible to confirm whether the cyclist had been wearing it. For 52% of the fatalities, the information about helmet use was not available. Data exclude Manitoba, Newfoundland and Labrador, Nova Scotia and Nunavut. For the provinces and territories that are included, data are not available for all of the years (see note to readers). Source: Canadian Coroner and Medical Examiner Database, 2006 to 2017. |
||
The proportion of cyclists who died not wearing a helmet was higher among cyclists under the age of 20
More than 4 cyclists in 10 (44%) under the age of 20 and more than one-third (34%) of those between 20 and 34 years were not wearing a helmet during the fatal event. The proportion of cyclists who were not wearing a helmet was similar among those 50 to 64 years (31%) and those 65 years and over (31%). Among cyclist fatalities between the ages of 35 and 49, 25% were not wearing a helmet.

Data table for Chart 4
| Less than 20 years | 20 to 34 years | 35 to 49 years | 50 to 64 years | 65 years and over | |
|---|---|---|---|---|---|
| percent | |||||
| Was not wearing a helmet | 43.44 | 33.91 | 25.00 | 31.30 | 30.97 |
| Was wearing a helmet | 5.74 | 9.57 | 12.23 | 17.39 | 18.06 |
| Was probably wearing a helmet | 0.82 | 3.48 | 2.13 | 2.61 | 3.87 |
| Information not available | 50.00 | 53.04 | 60.64 | 48.70 | 47.10 |
|
Notes: Was wearing a helmet refers to the fact that the cyclist was wearing a helmet, but it was not possible to confirm whether the helmet had been worn properly. Was probably wearing a helmet refers to cases when a helmet was observed at the scene of the event, but it was not possible to confirm whether the cyclist had been wearing it. For 52% of the fatalities, the information about helmet use was not available. Data exclude Manitoba, Newfoundland and Labrador, Nova Scotia and Nunavut. For the provinces and territories that are included, data are not available for all of the years (see note to readers). Source: Canadian Coroner and Medical Examiner Database, 2006 to 2017. |
|||||
Among cyclists involved in fatal events, 13% were wearing a helmet
Among cyclists involved in fatal events, 13% were wearing a helmet. Unfortunately, even when a helmet is worn, fatal injuries may still occur, such as very severe head injuries or injuries affecting other areas of the body such as the cervical spine or chest. This means that besides wearing a helmet, other factors could play a role in preventing traffic related injuries.
Alcohol and/or drugs may have played a role in 1 out of 10 cycling fatalities
From 2006 to 2017, alcohol and/or drug use by the cyclist may have played a role in 12% of cycling fatalities (CCMED). This represents 13% of male and 3% of female cyclist deaths.
The proportion of cyclists involved in a fatal event while under the influence of alcohol and/or drugs varied by age group. The distribution was very similar among cyclists 20 to 34 years (17%), 35 to 49 years (14%), and 50 to 64 years (14%), however lower among youth aged 14 to 19 years (9%) and those aged 65 years and over (4%).
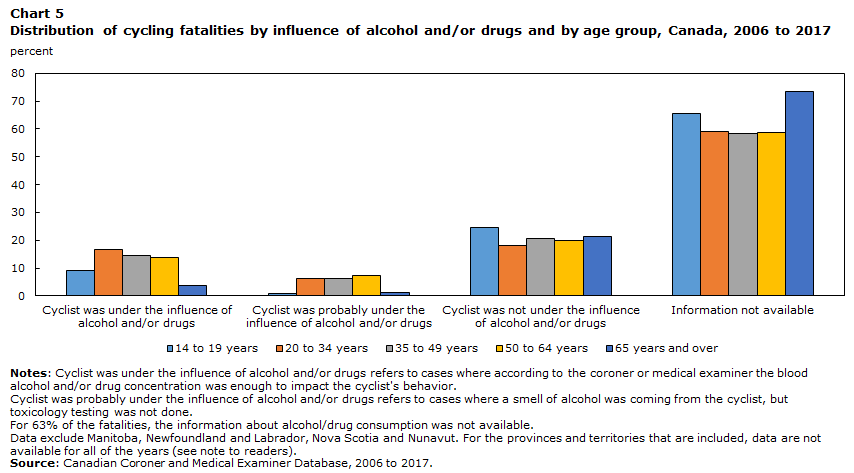
Data table for Chart 5
| Cyclist was under the influence of alcohol and/or drugs | Cyclist was probably under the influence of alcohol and/or drugs | Cyclist was not under the influence of alcohol and/or drugs | Information not available | |
|---|---|---|---|---|
| percent | ||||
| 14 to 19 years | 9.02 | 0.82 | 24.59 | 65.57 |
| 20 to 34 years | 16.52 | 6.09 | 18.26 | 59.13 |
| 35 to 49 years | 14.36 | 6.38 | 20.74 | 58.51 |
| 50 to 64 years | 13.91 | 7.39 | 20.00 | 58.70 |
| 65 years and over | 3.87 | 1.29 | 21.29 | 73.55 |
|
Notes: Cyclist was under the influence of alcohol and/or drugs refers to cases where according to the coroner or medical examiner the blood alcohol and/or drug concentration was enough to impact the cyclist's behavior. Cyclist was probably under the influence of alcohol and/or drugs refers to cases where a smell of alcohol was coming from the cyclist, but toxicology testing was not done. For 63% of the fatalities, the information about alcohol/drug consumption was not available. Data exclude Manitoba, Newfoundland and Labrador, Nova Scotia and Nunavut. For the provinces and territories that are included, data are not available for all of the years (see note to readers). Source: Canadian Coroner and Medical Examiner Database, 2006 to 2017. |
||||
In approximately 1 in 3 cycling fatalities, road safety rules may not have been respected
From 2006 to 2017, not following road safety rules may have played a role in 32% of cycling fatalities (CCMED). It is possible that the cyclist, the other party, or both may not have followed the road safety rules.
A non-exhaustive list of examples are:
- Not stopping at a red light or obeying a stop sign, unsafe lane change or change of direction—both by the cyclist and the other involved party.
- Cyclist wearing dark clothing, no lights on the bike when riding at dusk, riding on the sidewalk, riding against traffic and wearing headphones.
- The involved party speeding, distracted driving, and opening the door of a parked vehicle into the path of the cyclist.
In 10% of fatalities, the coroner or medical examiner could not determine whether a contributing action or inaction had been made by one of the parties, often due to a lack of witnesses or unclear evidence. In 49% of fatalities the information about road safety rules was not available.
More than 5 in 10 cycling deaths occurred in an urban setting
More than 5 in 10 (56%) fatal cycling events occurred in an urban setting, compared with 14% in a rural setting (CCMED).
In both urban and rural areas, 4% of cycling fatalities occurred on bike lanes/paths, despite belief these are considered a safe space for cyclists. Factors observed in these deaths included vehicles and cyclists not properly sharing the road, cyclists’ not obeying a stop sign or red light, and collisions between cyclists. The information about setting and whether or not the cyclist was riding on a bike lane/path was not available in some cases (30% and 65% respectively).
Most cycling fatalities occurred during evening rush hour
The time of occurrence of the event was known in 51% of cycling fatalities. Between 16:01 and 20:00 is when the highest percentage (16%) of cycling fatalities occurred. This period corresponds to the late afternoon rush hour and the onset of nightfall.
Environmental conditions that affect visibility, such as darkness, rain or blinding sunlight, appear to have played a role in 21% of fatal cycling events.
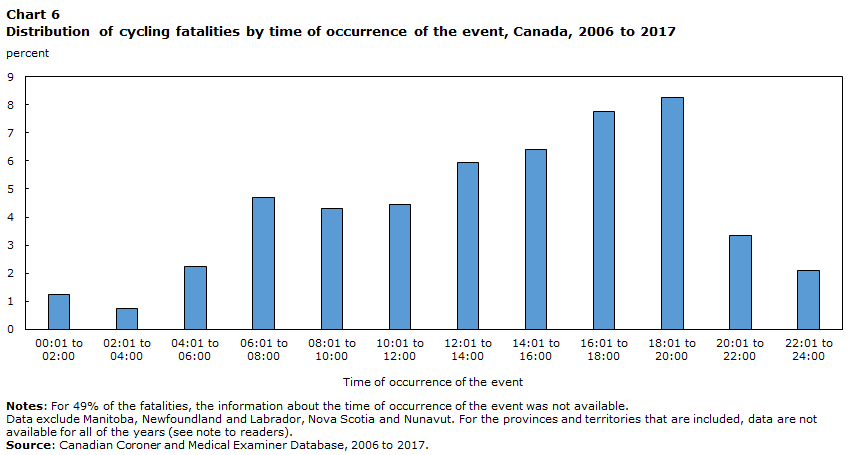
Data table for Chart 6
| Time of occurrence of the event | Percent |
|---|---|
| 00:01 to 02:00 | 1.23 |
| 02:01 to 04:00 | 0.74 |
| 04:01 to 06:00 | 2.22 |
| 06:01 to 08:00 | 4.69 |
| 08:01 to 10:00 | 4.32 |
| 10:01 to 12:00 | 4.44 |
| 12:01 to 14:00 | 5.93 |
| 14:01 to 16:00 | 6.42 |
| 16:01 to 18:00 | 7.78 |
| 18:01 to 20:00 | 8.27 |
| 20:01 to 22:00 | 3.33 |
| 22:01 to 24:00 | 2.10 |
|
Notes: For 49% of the fatalities, the information about the time of occurrence of the event was not available. Data exclude Manitoba, Newfoundland and Labrador, Nova Scotia and Nunavut. For the provinces and territories that are included, data are not available for all of the years (see note to readers). Source: Canadian Coroner and Medical Examiner Database, 2006 to 2017. |
|
Note to readers
The Canadian Coroner and Medical Examiner Database was developed at Statistics Canada in collaboration with the 13 provincial and territorial Chief Coroners and Chief Medical Examiners and the Public Health Agency of Canada. Currently, it combines data from all provincial and territorial databases, with the exception of Manitoba and Newfoundland and Labrador. Data for Nova Scotia and Nunavut were excluded from this fact sheet as counts are not reflective of what is included in their respective jurisdictional databases. For the provinces and territories included in this fact sheet, the data are not available for all years. Data for Ontario, British Columbia, Quebec and the Northwest Territories are available from 2006 to 2017. Data for Prince Edward Island and New Brunswick are available from 2006 to 2016. Data for Saskatchewan and Yukon are available from 2006 to 2014. Data for Alberta are available from 2006 to 2010. All data are considered preliminary and include only closed cases. Closed cases refer to those whose investigation and inquest are complete and the manner of death is final.
At the time this fact sheet was written, 810 cycling fatalities were documented in the CCMED. CCMED data coverage varies from one variable to another.
The proportion of missing data by variable is as follows:
- Wearing a helmet: 52%
- Alcohol or drug consumption: 63%, including 4% of children under the age of 15
- Information regarding road safety rules: 49%
- Rural or urban setting: 30%
- Cyclist riding on bike lane/path at the time of the fatal event: 65%
- Time of event: 49%
- Environmental conditions that affect visibility: 38%
In light of the data coverage, the findings of this fact sheet must be interpreted with caution.
References
Götschi, T., J. Garrard and B. Giles-Corti. 2016. Cycling as a Part of Daily Life: A Review of Health Perspectives. Transport Reviews. Vol. 36, no 1. (accessed June 4, 2019).
Goudie, R. and J.L. Page. 2013. Canadian Academy of Sport and Exercise Medicine position statement: Mandatory use of bicycle helmets. Clinical Journal of Sport Medicine. Vol 23, 2013, p. 417-418. (accessed June 14, 2019)
Office of the Chief Coroner. 2012. Cycling Death Review. Ontario Ministry of Community Safety and Correctional Services. (accessed May 3, 2019).
Ramage-Morin, P. L. 2017. Cycling in Canada. Statistics Canada Catalogue no. 82-003-X. Ottawa, Ontario. (accessed June 15, 2019).
Transport Canada. 2011. Road safety in Canada. Catalogue number T46-54/1-2011E. ISBN 978-1-100-18621-4. (accessed July 5, 2019)
- Date modified: