
Health Fact Sheets
Overweight and obese adults, 2018

Archived Content
Information identified as archived is provided for reference, research or recordkeeping purposes. It is not subject to the Government of Canada Web Standards and has not been altered or updated since it was archived. Please "contact us" to request a format other than those available.

In 2018, 26.8% of Canadians 18 and older (roughly 7.3 million adults) reported height and weight that classified them as obese.1 2 Another 9.9 million adults (36.3%) were classified as overweight – bringing the total population with increased health risks due to excess weight to 63.1% in 2018. This was an increase from 2015 where 61.9% of Canadians aged 18 and older were overweight or obese.3
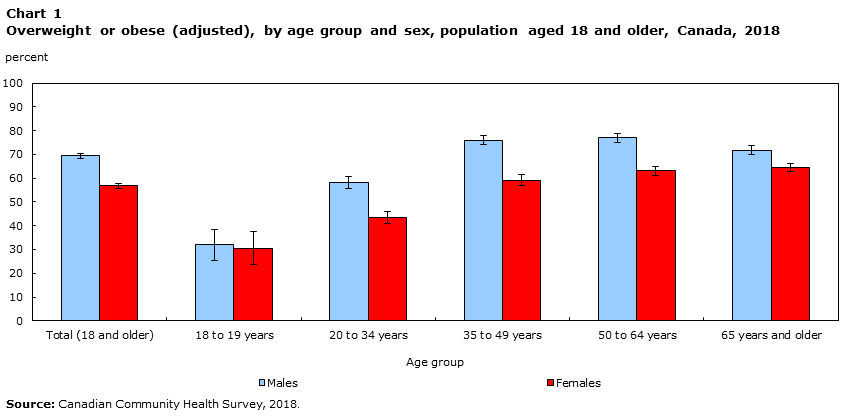
Overall, the proportion of adults who were overweight or obese was higher among males (69.4%) than among females (56.7%).In fact, the proportion who were overweight or obese was higher for males for all age groups starting at age 20. There was no difference between the sexes for those aged 18 and 19 (Chart 1).
Data table for Chart 1
| Age group | Percent | Confidence Interval | |
|---|---|---|---|
| Lower 95% limit | Upper 95% limit | ||
| Males | |||
| Total (18 and older) | 69.4 | 68.4 | 70.5 |
| 18 to 19 years | 31.9 | 25.5 | 38.3 |
| 20 to 34 years | 58.2 | 55.8 | 60.7 |
| 35 to 49 years | 76.0 | 74.1 | 77.9 |
| 50 to 64 years | 76.9 | 74.9 | 78.8 |
| 65 years and older | 71.8 | 69.9 | 73.6 |
| Females | |||
| Total (18 and older) | 56.7 | 55.6 | 57.8 |
| 18 to 19 years | 30.6 | 23.6 | 37.7 |
| 20 to 34 years | 43.6 | 41.2 | 46.1 |
| 35 to 49 years | 59.2 | 57.0 | 61.4 |
| 50 to 64 years | 63.1 | 61.0 | 65.1 |
| 65 years and older | 64.6 | 62.9 | 66.2 |
| Source: Canadian Community Health Survey, 2018. | |||
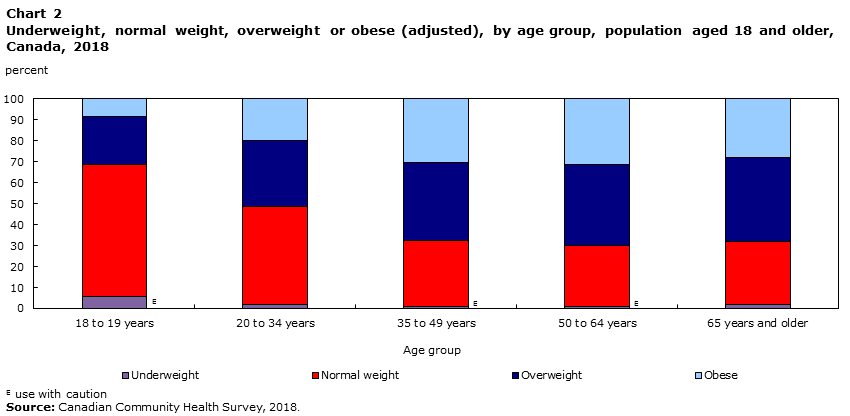
In 2018, the proportion of adults classified as normal weight decreased with age from 18 up to age 64. The proportion classified as underweight was highest amongst those aged 18 or 19 (Chart 2).4
Data table for Chart 2
| Underweight | Normal weight | Overweight | Obese | |
|---|---|---|---|---|
| percent | ||||
| 18 to 19 years | 5.7Note E: Use with caution | 63.1 | 22.6 | 8.6 |
| 20 to 34 years | 1.9 | 46.9 | 31.4 | 19.9 |
| 35 to 49 years | 1.0Note E: Use with caution | 31.4 | 37.4 | 30.3 |
| 50 to 64 years | 1.2Note E: Use with caution | 28.7 | 38.8 | 31.3 |
| 65 years and older | 1.7 | 30.4 | 39.9 | 28.1 |
|
E use with caution Source: Canadian Community Health Survey, 2018. |
||||
Obese adults
The proportion of residents aged 18 and older who were obese was lower than the national average (26.8%) in:
- Quebec (25.0%)
- British Columbia (23.1%)
The proportion of residents aged 18 and older who were obese was higher than the national average in:
- Newfoundland and Labrador (40.2%)
- Prince Edward Island (37.8%)
- Nova Scotia (33.7%)
- New Brunswick (35.3%)
- Manitoba (30.8%)
- Saskatchewan (34.8%)
- Alberta (28.8%)
The proportion of residents in Ontario who were obese (26.1%) was about the same as the national average.
The highest level of education attained by household members had a significant impact on the proportion of adults who were obese. The proportion of adults who were obese decreased as education increased, from 34.5% among households where the highest level of education was less than secondary school graduation to 25.5% where at least one household member had completed post-secondary education.
Obesity can increase the risk of certain health conditions such as diabetes, high blood pressure and heart disease.5 In 2018, the prevalence of type 2 diabetes was higher among Canadians who were obese (13.4%) compared to Canadians with a normal weight (2.9%). Adults who were obese were also more likely to be diagnosed with high blood pressure (29.5%) and heart disease (6.0%); among adults with a normal weight, the prevalence was 9.5% for high blood pressure and 2.7% for heart disease.
Start of text boxAbout Overweight and obese adults
Obesity has been linked with many chronic diseases, including hypertension, type 2 diabetes, cardiovascular disease, osteoarthritis and certain types of cancer.
To assess the health risks of obesity, the World Health Organization and Health Canada use guidelines based on Body Mass Index (BMI)6, a measure that examines weight in relation to height. BMI is defined as weight in kilograms divided by the square of the height in metres (Table 1). BMI is calculated for the population aged 18 and older, excluding pregnant women, and persons less than 3 feet (0.914 metres) tall or greater than 6 feet 11 inches (2.108 metres).
| Height | UnderweightNote * | Normal weight | OverweightNote * | ObeseNote ** |
|---|---|---|---|---|
| 5’4” | less than 108.4 lbs | 108.4 to 146.4 lbs | 146.5 to 175.7 lbs | 175.8 lbs or more |
| 5’8” | less than 122.1 lbs | 122.1 to 164.9 lbs | 165.0 to 197.9 lbs | 198.0 lbs or more |
| 6’0” | less than 136.6 lbs | 136.6 to 184.5 lbs | 184.6 to 221.4 lbs | 221.5 lbs or more |
| 1.63 m | less than 49.2 kg | 49.2 to 66.4 kg | 66.5 to 79.6 kg | 79.7 kg or more |
| 1.73 m | less than 55.4 kg | 55.4 to 74.8 kg | 74.9 to 89.7 kg | 89.8 kg or more |
| 1.83 m | less than 62.0 kg | 62.0 to 83.6 kg | 83.7 to 100.4 kg | 100.5 kg or more |
|
||||
About self-reported and directly measured body mass index data
Body mass index (BMI) can be computed using self-reported values, where the respondent is asked their height and weight, or by directly measuring respondents’ height and weight.
Although directly measured data provide more accurate values of BMI, it is more costly and time-consuming to gather. Gathering measured data means interviewers require special training, and people may be less likely to participate because they find it more intrusive.
Self-reported data are less expensive and easier to gather than measured data: this is beneficial when sampling large numbers of people. However, self-reported data are subject to respondent biases—people may not know their height or weight. As well, their response may reflect perceived social and cultural norms about the ideal height and weight. Consequently, adults tend to underestimate their weight and overestimate their height, resulting in underestimation of their BMI.
Correction equations2 were developed for adults (18 and over) so that self-reported data, which offers the advantage of large sample size, could be adjusted for respondent biases to approximate measured estimates, which are more accurate. The correction equations were developed using data from a 2005 Canadian Community Health Survey subsample. In the subsample, self-reported values were collected first and then interviewers took physical measurements. The BMI estimates presented in this fact sheet have been calculated using these correction factors.
More information on the differences between self-reported and directly measured data has been previously published in "Bias in self-reported estimates of obesity in Canadian health surveys: an update on correction equations for adults" and "Adjusting the scales: Obesity in Canada after correcting for respondent bias."
References
Connor Gorber, S., M. Shields, M.S. Tremblay, and I. McDowell. 2008. The feasibility of establishing correction factors to adjust self-reported estimates of obesity. Health Reports. Statistics Canada Catalogue number 82-003, Vol. 19, no. 3. (accessed January 17th, 2017).
Connor Gorber, S., M. Tremblay, D. Moher, and B Gorber. 2007. A comparison of direct vs. self-report measures for assessing height, weight and body mass index: a systematic review. Obesity Reviews. Vol. 8, no. 4. (accessed January 17th, 2017).
Health Canada. Obesity. 2006. (accessed April 3rd, 2019).
Navanellan T., and T. Janz. 2014. Adjusting the scales: Obesity in the Canadian population after correcting for respondent bias Health at a Glance. Statistics Canada Catalogue no. 82-624. (accessed March 15th, 2017).
Shields, M., S. Connor Gorber, and M.S. Tremblay. 2008. Effects of measurement on obesity and morbidity. Health Reports. Statistics Canada Catalogue no. 82-003. Vol. 19, no. 2. (accessed January 17th, 2017).
Shields M, S. Connor Gorber, and M.S. Tremblay. 2008. Estimates of obesity based on self-report versus direct measures. Health Reports Statistics Canada Catalogue no. 82-003. Vol. 19, no. 2. (accessed January 17th, 2017).
Shields M, S. Connor Gorber, I. Janssen, and M.S. Tremblay. 2011. Bias in self-reported estimates of obesity in Canadian health surveys: an update on correction equations for adults. Health Reports Statistics Canada Catalogue no. 82-003. Vol, 22, no. 3. (accessed January 17th, 2017).
Tjempkema, M. 2006. Adult Obesity. Health Reports. Statistics Canada Catalogue no. 82-003. Vol. 17, no. 3. (accessed January 17th, 2017).
Data
Additional data from the Canadian Community Health Survey are available from table 13-10-0096-01.
- Date modified: