
Health Fact Sheets
Chronic Conditions, 2017

Archived Content
Information identified as archived is provided for reference, research or recordkeeping purposes. It is not subject to the Government of Canada Web Standards and has not been altered or updated since it was archived. Please "contact us" to request a format other than those available.

Arthritis
In 2017, 19.3% of Canadians aged 15 and older (roughly 5.7 million people) reported that they had arthritis.Note 1Note 2 This proportion was lower than 2016 (20.6%).Note 3
Females were more likely than males to report that they had arthritis. In 2017, the chronic condition was prevalent among 22.4% of females and 16.0% of males. Among both sexes, the percentage reporting arthritis increased with age, with the highest prevalence among those aged 75 and older (Chart 1).
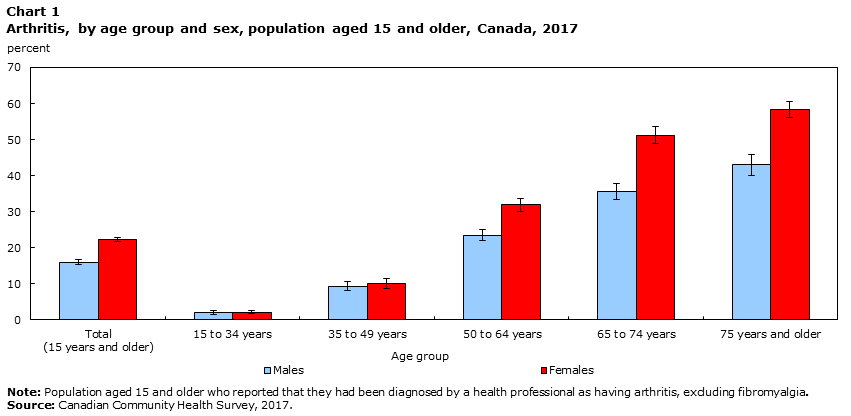
Data table for Chart 1
| Age group | Males | Females | ||||
|---|---|---|---|---|---|---|
| percent | Lower 95% confidence interval | Upper 95% confidence interval | percent | Lower 95% confidence interval | Upper 95% confidence interval | |
| Total (15 years and older) |
16.0 | 15.4 | 16.7 | 22.4 | 21.7 | 23.0 |
| 15 to 34 years | 2.0 | 1.6 | 2.5 | 2.2 | 1.7 | 2.6 |
| 35 to 49 years | 9.4 | 8.2 | 10.6 | 10.1 | 8.8 | 11.4 |
| 50 to 64 years | 23.5 | 21.9 | 25.1 | 32.0 | 30.1 | 33.8 |
| 65 to 74 years | 35.6 | 33.3 | 37.8 | 51.2 | 48.9 | 53.5 |
| 75 years and older | 43.0 | 40.0 | 46.0 | 58.4 | 56.1 | 60.7 |
|
Note: Population aged 15 and older who reported that they had been diagnosed by a health professional as having arthritis, excluding fibromyalgia. Source: Canadian Community Health Survey, 2017. |
||||||
In 2017, life satisfaction was lower among those with arthritis. Of arthritis sufferers, 86.3% reported they were satisfied or very satisfied with life compared with 94.1% of those who did not have arthritis.
Mood disorders
In 2017, 8.6% of Canadians aged 12 and older (roughly 2.6 million people) reported that they had a mood disorder. Mood disorders include mental health conditions such as depression, bipolar disorder, mania or dysthymia but exclude anxiety disorders. This proportion remained consistent with 2016 (8.4%).
A lower percentage of males (6.4%) reported having a mood disorder compared to females (10.7%). Males and females aged 12 to 17 were least likely to report a mood disorder (4.5%). For those between the ages of 18 and 64, around 9% had a mood disorder (Chart 2).

Data table for Chart 2
| Age group | Males | Females | ||||
|---|---|---|---|---|---|---|
| percent | Lower 95% confidence interval | Upper 95% confidence interval | percent | Lower 95% confidence interval | Upper 95% confidence interval | |
| Total (12 years and older) |
6.4 | 6.0 | 6.9 | 10.7 | 10.1 | 11.2 |
| 12 to 17 years | 2.7Note E: Use with caution | 1.9 | 3.6 | 6.4 | 4.9 | 7.8 |
| 18 to 34 years | 6.3 | 5.4 | 7.1 | 11.5 | 10.3 | 12.7 |
| 35 to 49 years | 6.7 | 5.8 | 7.6 | 11.4 | 10.3 | 12.6 |
| 50 to 64 years | 7.7 | 6.8 | 8.6 | 12.1 | 11.0 | 13.2 |
| 65 years and older | 6.0 | 5.1 | 6.8 | 8.4 | 7.5 | 9.3 |
|
E use with caution Note: Population aged 12 and older who reported that they had been diagnosed by a health professional as having a mood disorder, such as depression, bipolar disorder, mania or dysthymia. Source: Canadian Community Health Survey, 2017. |
||||||
Research has shown that mood disorders frequently co-occur with other mental illnesses, such as anxiety disorders.Note 4 In 2017, of those who reported being diagnosed with a mood disorder, 50.0% also reported being diagnosed with an anxiety disorder.
Bowel disorders
In 2017, 4.8% of Canadians aged 12 and older (roughly 1.5 million people) reported that they had a bowel disorder. A lower percentage of males (2.8%) reported having a bowel disorder compared to females (6.7%). Bowel disorders were least prevalent among Canadians aged 12 to 34 (2.5%), compared to other age groups (around 6%, Chart 3).

Data table for Chart 3
| Age group | Males | Females | ||||
|---|---|---|---|---|---|---|
| percent | Lower 95% confidence interval | Upper 95% confidence interval | percent | Lower 95% confidence interval | Upper 95% confidence interval | |
| Total (12 years and older) | 2.8 | 2.5 | 3.1 | 6.7 | 6.3 | 7.1 |
| 12 to 34 years | 1.7 | 1.3 | 2.1 | 3.3 | 2.8 | 3.7 |
| 35 to 49 years | 2.9 | 2.3 | 3.5 | 7.1 | 6.2 | 8.0 |
| 50 to 64 years | 3.8 | 3.1 | 4.5 | 9.1 | 8.0 | 10.1 |
| 65 to 74 years | 3.3 | 2.5 | 4.1 | 8.6 | 7.6 | 9.6 |
| 75 years and older | 3.7 | 2.8 | 4.7 | 9.2 | 7.9 | 10.4 |
|
Note: Population aged 12 and older who reported that they had been diagnosed by a health professional as having a bowel disorder. Source: Canadian Community Health Survey, 2017. |
||||||
Life satisfaction was lower for those with a bowel disorder. In 2017, 84.5% of those with a bowel disorder reported being satisfied or very satisfied with life compared with 93.3% of those without the condition.
Allergies
In 2017, 27.3% of Canadians aged 12 and older (roughly 8.4 million people) reported having allergies that had been diagnosed as a result of allergy tests. Overall, females (28.9%) were more likely to report having allergies than males (25.6%). The percentage of females reporting allergies was lowest among those aged 12 to 17, while for males, the percentage was lowest among those aged 65 and older.
Canadians most commonly reported being allergic to pollens or grasses (40.7%), followed by certain animals (28.5%), dust mites (27.3%) and certain medications (28.0%, Chart 4). Among allergy sufferers, roughly 3.6 million people (42.8%) reported being allergic to multiple allergens.
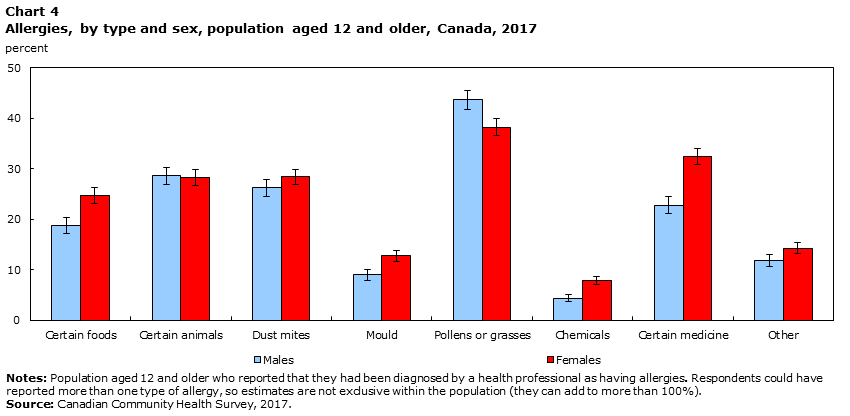
Data table for Chart 4
| Males | Females | |||||
|---|---|---|---|---|---|---|
| percent | Lower 95% confidence interval | Upper 95% confidence interval | percent | Lower 95% confidence interval | Upper 95% confidence interval | |
| Certain foods | 18.8 | 17.3 | 20.4 | 24.7 | 23.2 | 26.3 |
| Certain animals | 28.6 | 26.9 | 30.3 | 28.3 | 26.8 | 29.9 |
| Dust mites | 26.2 | 24.5 | 27.8 | 28.4 | 26.8 | 29.9 |
| Mould | 9.0 | 8.0 | 10.1 | 12.8 | 11.8 | 13.9 |
| Pollens or grasses | 43.6 | 41.6 | 45.5 | 38.2 | 36.6 | 39.9 |
| Chemicals | 4.4 | 3.6 | 5.1 | 7.9 | 7.1 | 8.7 |
| Certain medicine | 22.8 | 21.1 | 24.5 | 32.4 | 30.9 | 34.0 |
| Other | 11.9 | 10.7 | 13.1 | 14.3 | 13.1 | 15.4 |
|
Notes: Population aged 12 and older who reported that they had been diagnosed by a health professional as having allergies. Respondents could have reported more than one type of allergy, so estimates are not exclusive within the population (they can add to more than 100%). Source: Canadian Community Health Survey, 2017. |
||||||
A history of allergies is a known risk factor for developing asthma.Note 5 Among those diagnosed with allergies, 63.0% also reported having asthma.
Start of text boxThe Canadian Community Health Survey includes questions on multiple chronic health conditions including arthritis, mood disorders, bowel disorders and allergies. Respondents are asked about conditions that are expected to last or have already lasted 6 months or more and that have been diagnosed by a health professional.
Arthritis describes many conditions that affect joints, the tissue surrounding joints, and other connective tissue. The most common types are osteoarthritis and rheumatoid arthritis. The resulting pain, stiffness, swelling and/or deformity of the joints can substantially reduce quality of life.Note 6
Mood disorders, such as depression, bipolar disorder, mania or dysthymia, can greatly affect the lives of those who have them. The impact of depression on job performance has been estimated to be greater than that of chronic conditions such as arthritis, hypertension, back problems or diabetes.Note 7
Bowel disorders describes many conditions that cause inflammation or dysregulation of the gastrointestinal (GI) tract. It includes inflammatory bowel disease (Crohn’s disease and ulcerative colitis), irritable bowel syndrome and bowel incontinence. As a result of the symptoms produced by these disorders, quality of life is often reduced.Note 8
Allergies involve an abnormal or hypersensitive reaction of the immune system when it encounters certain substances (e.g. certain foods, certain animals, dust mites, etc.). The variety of symptoms produced can have an impact on quality of life and in the case of anaphylaxis can be life threatening. Most require long term management and are closely linked to asthma.Note 9
References
Chen, Y., H. Johansen, S. Thillaiampalam, and C. Sambell. 2005. Asthma. Health Reports. Statistics Canada Catalogue no. 82-003. Vol. 16, no. 2. (accessed July 4, 2018).
Crohn’s and Colitis Foundation of Canada. 2012. The Impact of Inflammatory Bowel Disease in Canada. Final report and recommendations. (accessed July 12, 2018).
Gilmour, H. and B. P. Scott. 2007. Depression and work impairment. Health Reports. Statistics Canada Catalogue no. 82-003 Vol. 18 no. 1. (accessed July 4, 2018).
Orpana, H., L. Lemyre, and R. Gravel. 2009. Income and psychological distress: The role of the social environment. Health Reports. Statistics Canada Catalogue no. 82-003. Vol. 20, no. 1. (accessed July 4, 2018).
Pawankar R., GW. Canonica, ST. Holgate, RF. Lockey, and M. Blaiss. 2013. The WAO White Book on Allergy (Update). World Allergy Organization. (accessed July 12, 2018).
Pearson, C., T. Janz and J. Ali. 2013. Mental and substance use disorders in Canada. Health at a Glance. Statistics Canada Catalogue no. 82-624-X. (accessed July 12, 2018).
Shields, M. 2006. Stress and depression in the employed population. Health Reports. Statistics Canada Catalogue no. 82-003. Vol. 17 no. 4. (accessed July 4, 2018).
The Arthritis Society. http://www.arthritis.ca (accessed July 4, 2018).
Wilkins, K. 1999. Hormone replacement therapy and incident arthritis. Health Reports. Statistics Canada Catalogue no. 82-003. Vol. 11, no. 2. (accessed July 4, 2018).
Wilkins, K. 2004. Bipolar I disorder, social support and work. Health Reports. Statistics Canada Catalogue no. 82-003. Vol. 15. (accessed July 4, 2018).
Wilkins, K. 2004. Incident arthritis in relation to excess weight. Health Reports. Statistics Canada Catalogue no. 82-003. Vol. 15, no. 1. (accessed July 4, 2018).
Data
Additional data from the Canadian Community Health Survey are available from table 13-10-0096-01.
- Date modified: