
Health Fact Sheets
Low birth weight newborns in Canada, 2000 to 2013

Archived Content
Information identified as archived is provided for reference, research or recordkeeping purposes. It is not subject to the Government of Canada Web Standards and has not been altered or updated since it was archived. Please "contact us" to request a format other than those available.

Low birth weight rates are strong indicators of numerous public health problems. For example, low birth weight infants have a higher risk of sudden death syndrome (SIDS), diabetes, hypertension, heart disease, asthma, hearing problems, and blindness.Note 1Note 2Note 3Note 4Note 5Note 6 This fact sheet analyzes Canadian low birth weight newborns (live births) relative to the child’s sex, child’s birth-order, mother’s age at time of birth, and by geographic location (province or territory).
Start of text box
About low birth weight
Low birth weight is defined by the World Health Organization (WHO) as the weight of an infant at birth of less than 2,500 grams (5.5 pounds) irrespective of the gestational age of the infant.Note 7
End of text box
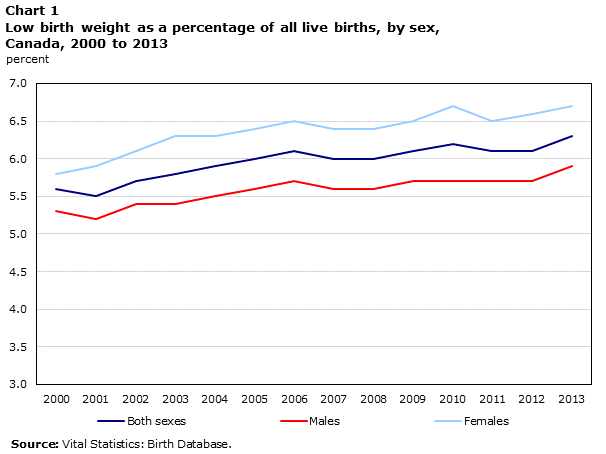
Higher proportion of female births at risk with low birth weight
Over the last fourteen years, the proportion of births that were low birth weight babies increased for both males and females, but more so among females. The proportion of female low birth weight births increased from 5.8% in 2000 to 6.7% in 2013, while a smaller increase was observed among males (5.3% to 5.9%) (Chart 1).
Data table for Chart 1
| Year | Both sexes | Males | Females |
|---|---|---|---|
| percent | |||
| 2000 | 5.6 | 5.3 | 5.8 |
| 2001 | 5.5 | 5.2 | 5.9 |
| 2002 | 5.7 | 5.4 | 6.1 |
| 2003 | 5.8 | 5.4 | 6.3 |
| 2004 | 5.9 | 5.5 | 6.3 |
| 2005 | 6.0 | 5.6 | 6.4 |
| 2006 | 6.1 | 5.7 | 6.5 |
| 2007 | 6.0 | 5.6 | 6.4 |
| 2008 | 6.0 | 5.6 | 6.4 |
| 2009 | 6.1 | 5.7 | 6.5 |
| 2010 | 6.2 | 5.7 | 6.7 |
| 2011 | 6.1 | 5.7 | 6.5 |
| 2012 | 6.1 | 5.7 | 6.6 |
| 2013 | 6.3 | 5.9 | 6.7 |
| Source: Vital Statistics: Birth Database. | |||
Age of mother can be associated with low birth weight
The age of the mother can be associated with a newborn’s birth weight. Among women less than 20 years of age, the proportion of all live births that were low birth weight babies generally decreased from 2000 to 2008, but consistently increased from 2009 to 2013. Comparatively, the proportion of births that were low birth weight births increased slightly among mothers aged 20 to 34 years and increased even more so among mothers aged 35 to 49 years (Chart 2). The proportion of live births that were low weight babies was consistently higher among women aged 35 to 49 years than among mothers in the most common childbearing years (ages 20 to 34). In 2013, 7.5% of the babies born to mothers aged 35 to 49 years were considered low birth weight babies, compared to 5.9% for mothers aged 20 to 34 years and 6.6% for mothers less than 20 years of age.

Data table for Chart 2
| Year | Under 20 years | 20 to 34 years | 35 to 49 years |
|---|---|---|---|
| percent | |||
| 2000 | 6.8 | 5.3 | 6.6 |
| 2001 | 7.0 | 5.2 | 6.6 |
| 2002 | 6.4 | 5.4 | 6.8 |
| 2003 | 6.7 | 5.5 | 6.9 |
| 2004 | 6.6 | 5.6 | 6.9 |
| 2005 | 6.6 | 5.7 | 7.1 |
| 2006 | 6.8 | 5.8 | 7.0 |
| 2007 | 6.3 | 5.7 | 7.1 |
| 2008 | 6.5 | 5.7 | 7.0 |
| 2009 | 5.9 | 5.8 | 7.5 |
| 2010 | 6.2 | 5.8 | 7.6 |
| 2011 | 6.3 | 5.8 | 7.4 |
| 2012 | 6.4 | 5.8 | 7.4 |
| 2013 | 6.6 | 5.9 | 7.5 |
| Source: Vital Statistics: Birth Database. | |||
Second-order births least likely to be low birth weight babies
Parity refers to the number of live births a female has had to date. In terms of parity, second-order babies were less likely to be low birth weight births than either first-order live births or third- or higher-order births. In 2013, 5.8% of second-order births were low birth weight babies, compared to 6.5% for first-order and 6.6% for third- or higher-order births (Chart 3). Since 2000, there has been a gradual increase in the low birth weight share of births among all birth orders.Note 8

Data table for Chart 3
| Year | First birth | Second birth | Third or higher birth order |
|---|---|---|---|
| percent | |||
| 2000 | 6.0 | 4.9 | 5.8 |
| 2001 | 5.9 | 4.9 | 5.9 |
| 2002 | 6.1 | 5.1 | 6.2 |
| 2003 | 6.2 | 5.1 | 6.3 |
| 2004 | 6.2 | 5.2 | 6.5 |
| 2005 | 6.3 | 5.3 | 6.6 |
| 2006 | 6.4 | 5.3 | 6.8 |
| 2007 | 6.3 | 5.4 | 6.5 |
| 2008 | 6.3 | 5.4 | 6.4 |
| 2009 | 6.3 | 5.5 | 6.6 |
| 2010 | 6.5 | 5.5 | 6.6 |
| 2011 | 6.5 | 5.4 | 6.6 |
| 2012 | 6.8 | 5.2 | 6.4 |
| 2013 | 6.5 | 5.8 | 6.6 |
| Source: Vital Statistics: Birth Database. | |||
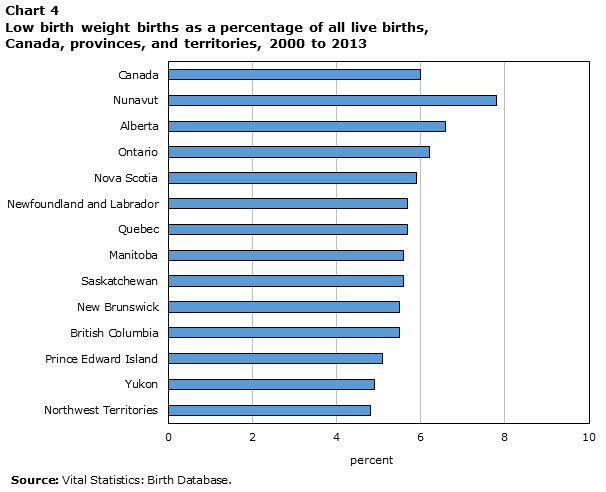
Low birth weight births by province or territory
While annual provincial and territorial low birth weight rates fluctuated between 2000 and 2013, notable differences are evident when the period is analyzed as a whole. Of all the births in Canada during the years 2000 through 2013, Nunavut had the highest proportion of low birth weight births (7.8%), followed by Alberta (6.6%), Ontario (6.2%) and Nova Scotia (5.9%) (Chart 4). Provinces and territories with the smallest low birth weight share of births were the Northwest Territories (4.8%), Yukon (4.9%), and Prince Edward Island (5.1%). The remaining provinces and territories ranged between 5.5% and 5.7%. The low birth weight share of births for Canada as a whole was 6.0% during this period.
Data table for Chart 4
| Province and Territories | Percent |
|---|---|
| Northwest Territories | 4.8 |
| Yukon | 4.9 |
| Prince Edward Island | 5.1 |
| British Columbia | 5.5 |
| New Brunswick | 5.5 |
| Saskatchewan | 5.6 |
| Manitoba | 5.6 |
| Quebec | 5.7 |
| Newfoundland and Labrador | 5.7 |
| Nova Scotia | 5.9 |
| Ontario | 6.2 |
| Alberta | 6.6 |
| Nunavut | 7.8 |
| Canada | 6.0 |
| Source: Vital Statistics: Birth Database. | |
Data
Additional data on Canadian births and characteristics of mothers are available in CANSIM tables 102-4501 to 102-4513.
- Date modified: