
Health Fact Sheets
Blood pressure of children and youth, 2012 to 2015

Archived Content
Information identified as archived is provided for reference, research or recordkeeping purposes. It is not subject to the Government of Canada Web Standards and has not been altered or updated since it was archived. Please "contact us" to request a format other than those available.
The results of the 2012 to 2015Note 1 Canadian Health Measures Survey (CHMS) indicate that the average resting blood pressure of children and youth aged 6 to 19 was 97/62 mmHg. Among this group, 93% had a measured blood pressure that was considered normal and 7% had results considered borderline or elevated (data not shown).
In children aged 6 to 11, average resting blood pressure was 94/62 mmHg, while youth aged 12 to 19 had an average resting blood pressure of 99/63 mmHg.
The proportion of girls aged 12 to 19 with blood pressure in the normal range was significantly higher than that of girls aged 6 to 11 (Chart 1).

Data table for Chart 1
| Normal | Borderline or elevated | ||
|---|---|---|---|
| percent | |||
| Total | 6 to 11 years | 91 | 9 |
| 12 to 19 years | 94.8 | 5,2Note E: Use with caution | |
| Boys | 6 to 11 years | 92.7 | 7.3 |
| 12 to 19 years | 93.7 | 5,3Note E: Use with caution | |
| Girls | 6 to 11 years | 89.1 | 10.9 |
| 12 to 19 years | 95.9 | 4,1Note E: Use with caution | |
|
E use with caution Source: Canadian Health Measures Survey, Cycle 3 (2012 and 2013) and Cycle 4 (2014 and 2015). |
|||
Blood pressure and body composition
Height and weight were measured for all CHMS respondents. Children and youth who were classified as being overweight (99/62 mmHg) or obese (102/64 mmHg) had a significantly higher average blood pressure than normal weight children (95/61 mmHg). Average systolic blood pressure was significantly higher in overweight and obese children compared with those in the normal weight category (Chart 2). As well, overweight and obese children had significantly higher average diastolic blood pressure when compared with their normal weight counterparts (Chart 3).Note 2Note 3Note 4Note 5
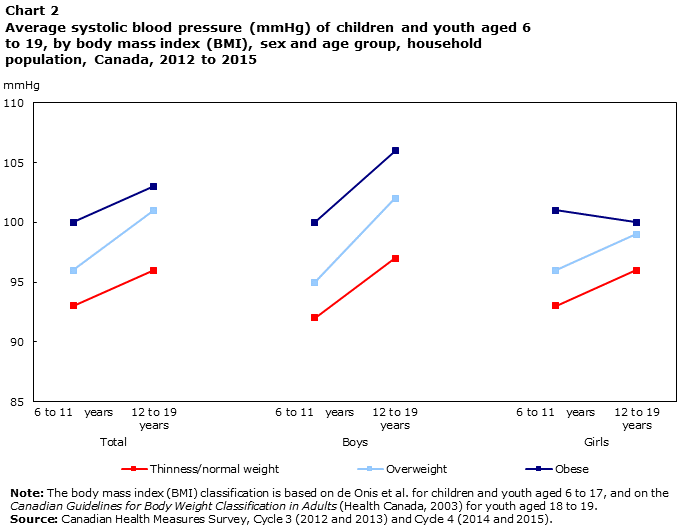
Data table for Chart 2
| Thinness/normal weight | Overweight | Obese | ||
|---|---|---|---|---|
| mmHg | ||||
| Total | 6 to 11 years | 93 | 96 | 100 |
| 12 to 19 years | 96 | 101 | 103 | |
| Boys | 6 to 11 years | 92 | 95 | 100 |
| 12 to 19 years | 97 | 102 | 106 | |
| Girls | 6 to 11 years | 93 | 96 | 101 |
| 12 to 19 years | 96 | 99 | 100 | |
|
Note: The body mass index (BMI) classification is based on de Onis et al. for children and youth aged 6 to 17, and on the Canadian guidelines for body weight classification in adults (Health Canada, 2003) for youth aged 18 to 19. Source: Canadian Health Measures Survey, Cycle 3 (2012 and 2013) and Cycle 4 (2014 and 2015). |
||||
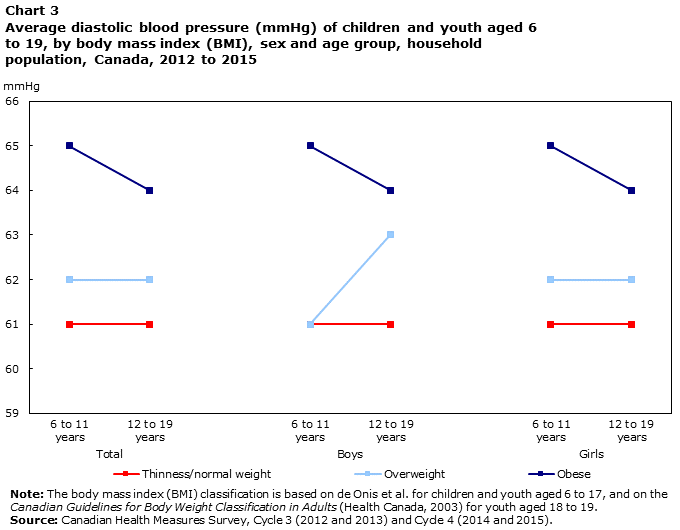
Data table for Chart 3
| Thinness/normal weight | Overweight | Obese | ||
|---|---|---|---|---|
| mmHg | ||||
| Total | 6 to 11 years | 61 | 62 | 65 |
| 12 to 19 years | 61 | 62 | 64 | |
| Boys | 6 to 11 years | 61 | 61 | 65 |
| 12 to 19 years | 61 | 63 | 64 | |
| Girls | 6 to 11 years | 61 | 62 | 65 |
| 12 to 19 years | 61 | 62 | 64 | |
|
Note: The body mass index (BMI) classification is based on de Onis et al. for children and youth aged 6 to 17, and on the Canadian guidelines for body weight classification in adults (Health Canada, 2003) for youth aged 18 to 19. Source: Canadian Health Measures Survey, Cycle 3 (2012 and 2013) and Cycle 4 (2014 and 2015). |
||||
Start of text box
About blood pressure
Blood pressure is a measure of the force of blood against the artery walls, and is expressed as systolic pressure/diastolic pressure in millimetres of mercury (e.g., 120/80 mmHg). The systolic pressure (top number) is the pressure when the heart contracts and pushes the blood out, and the diastolic pressure (bottom number) is the lowest pressure when the heart relaxes between beats.
Resting blood pressure was measured in the CHMS using an automated device (BPTru™) following a five-minute rest period. The BPTru™ recorded six measurements, one minute apart. The average systolic and diastolic blood pressure were calculated using the last five out of six measurements.
The criteria for blood pressure classification in children and adults are as follows:
| Category | Description | |
|---|---|---|
| Ages 6 to 17Note 2 | Ages 18 and 19Note 3 | |
| Normal | SBP and DBP < 90th percentile | Mean SBP/DBP < 120/80 mmHg |
| Borderline | SBP or DBP ≥ to the 90th percentile, but < the 95th percentile OR Measured mean SBP/DBP > 120/80 mmHg |
Mean SBP of 120-139 mmHg and mean DBP of 80-89 mmHg OR Mean SBP of 120-139 mmHg and mean DBP < 80 mmHg OR Mean SBP < 120 mmHg and mean DBP of 80-89 mmHg |
| Elevated | SBP or DBP ≥ 95th percentile OR Respondent reported using blood pressure medication within the past month |
Mean SBP/DBP of ≥ 140/90 mmHg OR Respondent reported using blood pressure medication within the past month |
|
SBP systolic blood pressure DBP diastolic blood pressure |
||
Data
Canadian Health Measures Survey data related to this fact sheet are available in CANSIM tables 117-0004, 117-0008 and 117-0009.
For more information on the Canadian Health Measures Survey, please contact Statistics Canada's Statistical Information Service (toll-free 1-800-263-1136; 514-283-8300; STATCAN.infostats-infostats.STATCAN@canada.ca).
- Date modified: