
Health Fact Sheets
Trends in mortality rates, 2000 to 2012

Archived Content
Information identified as archived is provided for reference, research or recordkeeping purposes. It is not subject to the Government of Canada Web Standards and has not been altered or updated since it was archived. Please "contact us" to request a format other than those available.

Start of text box
The age-standardized mortality rates show the number of deaths per 100,000 population that would have occurred in a given area if the age structure of the population of that area was the same as the age structure of a specified standard population. The mortality rates are calculated to eliminate the impact of population structure changes on death rates. Thus, the comparisons of these mortality rates reflect the actual changes in mortality.
End of text box
For the period 2000 to 2012, the age-standardized mortality rate for all causes combined declined 20.4%, from 615.5 deaths per 100,000 population to 490.0 (Chart 1).
Age-standardized mortality rates for all causes of death declined for males by 23.2% (from 778.3 to 597.6) from 2000 to 2012, while rates for females declined by 18.0% (from 493.2 to 404.6).
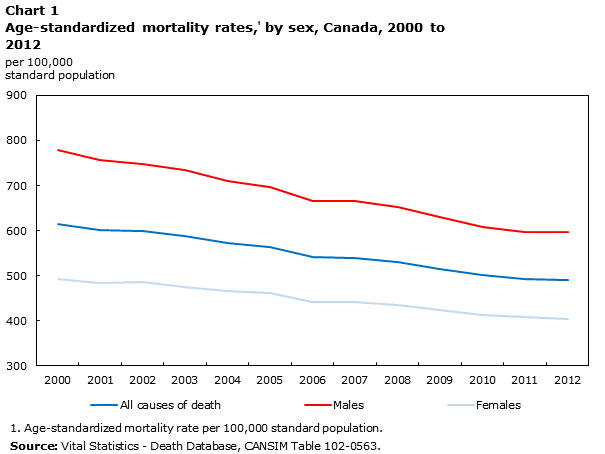
Description for Chart 1
The title of the graph is "Chart 1 Age-standardized mortality rates,Note 1 by sex, Canada, 2000 to 2012 ."
This is a line chart.
There are in total 13 categories in the horizontal axis. The vertical axis starts at 300 and ends at 900 with ticks every 100 points.
There are 3 series in this graph.
The vertical axis is "per 100,000 standard population."
The units of the horizontal axis are years from 2000 to 2012.
The title of series 1 is "All causes of death."
The minimum value is 490 occurring in 2012.
The maximum value is 615.5 occurring in 2000.
The title of series 2 is "Males."
The minimum value is 596 occurring in 2011.
The maximum value is 778.3 occurring in 2000.
The title of series 3 is "Females."
The minimum value is 404.6 occurring in 2012.
The maximum value is 493.2 occurring in 2000.
| All causes of death | Males | Females | |
|---|---|---|---|
| 2000 | 615.5 | 778.3 | 493.2 |
| 2001 | 600.8 | 756.4 | 483.3 |
| 2002 | 598.2 | 747.8 | 485.7 |
| 2003 | 586.9 | 733.5 | 475.4 |
| 2004 | 571.9 | 710.0 | 465.6 |
| 2005 | 563.7 | 696.8 | 460.7 |
| 2006 | 540.5 | 666.4 | 442.4 |
| 2007 | 539.8 | 664.8 | 441.3 |
| 2008 | 531.3 | 652.6 | 436.0 |
| 2009 | 515.0 | 629.9 | 423.5 |
| 2010 | 501.0 | 608.9 | 413.7 |
| 2011 | 492.2 | 596.0 | 407.4 |
| 2012 | 490.0 | 597.6 | 404.6 |
Age-standardized mortality rates for all 10 leading causes of death declined
Over the period 2000 to 2012, standardized mortality rates declined for all 10 leading causes of death. The standardized rates for stroke (cerebrovascular disease) and heart disease showed the largest decrease, a 42.4% decline (42.2 to 24.3) and a 39.7% decline (152.0 to 91.6) respectively. The mortality rate for accidents (unintentional injuries) had the smallest decrease at 1.9% (25.8 to 25.3). Cancer, the first leading cause of death, saw its rate go down by 14.6%, from 180.4 per 100,000 standard population in 2000 to 154.1 in 2012 (Chart 2).
From 2000 to 2012, the decline in the age-standardized mortality rate for cancer was more pronounced for males (18.4%), from 225.3 to 183.8, compared with the decline for females (11.1%), from 149.4 to 132.8. Meanwhile, the standardized rates for heart disease dropped 39.9% for males (202.9 to 122.0) and 40.6% for females (113.4 to 67.4).

Description for Chart 2
The title of the graph is "Chart 2 Age-standardized mortality ratesNote 1 for the 10 leading causes of death, Canada, 2000 and 2012."
This is a bar clustered chart.
This is a horizontal bar graph, so categories are on the vertical axis and values on the horizontal axis.
There are in total 10 categories in the vertical axis. The horizontal axis starts at 0 and ends at 200 with ticks every 20 points.
There are 2 series in this graph.
The horizontal axis is "mortality rates per 100,000 standard population."
The vertical axis is "Causes of death."
The title of series 1 is "2000."
The minimum value is 8.6 and it corresponds to "Nephritis, nephrotic syndrome and nephrosis (kidney disease)."
The maximum value is 180.4 and it corresponds to "Malignant neoplasms (cancer)."
The title of series 2 is "2012."
The minimum value is 6.1 and it corresponds to "Nephritis, nephrotic syndrome and nephrosis (kidney disease)."
The maximum value is 154.1 and it corresponds to "Malignant neoplasms (cancer)."
| 2000 | 2012 | |
|---|---|---|
| Malignant neoplasms (cancer) | 180.4 | 154.1 |
| Diseases of heart (heart disease) | 152.0 | 91.6 |
| Cerebrovascular diseases (stroke) | 42.2 | 24.3 |
| Accidents (unintentional injuries) | 25.8 | 25.3 |
| Chronic lower respiratory diseases | 27.2 | 21.6 |
| Diabetes mellitus (diabetes) | 18.9 | 13.9 |
| Alzheimer's disease | 13.2 | 10.7 |
| Influenza and pneumonia | 13.2 | 10.1 |
| Intentional self-harm (suicide) | 11.4 | 10.4 |
| Nephritis, nephrotic syndrome and nephrosis (kidney disease) | 8.6 | 6.1 |
Trends of age-standardized mortality rates varied in provinces and territories
From 2000 to 2012, Ontario and British Columbia had age-standardized mortality rates lower than the Canada-level rate. By 2012, there were 469.1 deaths per 100,000 standard population in Ontario and 461.3 per 100,000 standard population in British Columbia compared with 490.0 deaths per 100,000 standard population for Canada. The rates for Quebec and Alberta have fluctuated around the national level while the other provinces and the three territories had higher mortality rates than the national average (Chart 3).

Description for Chart 3
The title of the graph is "Chart 3 Age-standardized mortality ratesNote 1 for all causes of death, Canada, provinces and territories, 2000 and 2012."
This is a bar clustered chart.
This is a horizontal bar graph, so categories are on the vertical axis and values on the horizontal axis.
There are in total 14 categories in the vertical axis. The horizontal axis starts at 0 and ends at 1,200 with ticks every 200 points.
There are 2 series in this graph.
The horizontal axis is "mortality rates per 100,000 standard population."
The vertical axis is "Place of residence."
The title of series 1 is "2000."
The minimum value is 556 and it corresponds to "British Columbia."
The maximum value is 1,158.8 and it corresponds to "Nunavut."
The title of series 2 is "2012."
The minimum value is 461.3 and it corresponds to "British Columbia."
The maximum value is 972.8 and it corresponds to "Nunavut."
| 2000 | 2012 | |
|---|---|---|
| British Columbia | 556.0 | 461.3 |
| Ontario | 610.6 | 469.1 |
| Canada | 615.5 | 490.0 |
| Quebec | 626.3 | 490.9 |
| Alberta | 602.9 | 504.2 |
| New Brunswick | 656.6 | 532.7 |
| Prince Edward Island | 701.3 | 544.9 |
| Nova Scotia | 664.9 | 551.9 |
| Manitoba | 670.0 | 560.4 |
| Saskatchewan | 633.8 | 560.0 |
| Newfoundland and Labrador | 746.6 | 602.4 |
| Northwest Territories | 821.1 | 704.4 |
| Yukon | 820.8 | 636.7 |
| Nunavut | 1,158.80 | 972.8 |
While cancer has been the first leading cause of death in Canada since 2000, only from 2008 did it become the first leading cause in all provinces and territories. In the provinces, the age-standardized mortality rates for the top three leading causes of death (cancer, heart disease and stroke) decreased over the period of observation, with heart disease and stroke decreasing at a more rapid pace than cancer.
A decrease was also observed in the mortality rate for chronic lower respiratory diseases in all provinces and territories from 2011 to 2012.
In general, the age-standardized mortality rate for accidents (unintentional injuries) has increased from 2000 to 2012 in Nova Scotia (24.1 to 33.6), New Brunswick (28.7 to 29.1), Ontario (22.3 to 25.3), Manitoba (33.3 to 36.0) and Saskatchewan (36.5 to 39.9). British Columbia started the upward trend in 2006 from 23.4 to 26.9 in 2012. In the other provinces and territories, the mortality rate for accidents has dropped over time.
Data
Additional data on leading causes of death CANSIM are available from CANSIM tables 102-0561, 102-0562 and 102-0563.
- Date modified: