Household food insecurity, 2007–2008
Archived Content
Information identified as archived is provided for reference, research or recordkeeping purposes. It is not subject to the Government of Canada Web Standards and has not been altered or updated since it was archived. Please "contact us" to request a format other than those available.

Canadian Community Health Survey
Food security is commonly understood to exist in a household when all people, at all times, have access to sufficient, safe and nutritious food for an active and healthy life.1 Conversely, food insecurity occurs when food quality and/or quantity are compromised, typically associated with limited financial resources.2
Recognized as an important public health issue in Canada, household food insecurity has been associated with a range of poor physical and mental health outcomes, for example, self-assessed poor/fair health, multiple chronic conditions, obesity, distress, and depression.3,4,5,6,7.
In 2007-2008, the Canadian Community Health Survey (CCHS) collected national data on household food insecurity, specifically focusing on the financial ability of households to access adequate food. The food insecurity questions resulted in an overall household measure of food insecurity, as well as separate adult and child measures.
'Moderate' food insecurity means that there was an indication that quality and/or quantity of food consumed was compromised. 'Severe' food insecurity means that there was an indication of reduced food intake and disrupted eating patterns.
In 2007-2008, 7.7% of households, or almost 956,000 households, experienced food insecurity. About 5.1% experienced moderate food insecurity, and 2.7% experienced the severe level.
Lone parent households had highest rates of food insecurity
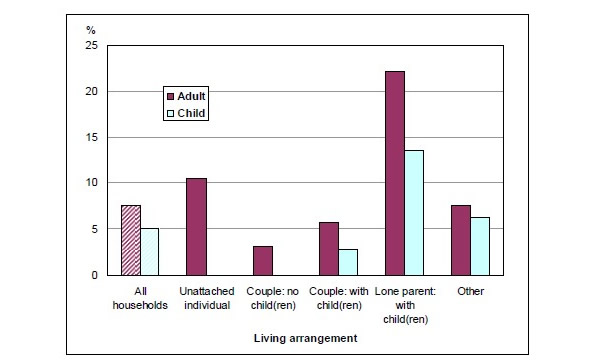
Lone parent households had the highest incidence of food insecurity, for both adult and child measures, and couples without children had the lowest rate (see Chart 1). To add some perspective, lone parents with children made up the smallest group, at 5.3% of all households, but they accounted for 16.0% of all food insecure households. Unattached individuals was the largest group, at 28.1% of all households, and also made up the largest share of food insecure households, at 38.3%.
Chart 1
Percentage of households with food insecurity, by living arrangement, and adult and child measures, Canada 2007–2008.
Source: Canadian Community Health Survey, 2007–2008.
Note: Here, children are defined as less than 18 years old.
Adults protected children from food insecurity
For all living arrangements with children, the child food insecurity rate was lower than the adult rate. Also, in food insecure households with children, the adult food insecurity level was higher than the child level in 65% of households, with the reverse true in only 5% of cases. So it appears that in the majority of food insecure households, adults were protecting children from food insecurity to some degree, which has been observed in previous research8.
Households with children had highest rates of food insecurity
Child food insecurity rates were similar between households with younger versus older children (between 4.9% and 5.2%), whereas adult rates showed differences, with a low of 6.8% in households with no children, to a high of 10.3% when there were children under 6. This variability in adult food insecurity rates, while child rates were lower and similar across age groups, is consistent with the above suggestion that adults were protecting the food security of children, especially young children.
Younger people and women more likely to live in households with food insecurity
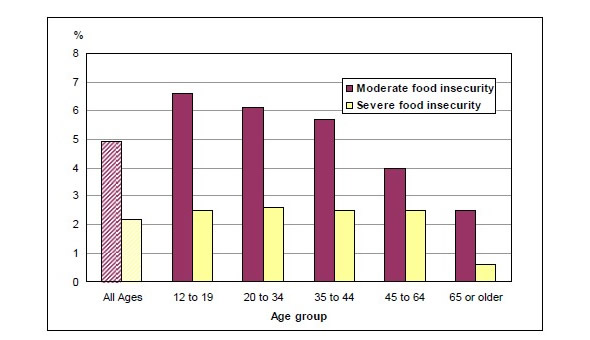
In all age groups (see Chart 2), the percentage of people living in households with moderate food insecurity was higher than that for severe food insecurity.
Across age groups, the prevalence of severe food insecurity was stable (2.5% to 2.6%) except for the 65 or older group, which was lower at 0.6%. The level of moderate food insecurity showed no differences between age groups from 12 to 44 years of age (a peak of 6.6% of individuals for 12 to 19), then decreased with age to a low of 2.5% in the 65 or older group. Note that this does not mean that the individuals in their teens necessarily experienced food insecurity themselves, but that they were more likely to live in a household where one or more household members did.
Chart 2
Percentage of individuals living in households with moderate or severe household food insecurity, by age group, household population aged 12 and older, Canada 2007–2008.
Source: Canadian Community Health Survey, 2007–2008.
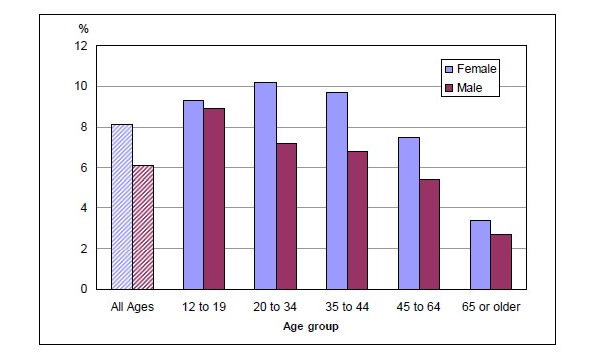
Males (6.1%) were less likely than females (8.1%) to live in households with food insecurity (see Chart 3). This pattern existed in all age groups except for 12 to 19 where there was no difference between the sexes.
Chart 3
Percentage of individuals living in households with food insecurity, by age group and sex, household population aged 12 and older, Canada 2007–2008.
Source: Canadian Community Health Survey, 2007–2008.
Four provinces at or below national average for food insecurity
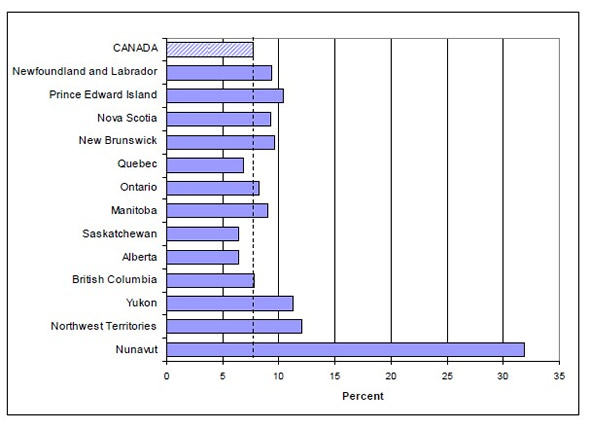
Rates of food insecurity in Quebec, Saskatchewan, and Alberta were below the national average, with all other provinces/territories being above, except for British Columbia which did not differ from the national average. Nunavut showed the highest rate of food insecurity, at 31.9% of households (see Chart 4).
Chart 4
Percentage of households with food insecurity, by province/territory, Canada, 2007–2008.
Source: Canadian Community Health Survey, 2007–2008.
Notes:
1. Food and Agriculture Organization of the United Nations. Rome Declaration on World Food Security and World Food Summit Plan of Action, Rome, Italy: FAO, 1996. Available at: FAO.
2. Tarasuk V. Health implications of food insecurity. In Social Determinants of Health: Canadian Perspectives, 2nd ed. Raphael, D., Ed.; Canadian Scholars' Press Inc.: Toronto, 2009; Chapter 14.
3. Ledrou I, Gervais J. Food insecurity. Health Reports 2005; 16(3):47-51. (Statistics Canada catalogue 82-003).
4. Kirkpatrick SI, Tarasuk V. Food insecurity is associated with nutrient inadequacies among Canadian adults and adolescents. Journal of Nutrition 2008:138: 604–612.
5. McIntyre L, Connor SK, Warren J. Child hunger in Canada: results of the 1994 National Longitudinal Survey of Children and Youth. Canadian Medical Association Journal 2000; 163(8):961-965.
6. Che J, Chen J. Food insecurity in Canadian households. Health Reports 2001; 12(4):11-22. (Statistics Canada, Catalogue 82-003).
7. Vozoris N, Tarasuk V. Household food insufficiency is associated with poorer health. Journal of Nutrition 2003; 133:120-126.
8. For example: McIntyre L, Glanville T, Raine KD, Anderson B, Battaglia N. Do low-income lone mothers compromise their nutrition to feed their children? Canadian Medical Association Journal 2003; 168(6):686-691.
References:
Health Canada. Canadian Community Health Survey cycle 2.2, nutrition (2004) -- Income-related household food security in Canada. 2007.
Ledrou I, Gervais J. Food insecurity. Health Reports 2005; 16(3):47-51. (Statistics Canada catalogue 82-003).
Che J, Chen J. Food insecurity in Canadian households. Health Reports 2001; 12(4):11-22. (Statistics Canada, Catalogue 82-003).
Data tables:
CANSIM tables 105-0545, 105-0546, 105-0547.
- Date modified:
