Oral health: Edentulous people in Canada 2007 to 2009
Archived Content
Information identified as archived is provided for reference, research or recordkeeping purposes. It is not subject to the Government of Canada Web Standards and has not been altered or updated since it was archived. Please "contact us" to request a format other than those available.

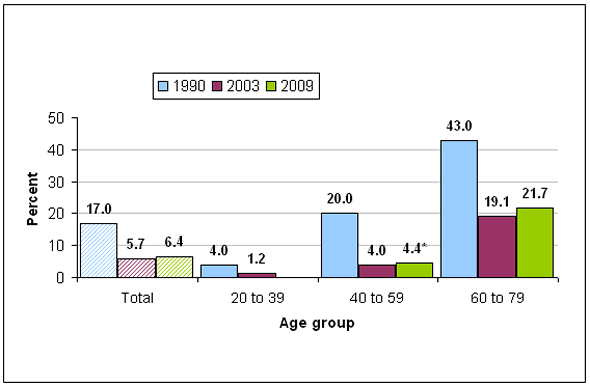
In 2007 to 2009, among Canadian adults aged 20 to 79, 93.6% had some natural teeth and 6.4% were edentulous; that is, they had no teeth of their own when examined by a dentist. This reflects no significant change from reported rates in 2003, but is a significant decline from 1990 where 17% of the population reported they had no teeth of their own.
The loss of all natural teeth can lead to changes in eating patterns, nutrient deficiency and involuntary weight loss as well as speech difficulty if left uncorrected.
Complete loss of natural teeth is found mostly in adults aged 40 and older. Less than 1% of the population aged 20 to 39 had lost all their teeth. Among people aged 40 to 59, 4.3% of men and 4.4% women had no natural teeth.
The rate rises steeply for people aged 60 to 79, with 22.3% of men and 21.1% of women having no natural teeth.
The long-term decline in the edentulous population parallels widespread use of fluorides in Canada and improved access to dental care over the past decades.
Chart 1
Percentage of household population who have no natural teeth, by age group

*Note: Use with caution (data with a coefficient of variation from 16.6% to 33.3%)
Sources: 1990 Health Promotion Survey; 2003 Canadian Community Health Survey; 2009 Canadian Health Measures Survey, 2007 to 2009.
International comparison of edentulous populations
Other countries monitoring oral health through physical measures surveys also report declines in their edentulous population. Because estimates of the edentulous population are strongly related to the age groupings of the total population surveyed (the condition exists rarely in younger people and is more pronounced in older age groups who represent the cumulative loss of teeth over their generation's lifespan), some comparisons below put Canadian results in context of other dental examination surveys for selected age groups.
Table 1
Percentage of populations with no natural teeth, selected countries
Standard table symbols
| Country | Age group | |||
|---|---|---|---|---|
| 30 to 44 | 45 to 54 | 55 to 64 | 65 to 74 | |
| Canada | F | 4.0E | 12.5E | 24.6 |
| United States | 1.3 | 4.9 | 12.6 | 22.3 |
| Finland | <1 | 6 | 16 | 36 |
| United Kingdom | <1 | 6 | 20 | 36 |
|
E use with caution (data with a coefficient of variation from 16.6% to 33.3%) F too unreliable to be published (data with a coefficient of variation greater than 33.3%) Sources: Canadian Health Measures Survey 2007 to 2009; USA: National Health and Nutrition Examination Survey (2003-2004); Finland: Health 2000*; United Kingdom: 1998 Adult Dental Health Survey. * The full reference for the estimates from Finland is as follows: Suominen-Taipale L, Nordblad A, Vehkalahti M. Edentulousness and number of teeth, pages. 39-43. In: Suominen-Taipale L, Nordblad A, Vehkalahti M, Aromaa A, eds. Oral Health in the Finnish Adult Population. Health 2000 Survey. Publications of the National Public institute B 25/2008. Hakapaino Oy, Helsinki 2008. Oral Health in Finland |
||||
About the Oral Health Measures in the CHMS
Health Canada sponsored the oral health measures in the Canadian Health Measures Survey to get the first national picture of Canadians' oral health in over 30 years. The clinic portion of the CHMS included a 15 minute oral health examination by a qualified dentist. The dentist used an explorer and mirror to check the condition of the teeth, gums and tongue of every consenting CHMS participant. Detailed information about each tooth was recorded. Prior to leaving the clinic, CHMS participants received the results of their oral examination.
The Department of National Defense supplied six teams of two dentists each for the two-year data collection period. Health Canada implemented the training for all the dentists collecting physical measures in the CHMS, and they were all calibrated to World Health Organization (WHO) standards by a gold standard trainer (to make sure they all recorded the conditions they saw in the same manner).
The CHMS has the support of nine national health associations, including the Canadian Dental Association
Health Canada has produced the Report on the Findings of the Oral Health Component of the Canadian Health Measures Survey 2007–2009. It can be obtained by visiting the Federal, Provincial, Territorial Dental Working Group website. The Oral Health Statistics 2007-2009 fact sheet presents an overview of the results.
- Date modified:
