
Health at a Glance
Updating the standard population and its effect on cancer incidence and mortality rates

Archived Content
Information identified as archived is provided for reference, research or recordkeeping purposes. It is not subject to the Government of Canada Web Standards and has not been altered or updated since it was archived. Please "contact us" to request a format other than those available.
by Lawrence Ellison
Start of text box 1
Highlights
- In March 2016, the standard population used to derive age-standardized rates in Canada was updated to one based on the 2011 Canadian population. Previously, it was based on the 1991 Canadian population..
- Changes in age-standardized rates as a consequence of an update of the standard population used to derive them are artificial in nature and do not reflect sudden changes in the risk of developing or dying from cancer.
- For all cancers combined, Canadian age-standardized cancer incidence and mortality rates based on the 2011 standard population were consistently higher than those based on the 1991 standard.
- The magnitude of the change in age-standardized incidence rates resulting from the update of the standard population varied by cancer type.
- Updating the standard population had very little effect on trends in overall age-standardized cancer incidence and mortality rates from 1992 to 2012.
End of text box 1
Introduction
Rates of newly diagnosed cases of cancer (incidence) and deaths attributed to cancer (mortality) may be presented as either unstandardized (crude) or age-standardized rates. Crude cancer incidence rates provide a measure of the risk of being diagnosed with cancer. For example, the crude cancer incidence rate for all ages combined was 520.5 per 100,000 persons in Canada in 2012. Crude cancer mortality rates provide information on the risk of death attributable to cancer. The crude cancer mortality rate for all ages in 2012 was 214.0 per 100,000 persons.
Quite often there is interest in comparing cancer rates in a population over time, across populations from different geographic areas, or across populations defined by both time and geography. In these circumstances, the use of the crude rate for all ages combined is not recommended. This is because the chance of being diagnosed with, or dying from, cancer, varies with age, and different populations may have different age-structures.Note 1 The age-structure of the Canadian population, for example, has been changing over time as the proportion of older people has been increasing.Note 2
What is desired is a measure that permits a “fair” comparison of the risk of being diagnosed with, or dying from, cancer, across different populations. The age-standardized rate provides such a measure by providing the rate that would have been observed in each population of interest if each of these populations had the same age-structure (a common standard population). It allows us to compare apples to apples.
In March 2016, the standard population used to derive age-standardized rates in Canada was updated to one based on the 2011 Canadian population.Note 3Note 4 Previously, it had been based on the 1991 Canadian population.Note 4 As a result of this change, age-standardized cancer incidence and mortality rates for each year have also changed—often substantially. The changes in age-standardized rates that accompany the change in standard population are, however, artificial in nature, and do not imply that there has been a change in the risk of being diagnosed with, or dying from, cancer. Nonetheless, the changes are worth exploring as they may vary by province or cancer type.
This article examines differences in age-standardized cancer incidence and mortality rates resulting from a change in the standard population used to derive them. Differences are examined over time, and by province and cancer type for 2012. The data sources are the Canadian Cancer Registry (1992 to 2012), the Canadian Vital Statistics – Death database (1992 to 2012) and Canada’s population estimates by age and sex, (1992 to 2012) all from Statistics Canada.
Cancer incidence and mortality rates increase with age
For all cancers combined, incidence and mortality rates increased with ageNote 5 (Chart 1). In 2012, increases in cancer incidence rates with age were largest over the range between the 15 to 19 and 60 to 64 age groups. While the rate of increase declined in older age groups, the incidence rate itself continued to rise until it reached a peak in the 85 to 89 age group. During the same year, rates of increase in cancer mortality rates with age were largest over the range between the 25 to 29 and 55 to 59 age groups. Though the rate of increase declined thereafter, the mortality rate itself continued to rise through to the 90 and older age group.
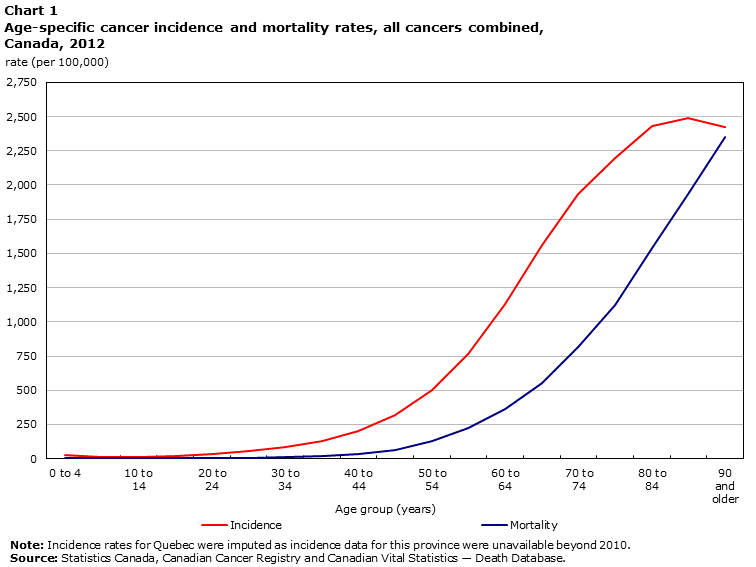
Data table for Chart 1
| Age group | Incidence | Mortality |
|---|---|---|
| 0 to 4 | 24.7 | 2.0 |
| 5 to 9 | 14.1 | 1.7 |
| 10 to 14 | 14.6 | 2.0 |
| 15 to 19 | 22.1 | 2.8 |
| 20 to 24 | 33.0 | 3.3 |
| 25 to 29 | 57.4 | 5.9 |
| 30 to 34 | 84.6 | 10.4 |
| 35 to 39 | 126.2 | 18.3 |
| 40 to 44 | 203.5 | 33.6 |
| 45 to 49 | 317.6 | 64.5 |
| 50 to 54 | 497.9 | 129.2 |
| 55 to 59 | 764.0 | 221.1 |
| 60 to 64 | 1,131.6 | 363.1 |
| 65 to 69 | 1,562.1 | 553.5 |
| 70 to 74 | 1,932.6 | 816.3 |
| 75 to 79 | 2,196.3 | 1,125.1 |
| 80 to 84 | 2,433.6 | 1,541.8 |
| 85 to 89 | 2,488.7 | 1,931.0 |
| 90 and older | 2,426.2 | 2,349.5 |
|
Notes: Incidence rates for Quebec were imputed as incidence data for this province were unavailable beyond 2010. Source : Statistics Canada, Canadian Cancer Registry and Canadian Vital Statistics-Deaths. |
||
Canadian population older in 2011 than 1991
The age-structure of the Canadian population in 2011 was older than it was in 1991 (Chart 2). For every age group from 45 to 49 onwards, the percentage of the population in a particular age group was greater in 2011 than in 1991. The absolute difference was largest among those 50 to 54. For every age group up to and including those aged 40 to 44, the percentage of the population in a particular age group was smaller in 2011. In this case the difference was largest in the 30 to 34 age group.
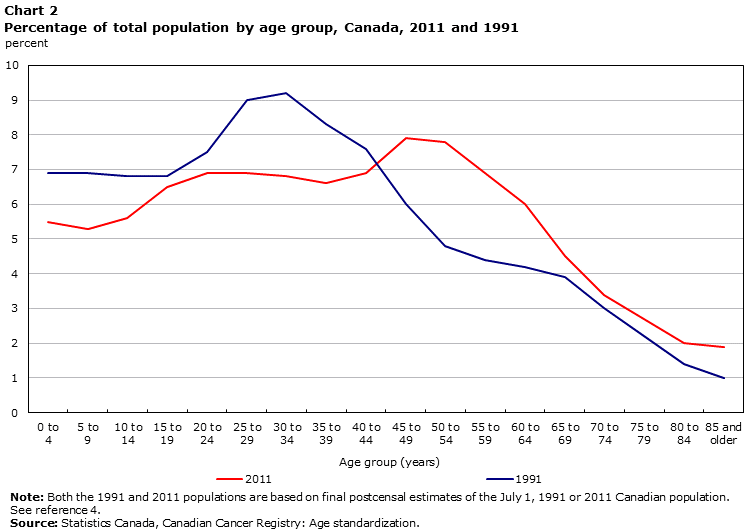
Data table for Chart 2
| Age group | 2011 | 1991 |
|---|---|---|
| 0 to 4 | 5.5 | 6.9 |
| 5 to 9 | 5.3 | 6.9 |
| 10 to 14 | 5.6 | 6.8 |
| 15 to 19 | 6.5 | 6.8 |
| 20 to 24 | 6.9 | 7.5 |
| 25 to 29 | 6.9 | 9.0 |
| 30 to 34 | 6.8 | 9.2 |
| 35 to 39 | 6.6 | 8.3 |
| 40 to 44 | 6.9 | 7.6 |
| 45 to 49 | 7.9 | 6.0 |
| 50 to 54 | 7.8 | 4.8 |
| 55 to 59 | 6.9 | 4.4 |
| 60 to 64 | 6.0 | 4.2 |
| 65 to 69 | 4.5 | 3.9 |
| 70 to 74 | 3.4 | 3.0 |
| 75 to 79 | 2.7 | 2.2 |
| 80 to 84 | 2.0 | 1.4 |
| 85 to 89 | 1.9 | 1.0 |
|
Notes: Both the 1991 and 2011 populations are based on final postcensal estimates of the July 1, 1991 or 2011 Canadian population. See reference 4. Source: Statistics Canada, Canadian Cancer Registry: Age standardization |
||
Overall age-standardized cancer incidence rates higher with new (2011) standard population
Age-standardized incidence rates based on the 2011 standard population are higher than those based on the 1991 standard (Chart 3). This does not mean that there has been a sudden increase in the risk of developing cancer. Rather, the increase is artificial in nature and is explained by a combination of two factors. First, cancer incidence rates increase with age (see Chart 1). Second, rates for age groups comprised of older people are more heavily weighted (that is, given greater emphasis) with the 2011 standard than with the 1991 standard as the age-structure of the 2011 population is older than that of 1991 (see Chart 2).Note 4 While the rates are higher, the trend in age-standardized cancer incidence rates is nearly the same whether age-standardization is performed using the 2011 or 1991 population standard.

Data table for Chart 3
| Year | ASIR – 2011 standard | Crude | ASIR – 1991 standard |
|---|---|---|---|
| 1992 | 525.9 | 410.0 | 404.4 |
| 1993 | 533.3 | 419.6 | 409.7 |
| 1994 | 527.0 | 419.0 | 405.2 |
| 1995 | 511.7 | 410.9 | 393.5 |
| 1996 | 506.1 | 410.6 | 389.1 |
| 1997 | 511.7 | 419.8 | 393.2 |
| 1998 | 517.4 | 429.5 | 397.1 |
| 1999 | 525.2 | 441.4 | 403.3 |
| 2000 | 528.1 | 448.7 | 404.8 |
| 2001 | 530.8 | 456.6 | 406.8 |
| 2002 | 524.7 | 458.3 | 403.0 |
| 2003 | 518.2 | 459.6 | 397.7 |
| 2004 | 523.4 | 471.3 | 402.2 |
| 2005 | 526.9 | 481.4 | 405.4 |
| 2006 | 527.9 | 490.0 | 406.2 |
| 2007 | 533.0 | 502.3 | 409.8 |
| 2008 | 525.5 | 502.8 | 404.4 |
| 2009 | 525.6 | 510.1 | 404.7 |
| 2010 | 520.3 | 512.5 | 401.1 |
| 2011 | 524.5 | 524.7 | 404.4 |
| 2012 | 512.2 | 520.5 | 395.3 |
|
Notes: ASIR refers to age-standardized incidence rate. ASIRs have been standardized to either the final postcensal estimates of the July 1, 2011 or 1991 Canadian population. Incidence rates for Quebec were imputed for 2011 and 2012 as incidence data for this province were unavailable beyond 2010. Source: Statistics Canada, Canadian Cancer Registry. |
|||
The solid line in Chart 3 represents the crude incidence rate due to cancer. The line indicates that the crude rate increased 26.9% from 1992 to 2012.Note 6 However, once the aging of the population that occurred during this time period is adjusted for by age-standardization, a decline in the rate of cancer incidence of 2.6% is seen.Note 7
Crude rates for the most recent data years are more similar to the corresponding age-standardized rates for those years when the newer, rather than the older, standard population is used. The reverse is true for the earliest years. This highlights the primary reason for switching to a standard population based on more recent population data. That is, to bring age-standardized rates more in line with the crude rates for the most recent data years.
Overall age-standardized cancer mortality rates higher with new (2011) standard population
Age-standardized mortality rates based on the 2011 standard population are higher than those based on the 1991 standard (Chart 4). This was observed above with the cancer incidence and the explanation is the same—cancer mortality rates increase with age (see Chart 1) and the older age groups are more heavily weighted (that is, given greater emphasis) with the 2011 standard (see Chart 2).Note 4 The trend in age-standardized cancer mortality rates is nearly the same whether age-standardization is performed using the 2011 or 1991 population standard. This is similar to what was observed above with the corresponding trend in cancer incidence.
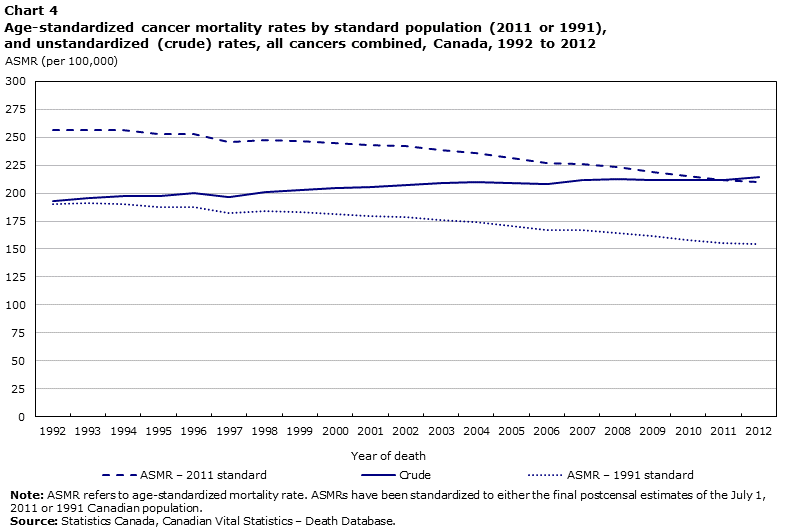
Data table for Chart 4
| Year | ASMR – 2011 standard | Crude | ASMR – 1991 standard |
|---|---|---|---|
| 1992 | 256.2 | 193.3 | 190.4 |
| 1993 | 256.2 | 195.9 | 190.7 |
| 1994 | 256.3 | 197.7 | 190.4 |
| 1995 | 252.6 | 197.3 | 187.5 |
| 1996 | 253.0 | 200.0 | 188.0 |
| 1997 | 245.3 | 196.3 | 182.0 |
| 1998 | 247.4 | 200.9 | 183.7 |
| 1999 | 246.5 | 202.8 | 182.7 |
| 2000 | 244.9 | 204.2 | 181.2 |
| 2001 | 243.2 | 205.6 | 179.8 |
| 2002 | 242.0 | 207.6 | 178.7 |
| 2003 | 238.8 | 208.6 | 176.2 |
| 2004 | 236.0 | 209.6 | 174.3 |
| 2005 | 231.4 | 208.9 | 170.8 |
| 2006 | 226.5 | 208.2 | 166.9 |
| 2007 | 226.3 | 211.6 | 166.7 |
| 2008 | 223.2 | 212.2 | 164.4 |
| 2009 | 218.9 | 211.5 | 161.2 |
| 2010 | 215.2 | 211.4 | 158.2 |
| 2011 | 211.8 | 211.8 | 155.7 |
| 2012 | 210.0 | 214.0 | 154.2 |
|
Notes: ASMR refers to age-standardized mortality rate. ASMRs have been standardized to either the final postcensal estimates of the July 1, 2011 or 1991 Canadian population. Source: Statistics Canada, Canadian Vital Statistics – Death Database. |
|||
The solid line in Chart 4 represents the crude mortality rate due to cancer. The line indicates that the crude rate increased 10.7% from 1992 to 2012.Note 8 However, once the aging of the population that occurred during this time period is adjusted for by age-standardization, the data indicate that there has actually been a decline in the rate of cancer mortality of 19.0%.Note 7
Once again, the crude rates for more recent data years more closely resemble the corresponding age-standardized rates for those years when the newer standard population is used. In fact, the crude and age-standardized cancer mortality rates are identical for 2011.
Start of text box 2
Age-standardization in practice
Ideally, comparisons of age-related events across populations, including cancer incidence and mortality rates, would be done on an age-specific basis. That is, crude rates would be calculated for a given set of age groups for each population of interest and the results compared on an age group by age group basis. Instead, the age-standardized rate is very often used in these circumstances because the number of age groups may approach 20 and that many age-specific comparisons is often considered to be too cumbersome.
While the age-standardized rate can provide a useful summary measure with which comparisons can more easily be made, there are times when its use is not recommended. These occur when the nature of the effect (for example, the ratio of the age-specific rates) between populations is not similar across age groups. For example, suppose that incidence rates have increased over time in younger age groups and decreased over the same time in older age groups for a given cancer. An analysis of age-standardized rates based on a standard population more heavily weighted on older age groupsNote 9 would likely indicate a decreasing trend. At the same time, an analysis based on a standard population more heavily weighted to younger age groups would likely indicate an increasing trend. In circumstances such as these, a summary measure can be significantly impacted by the choice of standard population. Additionally, its use may hide important age-specific results.
In situations where age-standardization is appropriate, a formal change in the standard population used may still lead to very minor differences in results. Such differences are expected and are accepted provided that the decision to change the standard population is made before the analysis. They occur because while the nature of the effect between populations of interest may be roughly the same across age group, it is virtually never identical.
It is not generally advisable to compare age-standardized rates derived using the 2011 standard population with previously published estimates based on the 1991 standard.Note 10
End of text box 2
Changes in age-standardized rates greater for mortality than incidence
For all cancers combined, updating the standard population to one based on 2011 rather than 1991 data resulted in the 2012 Canadian age-standardized incidence rate changing from 395.3 to 512.2 per 100,000, a 29.6% increase (Chart 5). Provincially, increases ranged from 28.5% for Prince Edward Island to 31.1% for Quebec.Note 11 As the changes are not the same across the provinces, comparisons of provincial age-standardized rates for all cancers combined may, in theory, be affected by the change in the standard population used. In practice, however, any discrepancies are very slight and not meaningful. (See text box entitled “Age-standardization in practice”).
Updating the standard population also resulted in a 36.2% change in the age-standardized mortality rate, from 154.2 to 210.0 per 100,000, in 2012. Increases were largest for British Columbia (36.4%), Ontario (36.4%) and Quebec (36.3%), and smallest for Prince Edward Island (33.0%).
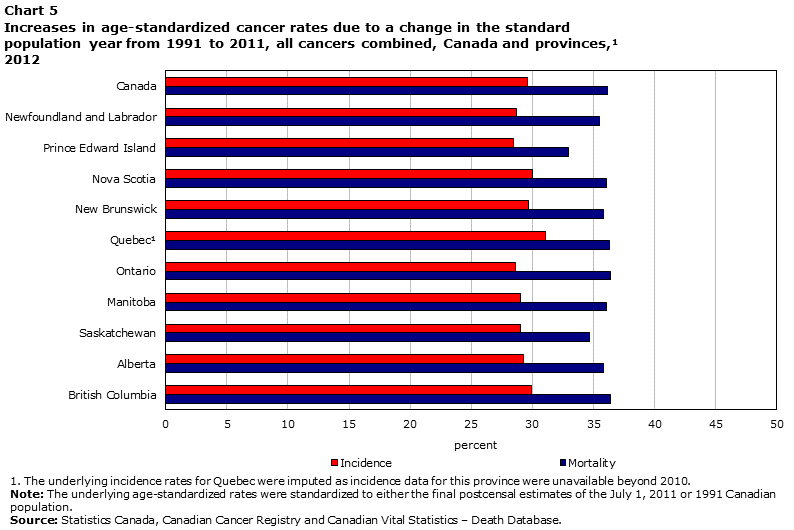
Data table for Chart 5
| Province | Mortality | Incidence |
|---|---|---|
| British Columbia | 36.4 | 29.9 |
| Alberta | 35.8 | 29.3 |
| Saskatchewan | 34.7 | 29.0 |
| Manitoba | 36.1 | 29.0 |
| Ontario | 36.4 | 28.6 |
| QuebecIncreases in Note 1 | 36.3 | 31.1 |
| New Brunswick | 35.8 | 29.7 |
| Nova Scotia | 36.1 | 30.0 |
| Prince Edward Island | 33.0 | 28.5 |
| Newfoundland and Labrador | 35.5 | 28.7 |
| Canada | 36.2 | 29.6 |
Source: Statistics Canada, Canadian Cancer Registry and Canadian Vital Statistics – Death Database. |
||
Increases in age-standardized cancer rates for 2012 that resulted from the update in the standard population used were greater for mortality than for incidence for every province. The magnitude of the difference was highest in Ontario (7.7 percentage points) and lowest in Quebec (5.3). The consistently larger increases for mortality may be explained by the greater proportion of cancer deaths, relative to the proportion of newly diagnosed cases, in older ages (see Chart 1).
Impact of updating standard population varies by cancer type
The impact of updating the standard population from 1991 to 2011 on age-standardized incidence rates varied considerably by cancer type (Table 1). For over two-thirds of the cancer types examined, age-standardized incidence rates were at least 28% higher using the 2011 standard. The cancers associated with the largest increases were esophageal (34.3%), pancreatic (33.8%), bladder (33.6%) and multiple myeloma (33.6%).Note 12 In contrast, the updated age-standardized rate for testicular cancer was 11.5% lower while for Hodgkin lymphoma it was virtually unchanged. Increases were also relatively low for cervical cancer (7.4%), thyroid cancer (12.0%), and cancers of the brain and other nervous system (16.9%).
| Cancer type | Standard population year | % change | Median age | |
|---|---|---|---|---|
| 1991 | 2011 | |||
| ASIR (per 100,000) | ||||
| Esophagus | 4.1 | 5.5 | 34.3% | 68 |
| Pancreas | 9.7 | 13.0 | 33.8% | 71 |
| Bladder | 16.3 | 21.8 | 33.6% | 72 |
| Multiple myeloma | 5.1 | 6.9 | 33.6% | 72 |
| Colorectal | 47.5 | 63.0 | 32.8% | 70 |
| Corpus uteri and not otherwise specified | 12.3 | 16.3 | 32.8% | 63 |
| Stomach | 6.8 | 9.0 | 32.8% | 71 |
| Prostate | 45.2 | 60.0 | 32.7% | 67 |
| Lung and bronchus | 54.0 | 71.5 | 32.5% | 70 |
| Liver | 4.4 | 5.8 | 32.4% | 67 |
| Larynx | 2.3 | 3.0 | 31.9% | 67 |
| Oral cavity and pharynx | 8.9 | 11.7 | 31.3% | 64 |
| Kidney and renal pelvis | 12.3 | 16.0 | 30.2% | 65 |
| Ovary | 5.6 | 7.3 | 29.5% | 63 |
| Breast | 51.8 | 67.0 | 29.4% | 62 |
| Non-Hodgkin lymphoma | 15.9 | 20.4 | 28.3% | 67 |
| Skin melanoma | 13.6 | 17.1 | 25.4% | 63 |
| Leukemias | 11.6 | 14.5 | 24.8% | 68 |
| Brain and other nervous system | 6.7 | 7.8 | 16.9% | 61 |
| Thyroid | 16.0 | 18.0 | 12.0% | 51 |
| Cervix uteri | 3.6 | 3.9 | 7.4% | 48 |
| Hodgkin lymphoma | 2.6 | 2.6 | -0.2% | 38 |
| Testis | 3.1 | 2.8 | -11.5% | 33 |
| Note: ASIR refers to the age-standardized incidence rate. ASIRs were standardized to either the final post censal estimates of the July 1, 2011 or 1991 Canadian population. Incidence rates for Quebec were imputed as incidence data for this province were unavailable beyond 2010. Median age at diagnosis was based on cases diagnosed in 2012, except for Quebec (2010). Source: Statistics Canada, Canadian Cancer Registry. |
||||
The magnitude of the change in cancer-specific age-standardized incidence rates resulting from the use of the updated population standard was associated with the median age at diagnosis. Specifically, larger increases tended to be associated with cancers with a relatively high median age at diagnosis while smaller increases and declines were associated with cancers having a lower median age. These results are as one might expect given the greater weighting of older age groups in the updated standard.Note 9
Conclusion
Age-standardization allows for comparisons of incidence or mortality rates over time that take into consideration changes in the age distribution of the population. The standard population used to age-standardize cancer incidence and cancer mortality rates has recently been updated to one based on the 2011, rather than 1991, Canadian population age structure. As a direct result, age-standardized cancer rates are now higher for each year of reported data for all cancers combined and for most, but not all, individual cancers. By definition, crude rates are unaffected.
While differences in the magnitude of the change are interesting to examine by province or by cancer type, it is stressed that the changes are artificial in nature and do not represent a change in the risk of developing or dying from cancer as such. The main advantage of the update to the standard population is that age-standardized rates for recent years now more closely reflect actual (crude) rates. While age-standardized rates are a hypothetical construct, they are sometimes mistakenly interpreted as reflecting actual risk. Use of the updated standard will lessen the extent of any such misinterpretation for recent years.
Start of text box 3
Data sources, methods and definitions
Data sources
The Canadian Cancer Registry is a dynamic, person-oriented, population-based database maintained by Statistics Canada. It contains information on cancer cases diagnosed from 1992 onward, compiled from reports from every provincial and territorial cancer registry in Canada. Cancer incidence data in this report are from the August 2015 tabulation master file released in March 2016. The analysis file was created using the multiple primary coding rules of the International Agency for Research on Cancer.Note 13 Cases were defined based on the International Classification of Diseases for Oncology, Third Edition.Note 14
The Canadian Vital Statistics – Death Database includes demographic and cause of death information for all deaths from all provincial and territorial vital statistics registries in Canada. Prior to 2010, some data were collected on Canadian residents who died in some American states; these deaths were excluded from this analysis. Starting with the 2010 reference year, data on Canadian residents who died in American states are no longer collected. Mortality data in this report are from the December 10, 2015, release.
Incidence and mortality rates were derived using Canada’s population estimates by age and sex.Note 2
Methods
Classification of cases and deaths
Cancer cases were classified into cancer types as per the groupings used in the annual Canadian Cancer Statistics publication.Note 15 With the exception of in situ bladder cancer, only malignant cases were considered.
Deaths were classified using the World Health Organization’s International Statistical Classification of Diseases and Related Health Problems—10th Revision (ICD-10)Note 16 for deaths from the year 2000 onward, and the 9th Revision (ICD-9)Note 17 for deaths from previous years.
Incomplete data
Incidence data for Quebec were not available beyond 2010. Age-specific, and all age groups combined incidence rates for all cancers combined for Quebec for 2011 and 2012 were imputed from fitted trend results derived from Quebec data from 2001 to 2010. Corresponding rates for Canada were calculated as a weighted average of rates for Quebec, and Canada excluding Quebec, by population. Cancer-specific age-standardized incidence rates for Canada for 2012 were also imputed as a weighted average by population of results for Canada excluding Quebec and for imputed results from Quebec. In this case, cancer-specific age-standardized incidence rates for Quebec for 2012 were imputed from age-standardized fitted trend results derived from Quebec data from 2001 to 2010. All trend analyses were performed using the Joinpoint Regression Program of the Surveillance, Epidemiology, and End Results (SEER) Program.Note 18Note 19
Death certificate only casesNote 20 were not available beyond the 2007 data year in Ontario and the 2009 data year in Quebec. Death certificate only cases for 2008 to 2012 in Ontario, and for 2010 in Quebec, were randomly imputed from the distribution of such cases by province, cancer type, age group and sex from the last five years for which data were available in each province.
Definitions
The age-standardized incidence or mortality rate represents the number of new cancer cases or deaths per 100,000 persons that would have occurred if the population under study had had the same age distribution as the given standard population. Age-standardization allows for comparisons of incidence or mortality rates over time that are unaffected by changes in the age distribution of the population.
Median refers to the midpoint of a distribution of numbers sorted by size. While the median is a summary measure of a distribution, it does not describe the entire distribution.
End of text box 3
Lawrence Ellison is an analyst with the Health Statistics Division
End of text box 4Start of text box 4
Related material for this article
Additional information
For more statistics and analysis on the health of Canadians and the health care system, visit the Health in Canada module. This module is accessible from the Statistics Canada website, under Features.
Related tables
CANSIM Table 103-0550 New cases of primary cancer (based on the August 2015 CCR tabulation file), by cancer type, age group and sex, Canada, provinces and territories
CANSIM Table 103-0554 New cases and age-standardized rate for primary cancer (based on the August 2015 CCR tabulation file), by cancer type and sex, Canada, provinces and territories
CANSIM Table 102-0522 Deaths, by cause, Chapter II: Neoplasms (C00 to D48), age group and sex, Canada
Data sources
Canadian Cancer Registry (CCR)
Canadian Vital Statistics – Death Database
How to cite this article
Ellison, Lawrence. 2016. “Updating the standard population and its effect on cancer incidence and mortality rates.” Health at a Glance. Statistics Canada Catalogue no. 82-624-X.
End of text box 4
- Date modified: