
Health at a Glance
Understanding your health by using reference ranges

Archived Content
Information identified as archived is provided for reference, research or recordkeeping purposes. It is not subject to the Government of Canada Web Standards and has not been altered or updated since it was archived. Please "contact us" to request a format other than those available.
by Janine Clarke, Victoria Higgins, and Khosrow Adeli
Start of text box 1
Highlights
- Reference ranges are one of the many ways that doctors assess and monitor the health of Canadians.
- Data from the Canadian Health Measures Survey have been used to create Canadian-specific reference ranges for some substances found in blood and urine.
- Reference ranges specific to age are important to account for changes that occur during growth and maturation.
- Sex-specific reference ranges take into account the changes that occur over the lifespan that differ for males and females.
End of text box 1
Introduction
Laboratory tests performed on blood and urine samples are one of the many ways that doctors assess and monitor the health of their patients. The concentrations of different substances (e.g., vitamins or minerals) in the blood or urine help doctors screen for, diagnose, and monitor diseases and treatments. In fact, 70% of medical decisions are based on results from laboratory tests.Note1 Doctors use reference ranges to help them interpret patients' laboratory test results.
Reference ranges represent the limits within which a test result should be if a patient is healthy or free of a disease of interest.Note 2 For example, if a healthy range of a substance is between 100 and 300, then a result of 50 or 350 would be considered "out of range". What is considered a healthy or normal range can vary significantly for any given substance based on a variety of factors, including age and sex. This makes determining reference ranges very challenging because blood and urine samples from a large number of healthy individuals of different ages and sex are required.Note 2
Historically, in Canada, there has been very limited data to calculate reference ranges at a national level. Comprehensive laboratory data has not been collected in Canada since the 1970's.Note 3 As a result, some reference ranges being used to interpret test results are inadequate because they are neither representative of the Canadian population nor are they specific across age and sex groups.Note 4 For example, reference ranges developed from a sample of adults may be used to interpret laboratory test results from children and adolescents because no age-specific references ranges are available. Also, reference ranges developed using a sample of males may be used to interpret results for females, or vice versa.
To help fill this data gap, one of the goals of the Canadian Health Measures Survey (CHMS) is to collect blood and urine samples from a nationally representative sample of Canadians aged 3 to 79. The blood and urine samples collected are tested for a wide range of substances related to general health, nutrition, diseases and environmental contaminants.Note 5,Note 6 These test results from the CHMS were used recently by the Canadian Laboratory Initiative on Paediatric Reference Intervals (known as CALIPER) to develop reference ranges that are specific to the Canadian population by age and sex. So far, this work has been completed for more than 80 substances measured in blood and urine.Note 7,Note 8,Note 9
This article provides two examples of substances measured in the blood of CHMS respondents that have been analyzed by CALIPER with the intent of creating Canadian-specific reference ranges. The first example (a protein called alkaline phosphatase that, for simplicity, will be referred to as ALP) is used to show differences in "normal" values that are related mainly to age, while the second example (ferritin, which is a form of iron stored in the body) is used to show differences in "normal" values related mainly to sex. Results for ALP were calculated using the combined data from CHMS cycles 1 and 2 (2007 to 2011); results for ferritin were calculated using data from CHMS cycle 2 only (collection from August 2009 to November 2011).
The importance of having age-specific reference ranges
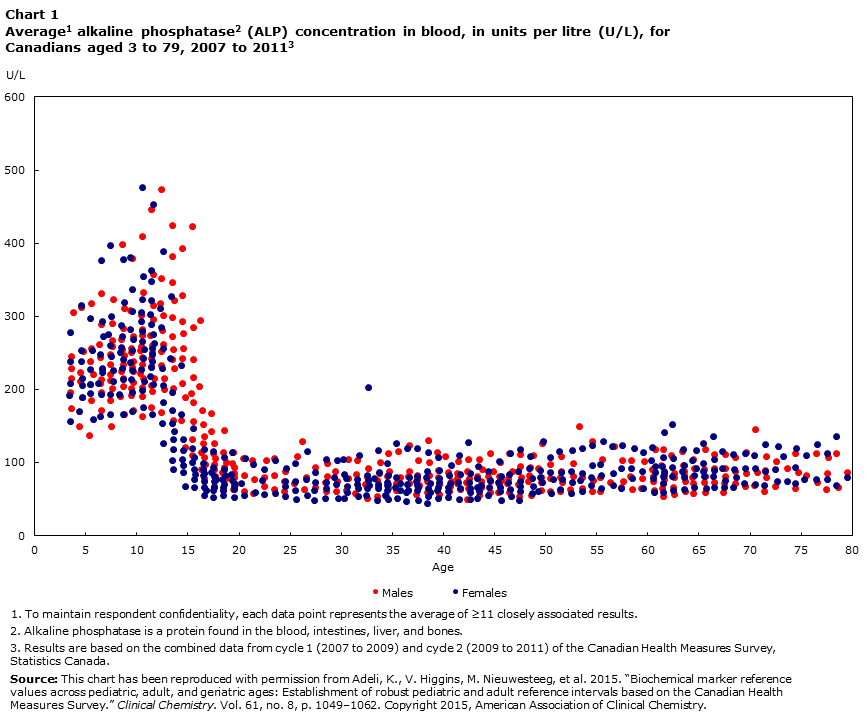
ALP is a protein found in the body that is related to bone growth and development which means that blood levels can vary depending upon age. Blood levels of ALP in Canadians measured by the CHMS were much higher in children aged 3 to 15 years compared with those 16 years of age and older (Chart 1). Among younger children and adolescents there were also noticeable differences in normal values. The range of normal values was lower earlier in childhood (ages 6 to 10 years) but increased during puberty (around ages 10 to 15), and then started to decrease in early adulthood (ages 16 to 21), after which it leveled off (ages 22 to 79).
Data table for Chart 1
| Males - Age | Average (U/L) |
|---|---|
| 3.7 | 306.0 |
| 3.6 | 245.9 |
| 3.6 | 229.9 |
| 3.6 | 216.1 |
| 3.5 | 196.0 |
| 3.6 | 175.0 |
| 4.5 | 312.2 |
| 4.7 | 252.2 |
| 4.4 | 224.2 |
| 4.4 | 211.4 |
| 4.6 | 189.7 |
| 4.3 | 149.8 |
| 5.5 | 318.4 |
| 5.5 | 257.0 |
| 5.4 | 239.4 |
| 5.7 | 221.4 |
| 5.4 | 207.2 |
| 5.5 | 185.4 |
| 5.3 | 137.1 |
| 6.5 | 332.2 |
| 6.5 | 289.8 |
| 6.3 | 261.8 |
| 6.4 | 244.4 |
| 6.6 | 227.9 |
| 6.5 | 214.5 |
| 6.4 | 208.1 |
| 6.5 | 196.9 |
| 6.5 | 172.1 |
| 7.7 | 324.1 |
| 7.6 | 290.9 |
| 7.6 | 267.9 |
| 7.6 | 259.5 |
| 7.4 | 248.3 |
| 7.4 | 235.2 |
| 7.4 | 221.5 |
| 7.4 | 213.1 |
| 7.6 | 201.8 |
| 7.4 | 185.0 |
| 7.5 | 150.6 |
| 8.5 | 399.3 |
| 8.7 | 310.9 |
| 8.6 | 283.5 |
| 8.4 | 268.5 |
| 8.5 | 255.4 |
| 8.7 | 246.6 |
| 8.6 | 234.6 |
| 8.4 | 225.7 |
| 8.6 | 215.6 |
| 8.6 | 205.1 |
| 8.3 | 190.8 |
| 8.7 | 165.9 |
| 9.5 | 379.6 |
| 9.3 | 309.0 |
| 9.6 | 272.8 |
| 9.4 | 256.9 |
| 9.4 | 250.5 |
| 9.6 | 239.2 |
| 9.5 | 231.2 |
| 9.6 | 224.8 |
| 9.6 | 210.3 |
| 9.4 | 202.0 |
| 9.4 | 192.2 |
| 9.6 | 172.4 |
| 10.5 | 409.4 |
| 10.6 | 333.1 |
| 10.4 | 302.4 |
| 10.5 | 283.1 |
| 10.5 | 274.4 |
| 10.4 | 259.1 |
| 10.3 | 253.5 |
| 10.5 | 244.0 |
| 10.5 | 234.7 |
| 10.3 | 222.9 |
| 10.6 | 215.0 |
| 10.5 | 203.0 |
| 10.5 | 191.0 |
| 10.5 | 164.1 |
| 11.4 | 447.1 |
| 11.6 | 357.8 |
| 11.6 | 315.1 |
| 11.6 | 296.1 |
| 11.3 | 275.0 |
| 11.5 | 260.4 |
| 11.5 | 251.8 |
| 11.4 | 243.0 |
| 11.4 | 231.5 |
| 11.7 | 216.1 |
| 11.4 | 206.6 |
| 11.5 | 197.4 |
| 11.4 | 176.4 |
| 12.4 | 473.7 |
| 12.4 | 352.6 |
| 12.3 | 318.4 |
| 12.6 | 301.9 |
| 12.5 | 281.3 |
| 12.6 | 262.3 |
| 12.4 | 252.1 |
| 12.4 | 233.7 |
| 12.7 | 215.2 |
| 12.7 | 200.8 |
| 12.4 | 169.3 |
| 13.4 | 424.9 |
| 13.4 | 383.1 |
| 13.4 | 347.2 |
| 13.6 | 322.8 |
| 13.4 | 299.0 |
| 13.4 | 273.3 |
| 13.5 | 255.8 |
| 13.4 | 241.1 |
| 13.6 | 229.2 |
| 13.5 | 201.8 |
| 13.5 | 158.0 |
| 14.4 | 393.2 |
| 14.4 | 329.5 |
| 14.4 | 294.1 |
| 14.5 | 276.7 |
| 14.5 | 256.6 |
| 14.4 | 242.9 |
| 14.4 | 208.1 |
| 14.7 | 189.1 |
| 14.3 | 157.8 |
| 14.7 | 121.7 |
| 15.4 | 423.3 |
| 15.5 | 284.9 |
| 15.5 | 241.3 |
| 15.5 | 217.2 |
| 15.3 | 195.2 |
| 15.5 | 182.5 |
| 15.5 | 156.6 |
| 15.4 | 132.0 |
| 15.4 | 110.8 |
| 16.2 | 294.7 |
| 16.1 | 204.8 |
| 16.4 | 172.1 |
| 16.5 | 152.9 |
| 16.6 | 136.3 |
| 16.5 | 126.6 |
| 16.3 | 114.9 |
| 16.6 | 107.1 |
| 16.7 | 98.6 |
| 16.3 | 90.9 |
| 16.6 | 79.4 |
| 17.3 | 167.2 |
| 17.3 | 142.9 |
| 17.5 | 127.1 |
| 17.4 | 113.2 |
| 17.6 | 105.5 |
| 17.5 | 98.0 |
| 17.5 | 91.6 |
| 17.6 | 82.1 |
| 17.5 | 68.4 |
| 18.5 | 145.1 |
| 18.4 | 114.1 |
| 18.7 | 101.1 |
| 18.5 | 93.6 |
| 18.3 | 86.7 |
| 18.7 | 79.1 |
| 18.4 | 62.0 |
| 19.4 | 113.9 |
| 19.3 | 99.3 |
| 19.5 | 93.5 |
| 19.5 | 85.5 |
| 19.5 | 80.4 |
| 19.6 | 70.7 |
| 19.4 | 64.2 |
| 20.4 | 106.1 |
| 20.5 | 83.5 |
| 20.5 | 61.4 |
| 21.3 | 103.7 |
| 21.5 | 77.4 |
| 21.4 | 58.8 |
| 22.6 | 104.0 |
| 22.4 | 80.4 |
| 22.4 | 67.7 |
| 23.4 | 106.8 |
| 23.4 | 82.4 |
| 23.4 | 64.4 |
| 24.5 | 88.7 |
| 24.4 | 75.1 |
| 24.4 | 60.8 |
| 25.7 | 109.2 |
| 25.4 | 72.5 |
| 26.2 | 129.0 |
| 26.5 | 79.9 |
| 26.4 | 63.7 |
| 27.4 | 94.3 |
| 27.4 | 66.9 |
| 28.6 | 100.0 |
| 28.6 | 82.2 |
| 28.4 | 73.0 |
| 28.5 | 61.7 |
| 29.4 | 89.0 |
| 29.6 | 75.2 |
| 29.5 | 60.8 |
| 30.7 | 104.5 |
| 30.7 | 78.6 |
| 30.5 | 62.5 |
| 31.5 | 104.0 |
| 31.4 | 83.8 |
| 31.3 | 58.0 |
| 32.6 | 92.4 |
| 32.5 | 79.9 |
| 32.3 | 71.3 |
| 32.5 | 51.0 |
| 33.8 | 100.1 |
| 33.7 | 85.2 |
| 33.5 | 76.2 |
| 33.6 | 68.4 |
| 33.5 | 54.5 |
| 34.6 | 113.3 |
| 34.7 | 88.3 |
| 34.5 | 81.0 |
| 34.6 | 70.2 |
| 34.6 | 64.9 |
| 34.4 | 54.6 |
| 35.6 | 115.1 |
| 35.7 | 79.6 |
| 35.4 | 71.4 |
| 35.4 | 62.6 |
| 36.6 | 123.4 |
| 36.6 | 88.5 |
| 36.5 | 81.3 |
| 36.6 | 72.5 |
| 36.5 | 62.5 |
| 37.5 | 104.1 |
| 37.4 | 83.0 |
| 37.4 | 77.2 |
| 37.6 | 69.0 |
| 37.3 | 56.9 |
| 38.5 | 130.2 |
| 38.6 | 101.2 |
| 38.6 | 83.6 |
| 38.4 | 74.2 |
| 38.4 | 59.0 |
| 39.4 | 114.9 |
| 39.5 | 89.4 |
| 39.5 | 79.9 |
| 39.6 | 71.1 |
| 39.6 | 57.2 |
| 40.2 | 108.3 |
| 40.4 | 87.5 |
| 40.7 | 74.9 |
| 40.6 | 68.2 |
| 40.5 | 60.9 |
| 41.4 | 102.7 |
| 41.3 | 86.0 |
| 41.3 | 78.4 |
| 41.3 | 71.6 |
| 41.6 | 63.7 |
| 42.4 | 105.4 |
| 42.3 | 88.9 |
| 42.5 | 79.5 |
| 42.2 | 73.0 |
| 42.4 | 64.6 |
| 42.3 | 50.6 |
| 43.5 | 104.6 |
| 43.8 | 91.4 |
| 43.3 | 81.9 |
| 43.7 | 75.1 |
| 43.7 | 66.8 |
| 43.5 | 56.0 |
| 44.6 | 112.9 |
| 44.8 | 88.6 |
| 44.4 | 81.4 |
| 44.6 | 74.2 |
| 44.6 | 59.2 |
| 45.5 | 100.6 |
| 45.4 | 82.2 |
| 45.6 | 76.0 |
| 45.4 | 70.1 |
| 45.3 | 60.1 |
| 46.4 | 113.6 |
| 46.7 | 89.0 |
| 46.3 | 78.7 |
| 46.2 | 72.3 |
| 46.4 | 60.2 |
| 47.5 | 112.2 |
| 47.5 | 95.0 |
| 47.3 | 88.3 |
| 47.6 | 80.3 |
| 47.3 | 70.8 |
| 47.4 | 54.5 |
| 48.8 | 109.8 |
| 48.5 | 93.6 |
| 48.4 | 83.4 |
| 48.3 | 74.8 |
| 48.6 | 55.2 |
| 49.6 | 127.3 |
| 49.3 | 92.6 |
| 49.5 | 79.7 |
| 49.5 | 73.1 |
| 49.5 | 62.2 |
| 50.4 | 97.8 |
| 50.4 | 79.3 |
| 50.4 | 60.7 |
| 51.5 | 109.4 |
| 51.5 | 88.1 |
| 51.4 | 80.0 |
| 51.6 | 72.7 |
| 51.4 | 61.6 |
| 52.7 | 98.9 |
| 52.7 | 80.9 |
| 52.4 | 63.7 |
| 53.3 | 149.4 |
| 53.6 | 80.2 |
| 53.6 | 64.8 |
| 54.5 | 129.8 |
| 54.6 | 75.8 |
| 54.5 | 61.5 |
| 55.5 | 105.1 |
| 55.3 | 80.0 |
| 55.3 | 61.7 |
| 56.7 | 122.7 |
| 56.3 | 73.6 |
| 57.5 | 103.1 |
| 57.6 | 74.2 |
| 57.4 | 66.0 |
| 58.4 | 102.8 |
| 58.3 | 81.3 |
| 58.5 | 63.9 |
| 59.6 | 101.7 |
| 59.4 | 78.5 |
| 59.3 | 64.7 |
| 60.7 | 119.1 |
| 60.4 | 91.8 |
| 60.5 | 81.5 |
| 60.5 | 74.8 |
| 60.6 | 62.3 |
| 61.5 | 117.9 |
| 61.3 | 97.1 |
| 61.6 | 87.8 |
| 61.6 | 82.3 |
| 61.6 | 77.9 |
| 61.5 | 72.4 |
| 61.4 | 65.0 |
| 61.5 | 54.3 |
| 62.3 | 109.8 |
| 62.6 | 85.5 |
| 62.6 | 79.8 |
| 62.5 | 67.0 |
| 62.6 | 56.4 |
| 63.3 | 115.3 |
| 63.4 | 96.6 |
| 63.5 | 88.7 |
| 63.5 | 83.2 |
| 63.6 | 75.2 |
| 63.6 | 61.4 |
| 64.4 | 104.8 |
| 64.5 | 92.1 |
| 64.3 | 80.5 |
| 64.4 | 72.1 |
| 64.4 | 58.3 |
| 65.6 | 118.2 |
| 65.5 | 91.2 |
| 65.6 | 82.1 |
| 65.5 | 73.8 |
| 65.6 | 60.1 |
| 66.5 | 111.5 |
| 66.5 | 92.3 |
| 66.5 | 72.7 |
| 67.6 | 111.1 |
| 67.6 | 92.0 |
| 67.6 | 81.6 |
| 67.5 | 72.6 |
| 67.4 | 59.3 |
| 68.5 | 107.8 |
| 68.5 | 88.5 |
| 68.5 | 72.4 |
| 69.6 | 114.9 |
| 69.6 | 86.0 |
| 69.5 | 68.2 |
| 70.5 | 145.9 |
| 70.7 | 87.2 |
| 70.4 | 69.0 |
| 71.6 | 108.3 |
| 71.5 | 89.2 |
| 71.6 | 79.6 |
| 71.4 | 60.9 |
| 72.5 | 101.5 |
| 72.4 | 67.6 |
| 73.6 | 92.9 |
| 74.4 | 113.2 |
| 74.7 | 86.5 |
| 74.4 | 64.6 |
| 75.5 | 83.1 |
| 76.5 | 113.0 |
| 76.6 | 73.0 |
| 77.6 | 106.9 |
| 77.5 | 85.4 |
| 77.4 | 63.4 |
| 78.4 | 113.5 |
| 78.6 | 65.9 |
| 79.5 | 86.5 |
| Females - Age | Average (U/L) |
| 3.5 | 279.1 |
| 3.5 | 238.5 |
| 3.5 | 208.4 |
| 3.4 | 192.1 |
| 3.5 | 156.3 |
| 4.5 | 315.9 |
| 4.5 | 254.5 |
| 4.5 | 238.4 |
| 4.6 | 215.7 |
| 4.6 | 205.8 |
| 4.6 | 189.8 |
| 4.3 | 169.9 |
| 5.4 | 298.0 |
| 5.6 | 253.5 |
| 5.4 | 228.0 |
| 5.4 | 207.5 |
| 5.4 | 194.5 |
| 5.7 | 159.7 |
| 6.5 | 377.5 |
| 6.6 | 293.3 |
| 6.7 | 273.0 |
| 6.4 | 247.8 |
| 6.6 | 229.5 |
| 6.6 | 223.6 |
| 6.2 | 209.3 |
| 6.5 | 193.4 |
| 6.4 | 164.2 |
| 7.4 | 397.2 |
| 7.5 | 300.7 |
| 7.2 | 275.2 |
| 7.4 | 260.5 |
| 7.5 | 245.6 |
| 7.7 | 226.0 |
| 7.7 | 211.7 |
| 7.4 | 193.4 |
| 7.4 | 166.3 |
| 8.6 | 378.3 |
| 8.7 | 319.4 |
| 8.4 | 288.6 |
| 8.5 | 273.1 |
| 8.4 | 257.9 |
| 8.3 | 250.8 |
| 8.6 | 241.8 |
| 8.5 | 228.9 |
| 8.6 | 214.7 |
| 8.2 | 193.3 |
| 8.6 | 166.0 |
| 9.3 | 380.8 |
| 9.5 | 336.8 |
| 9.5 | 307.6 |
| 9.3 | 282.3 |
| 9.6 | 268.5 |
| 9.5 | 253.8 |
| 9.3 | 237.6 |
| 9.5 | 226.7 |
| 9.4 | 214.8 |
| 9.5 | 197.1 |
| 9.5 | 171.1 |
| 10.5 | 476.8 |
| 10.6 | 355.5 |
| 10.5 | 323.5 |
| 10.4 | 305.5 |
| 10.4 | 294.2 |
| 10.5 | 280.2 |
| 10.5 | 266.8 |
| 10.7 | 255.7 |
| 10.6 | 243.5 |
| 10.4 | 228.3 |
| 10.7 | 211.0 |
| 10.5 | 199.8 |
| 10.6 | 176.2 |
| 11.6 | 454.0 |
| 11.4 | 362.9 |
| 11.4 | 347.7 |
| 11.4 | 321.7 |
| 11.3 | 302.5 |
| 11.4 | 289.2 |
| 11.6 | 276.2 |
| 11.7 | 263.6 |
| 11.5 | 256.0 |
| 11.5 | 249.0 |
| 11.5 | 239.4 |
| 11.4 | 231.2 |
| 11.3 | 218.8 |
| 11.6 | 207.5 |
| 11.5 | 167.0 |
| 12.6 | 389.9 |
| 12.3 | 311.9 |
| 12.4 | 284.9 |
| 12.6 | 256.4 |
| 12.5 | 229.0 |
| 12.6 | 205.9 |
| 12.6 | 183.0 |
| 12.5 | 154.3 |
| 12.6 | 126.2 |
| 13.3 | 328.4 |
| 13.2 | 242.5 |
| 13.4 | 197.1 |
| 13.4 | 172.0 |
| 13.4 | 154.0 |
| 13.6 | 142.8 |
| 13.5 | 132.2 |
| 13.5 | 118.6 |
| 13.4 | 103.4 |
| 13.5 | 90.5 |
| 14.3 | 233.1 |
| 14.3 | 165.7 |
| 14.5 | 132.8 |
| 14.5 | 117.3 |
| 14.4 | 104.7 |
| 14.5 | 96.6 |
| 14.5 | 87.1 |
| 14.7 | 68.5 |
| 15.5 | 147.8 |
| 15.4 | 119.5 |
| 15.6 | 108.1 |
| 15.4 | 100.3 |
| 15.6 | 91.2 |
| 15.7 | 84.9 |
| 15.6 | 77.9 |
| 15.6 | 66.9 |
| 16.6 | 117.9 |
| 16.5 | 99.1 |
| 16.5 | 91.3 |
| 16.6 | 85.0 |
| 16.5 | 82.8 |
| 16.6 | 75.3 |
| 16.6 | 66.8 |
| 16.8 | 62.7 |
| 16.6 | 55.4 |
| 17.4 | 116.4 |
| 17.4 | 93.7 |
| 17.3 | 87.5 |
| 17.5 | 81.6 |
| 17.7 | 77.2 |
| 17.5 | 74.2 |
| 17.5 | 66.8 |
| 17.4 | 62.0 |
| 17.4 | 52.5 |
| 18.5 | 107.2 |
| 18.5 | 90.5 |
| 18.6 | 82.4 |
| 18.3 | 77.7 |
| 18.5 | 70.4 |
| 18.4 | 66.3 |
| 18.4 | 62.7 |
| 18.4 | 56.0 |
| 19.3 | 114.2 |
| 19.2 | 84.0 |
| 19.3 | 76.6 |
| 19.5 | 71.4 |
| 19.5 | 68.4 |
| 19.5 | 64.2 |
| 19.5 | 52.9 |
| 20.6 | 105.5 |
| 20.2 | 72.3 |
| 20.5 | 55.3 |
| 21.4 | 98.3 |
| 21.6 | 59.5 |
| 22.4 | 91.5 |
| 22.2 | 76.6 |
| 22.4 | 57.4 |
| 23.5 | 104.1 |
| 23.5 | 58.6 |
| 24.6 | 91.9 |
| 24.5 | 74.4 |
| 24.5 | 67.8 |
| 24.5 | 53.8 |
| 25.5 | 99.3 |
| 25.5 | 74.6 |
| 25.5 | 63.0 |
| 25.6 | 50.3 |
| 26.6 | 116.4 |
| 26.5 | 77.9 |
| 26.6 | 56.0 |
| 27.4 | 87.2 |
| 27.4 | 72.7 |
| 27.3 | 62.5 |
| 27.3 | 49.2 |
| 28.5 | 105.2 |
| 28.5 | 73.5 |
| 28.5 | 65.5 |
| 28.4 | 51.2 |
| 29.6 | 102.9 |
| 29.3 | 80.0 |
| 29.5 | 70.9 |
| 29.7 | 51.1 |
| 30.2 | 105.2 |
| 30.3 | 84.6 |
| 30.5 | 79.1 |
| 30.6 | 67.9 |
| 30.6 | 60.3 |
| 30.3 | 51.6 |
| 31.7 | 110.8 |
| 31.5 | 77.5 |
| 31.5 | 71.3 |
| 31.6 | 65.4 |
| 31.6 | 53.6 |
| 32.6 | 202.8 |
| 32.5 | 83.1 |
| 32.6 | 75.9 |
| 32.7 | 69.6 |
| 32.5 | 65.7 |
| 32.4 | 56.0 |
| 33.6 | 116.8 |
| 33.7 | 87.4 |
| 33.2 | 78.8 |
| 33.6 | 70.6 |
| 33.6 | 64.5 |
| 33.5 | 48.2 |
| 34.5 | 98.9 |
| 34.6 | 83.5 |
| 34.5 | 74.0 |
| 34.5 | 68.9 |
| 34.5 | 62.6 |
| 34.3 | 55.8 |
| 34.6 | 49.6 |
| 35.4 | 126.6 |
| 35.4 | 80.3 |
| 35.7 | 72.0 |
| 35.3 | 66.7 |
| 35.7 | 62.0 |
| 35.5 | 51.7 |
| 36.4 | 119.5 |
| 36.6 | 79.8 |
| 36.4 | 70.6 |
| 36.5 | 63.1 |
| 36.3 | 59.8 |
| 36.3 | 47.9 |
| 37.4 | 120.5 |
| 37.4 | 81.7 |
| 37.3 | 75.1 |
| 37.4 | 69.6 |
| 37.5 | 66.9 |
| 37.4 | 62.9 |
| 37.5 | 49.4 |
| 38.5 | 114.9 |
| 38.4 | 88.6 |
| 38.3 | 80.7 |
| 38.7 | 72.6 |
| 38.5 | 65.7 |
| 38.7 | 59.1 |
| 38.5 | 54.8 |
| 38.4 | 44.8 |
| 39.5 | 108.2 |
| 39.6 | 89.5 |
| 39.6 | 78.4 |
| 39.6 | 72.7 |
| 39.5 | 66.2 |
| 39.4 | 61.8 |
| 39.5 | 51.5 |
| 40.7 | 96.3 |
| 40.5 | 82.4 |
| 40.6 | 71.4 |
| 40.4 | 66.2 |
| 40.4 | 61.5 |
| 40.4 | 52.7 |
| 41.5 | 110.6 |
| 41.6 | 84.6 |
| 41.4 | 73.6 |
| 41.6 | 64.6 |
| 41.5 | 50.1 |
| 42.4 | 127.5 |
| 42.6 | 85.1 |
| 42.5 | 73.8 |
| 42.6 | 65.0 |
| 42.6 | 60.3 |
| 42.6 | 50.7 |
| 43.4 | 94.6 |
| 43.3 | 78.2 |
| 43.7 | 69.3 |
| 43.3 | 66.6 |
| 43.5 | 60.7 |
| 43.3 | 51.0 |
| 44.4 | 89.0 |
| 44.6 | 76.5 |
| 44.5 | 66.1 |
| 44.4 | 55.0 |
| 45.4 | 102.0 |
| 45.6 | 82.1 |
| 45.3 | 73.4 |
| 45.5 | 66.0 |
| 45.5 | 60.4 |
| 45.6 | 49.1 |
| 46.5 | 113.0 |
| 46.4 | 84.4 |
| 46.3 | 73.0 |
| 46.5 | 63.5 |
| 46.6 | 54.0 |
| 47.5 | 118.1 |
| 47.3 | 88.6 |
| 47.5 | 75.3 |
| 47.5 | 68.4 |
| 47.5 | 60.6 |
| 47.4 | 49.0 |
| 48.5 | 109.3 |
| 48.4 | 92.6 |
| 48.7 | 79.3 |
| 48.8 | 67.7 |
| 48.7 | 58.7 |
| 49.7 | 130.0 |
| 49.4 | 89.7 |
| 49.4 | 80.1 |
| 49.6 | 73.3 |
| 49.3 | 60.8 |
| 50.4 | 108.0 |
| 50.4 | 86.4 |
| 50.7 | 78.0 |
| 50.5 | 58.2 |
| 51.3 | 116.1 |
| 51.5 | 87.0 |
| 51.6 | 77.3 |
| 51.4 | 63.4 |
| 52.6 | 116.8 |
| 52.5 | 88.9 |
| 52.6 | 73.1 |
| 52.5 | 58.7 |
| 53.6 | 119.6 |
| 53.6 | 86.3 |
| 53.4 | 76.4 |
| 53.6 | 61.4 |
| 54.5 | 123.6 |
| 54.5 | 96.3 |
| 54.4 | 80.8 |
| 54.4 | 68.6 |
| 55.6 | 129.5 |
| 55.3 | 98.6 |
| 55.4 | 83.1 |
| 55.4 | 65.2 |
| 56.5 | 122.1 |
| 56.6 | 86.2 |
| 56.6 | 69.9 |
| 57.5 | 123.3 |
| 57.4 | 92.0 |
| 57.4 | 65.6 |
| 58.6 | 120.4 |
| 58.4 | 92.6 |
| 58.5 | 78.5 |
| 59.5 | 114.6 |
| 59.4 | 88.4 |
| 59.5 | 65.1 |
| 60.4 | 120.6 |
| 60.3 | 104.1 |
| 60.7 | 95.8 |
| 60.7 | 87.1 |
| 60.5 | 78.4 |
| 60.6 | 59.2 |
| 61.6 | 142.1 |
| 61.5 | 107.6 |
| 61.4 | 95.5 |
| 61.6 | 87.6 |
| 61.5 | 81.6 |
| 61.5 | 72.3 |
| 61.5 | 60.0 |
| 62.4 | 153.0 |
| 62.5 | 105.5 |
| 62.4 | 93.5 |
| 62.4 | 81.2 |
| 62.5 | 61.9 |
| 63.4 | 119.1 |
| 63.5 | 96.2 |
| 63.3 | 88.8 |
| 63.5 | 80.7 |
| 63.5 | 64.4 |
| 64.7 | 117.7 |
| 64.3 | 103.8 |
| 64.7 | 92.1 |
| 64.5 | 83.5 |
| 64.5 | 66.6 |
| 65.4 | 127.0 |
| 65.4 | 99.4 |
| 65.4 | 87.9 |
| 65.5 | 81.0 |
| 65.7 | 65.7 |
| 66.4 | 136.5 |
| 66.5 | 104.3 |
| 66.5 | 89.4 |
| 66.4 | 82.1 |
| 66.5 | 66.9 |
| 67.3 | 115.6 |
| 67.3 | 92.3 |
| 67.6 | 76.2 |
| 67.5 | 66.5 |
| 68.3 | 111.2 |
| 68.4 | 91.1 |
| 68.6 | 80.8 |
| 68.3 | 66.1 |
| 69.5 | 113.6 |
| 69.5 | 93.1 |
| 69.4 | 71.8 |
| 70.4 | 110.1 |
| 70.5 | 93.1 |
| 70.5 | 70.9 |
| 71.5 | 126.0 |
| 71.5 | 88.8 |
| 71.4 | 68.9 |
| 72.7 | 122.6 |
| 72.4 | 90.5 |
| 72.6 | 74.4 |
| 73.2 | 109.4 |
| 73.6 | 74.3 |
| 74.5 | 119.9 |
| 74.4 | 93.9 |
| 74.4 | 72.0 |
| 75.5 | 110.4 |
| 75.3 | 77.0 |
| 76.6 | 125.9 |
| 76.5 | 77.0 |
| 77.5 | 112.8 |
| 77.5 | 78.0 |
| 78.4 | 135.9 |
| 78.4 | 69.5 |
| 79.5 | 79.7 |
|
|
The different levels of ALP in blood occur because of changes in the rate at which the bones are growing at different times throughout childhood and adolescence. Body weight doubles during the first six months of life and triples by the first birthday. Later, during puberty, when there are changes in hormones, growth is accelerated, and sexual maturation occurs. These types of physical and hormonal changes are unique to children and adolescents and can affect the levels of ALP in the blood. This makes it important to have reference ranges that are specific for different age groups.
Historically, even though it was understood that ALP levels were expected to be higher in children compared with adults, no specific reference ranges were available by age.Note 10 The data presented in Chart 1 were used by CALIPER to create reference ranges of normal ALP values for the Canadian population aged 3 to 79 (Table 1).Note 7 The reference ranges were broken down into five different age groups to account for the differences in ALP levels at different ages (Chart 1). Such detailed reference ranges provide doctors and other healthcare providers with more information to interpret ALP results for a patient depending on their age. Using the previous reference range, an ALP result of 100 might have been interpreted as "normal" for a patient under the age of 16, when, according to the new ranges based on CHMS data, a result of 100 is considered too low.
| Age group | Males | Females |
|---|---|---|
| units per litre (U/L) | ||
| 3 to 5 | 144 to 327 | 144 to 327 |
| 6 to 10 | 153 to 367 | 153 to 367 |
| 11 to 15 | 113 to 438 | 64 to 359 |
| 16 to 21 | 56 to 167 | 44 to 107 |
| 22 to 79 | 50 to 116 | 46 to 122 |
|
||
The importance of having sex-specific reference ranges
As with age, normal values for many substances in blood or urine can also differ for males and females. Therefore, it is also beneficial when reference ranges are sex specific. Since ALP levels are higher in males compared with females from about ages 11 to 21 (Chart 1), the reference ranges differ for males and females after age 11 (Table 1).Note 6
Another substance where results differ for males and females is iron. Iron is a mineral found in the blood that helps the body carry and use oxygen. The CHMS measured the level of ferritin in blood, which is a measure of total iron storage in the body. In Canada, ferritin levels measured by the CHMS were similar for both boys and girls during childhood, but then were higher in males after age 15 (Chart 2).Note 8 Females of reproductive age (14 to 49 years) had lower ferritin levels than females 50 years of age and older. Around age 50, ferritin levels started to increase for females, but remained lower than ferritin levels in males of the same age.

Data table for Chart 2
| Males - Age | Average (µg/L) |
|---|---|
| 3.4 | 61.8 |
| 3.7 | 40.6 |
| 3.4 | 32.8 |
| 3.5 | 25.8 |
| 3.7 | 18.5 |
| 3.6 | 12.8 |
| 4.7 | 66.1 |
| 4.4 | 39.9 |
| 4.4 | 33.3 |
| 4.5 | 26.4 |
| 4.5 | 18.5 |
| 5.5 | 87.8 |
| 5.6 | 53.5 |
| 5.6 | 42.3 |
| 5.4 | 33.9 |
| 5.4 | 27.6 |
| 5.4 | 21.7 |
| 5.4 | 14.0 |
| 6.7 | 68.2 |
| 6.6 | 46.7 |
| 6.5 | 35.0 |
| 6.4 | 22.2 |
| 7.5 | 70.2 |
| 7.5 | 51.2 |
| 7.6 | 39.6 |
| 7.3 | 30.9 |
| 7.6 | 19.0 |
| 8.6 | 71.8 |
| 8.6 | 54.3 |
| 8.7 | 47.3 |
| 8.8 | 38.6 |
| 8.3 | 34.6 |
| 8.4 | 22.9 |
| 9.3 | 92.0 |
| 9.5 | 59.6 |
| 9.7 | 42.8 |
| 9.4 | 36.6 |
| 9.4 | 24.6 |
| 10.7 | 104.9 |
| 10.4 | 65.9 |
| 10.6 | 52.4 |
| 10.5 | 40.5 |
| 10.5 | 35.2 |
| 10.5 | 28.2 |
| 10.3 | 24.0 |
| 11.6 | 98.8 |
| 11.5 | 65.3 |
| 11.5 | 54.4 |
| 11.5 | 47.9 |
| 11.2 | 42.1 |
| 11.5 | 35.3 |
| 11.6 | 24.8 |
| 12.3 | 68.4 |
| 12.6 | 53.7 |
| 12.6 | 42.7 |
| 12.3 | 37.0 |
| 12.5 | 25.9 |
| 13.6 | 100.3 |
| 13.5 | 50.0 |
| 13.3 | 38.3 |
| 13.4 | 26.2 |
| 14.5 | 71.6 |
| 14.4 | 55.1 |
| 14.5 | 44.5 |
| 14.5 | 40.1 |
| 14.5 | 28.1 |
| 15.3 | 132.0 |
| 15.6 | 68.9 |
| 15.4 | 60.4 |
| 15.4 | 48.3 |
| 15.5 | 29.3 |
| 16.7 | 152.1 |
| 16.5 | 89.9 |
| 16.4 | 71.2 |
| 16.5 | 54.9 |
| 16.5 | 40.2 |
| 17.4 | 141.9 |
| 17.5 | 93.9 |
| 17.5 | 62.9 |
| 17.5 | 49.1 |
| 18.6 | 168.4 |
| 18.4 | 98.6 |
| 18.6 | 63.8 |
| 18.6 | 44.2 |
| 19.7 | 163.7 |
| 19.4 | 102.2 |
| 19.4 | 58.3 |
| 20.5 | 155.8 |
| 21.4 | 147.4 |
| 22.3 | 102.8 |
| 23.5 | 144.0 |
| 24.4 | 96.1 |
| 25.5 | 175.5 |
| 26.3 | 249.6 |
| 26.3 | 107.1 |
| 27.4 | 129.9 |
| 28.6 | 368.4 |
| 28.7 | 127.3 |
| 29.7 | 261.4 |
| 29.3 | 81.5 |
| 30.6 | 188.2 |
| 31.5 | 309.3 |
| 32.4 | 259.8 |
| 32.6 | 120.2 |
| 33.6 | 278.6 |
| 33.7 | 128.5 |
| 34.6 | 320.2 |
| 34.4 | 197.1 |
| 34.5 | 133.7 |
| 35.5 | 299.9 |
| 35.6 | 149.2 |
| 36.6 | 359.4 |
| 36.7 | 163.0 |
| 36.6 | 83.6 |
| 37.3 | 282.3 |
| 37.5 | 168.4 |
| 38.7 | 505.8 |
| 38.5 | 205.9 |
| 38.6 | 39.0 |
| 39.4 | 637.8 |
| 39.6 | 150.5 |
| 40.2 | 837.8 |
| 40.6 | 163.9 |
| 41.2 | 621.4 |
| 41.7 | 211.5 |
| 41.3 | 121.0 |
| 42.1 | 318.2 |
| 42.4 | 186.1 |
| 42.3 | 82.7 |
| 43.5 | 375.7 |
| 43.7 | 198.8 |
| 43.5 | 82.5 |
| 44.6 | 449.9 |
| 44.7 | 145.1 |
| 45.3 | 493.7 |
| 45.3 | 240.2 |
| 45.6 | 110.7 |
| 46.2 | 335.3 |
| 46.4 | 131.9 |
| 47.5 | 405.8 |
| 47.5 | 265.1 |
| 47.5 | 103.1 |
| 48.5 | 325.5 |
| 48.5 | 112.8 |
| 49.4 | 405.8 |
| 49.6 | 144.0 |
| 50.4 | 226.5 |
| 51.4 | 257.2 |
| 51.6 | 97.8 |
| 52.5 | 252.3 |
| 52.6 | 111.1 |
| 53.6 | 185.1 |
| 54.5 | 188.4 |
| 55.4 | 271.9 |
| 56.6 | 169.0 |
| 57.6 | 326.5 |
| 58.3 | 155.6 |
| 59.4 | 296.2 |
| 60.4 | 343.9 |
| 60.5 | 100.3 |
| 61.6 | 455.1 |
| 61.6 | 201.7 |
| 61.6 | 110.9 |
| 61.6 | 62.7 |
| 62.5 | 383.9 |
| 62.6 | 116.8 |
| 63.6 | 446.7 |
| 63.3 | 234.7 |
| 63.5 | 112.7 |
| 64.4 | 350.0 |
| 64.3 | 116.8 |
| 65.7 | 544.5 |
| 65.5 | 129.2 |
| 66.5 | 392.0 |
| 66.5 | 99.4 |
| 67.6 | 359.1 |
| 67.4 | 126.9 |
| 68.6 | 187.0 |
| 69.6 | 259.8 |
| 69.5 | 64.8 |
| 70.6 | 199.0 |
| 71.6 | 163.9 |
| 72.4 | 301.0 |
| 74.5 | 381.3 |
| 74.2 | 140.4 |
| 76.1 | 147.4 |
| 77.5 | 183.9 |
| 78.5 | 216.7 |
| 79.5 | 168.1 |
| Females - Age | Average (µg/L) |
| 3.5 | 63.5 |
| 3.6 | 44.3 |
| 3.4 | 35.9 |
| 3.4 | 29.2 |
| 3.5 | 16.7 |
| 4.3 | 68.4 |
| 4.7 | 44.7 |
| 4.5 | 38.1 |
| 4.6 | 31.4 |
| 4.4 | 26.5 |
| 4.5 | 21.2 |
| 4.5 | 14.0 |
| 5.6 | 59.3 |
| 5.8 | 43.1 |
| 5.3 | 35.8 |
| 5.5 | 29.7 |
| 5.5 | 24.5 |
| 5.4 | 15.5 |
| 6.7 | 79.7 |
| 6.3 | 47.8 |
| 6.4 | 41.5 |
| 6.5 | 31.8 |
| 6.4 | 20.8 |
| 7.5 | 76.0 |
| 7.3 | 53.3 |
| 7.5 | 29.4 |
| 8.7 | 92.6 |
| 8.5 | 60.5 |
| 8.4 | 47.7 |
| 8.6 | 40.8 |
| 8.3 | 36.1 |
| 8.6 | 27.0 |
| 9.5 | 91.6 |
| 9.5 | 59.3 |
| 9.6 | 46.6 |
| 9.3 | 37.2 |
| 9.6 | 27.3 |
| 10.7 | 89.6 |
| 10.7 | 56.0 |
| 10.4 | 46.2 |
| 10.7 | 39.8 |
| 10.6 | 35.0 |
| 10.5 | 24.3 |
| 11.5 | 113.8 |
| 11.6 | 57.9 |
| 11.3 | 47.1 |
| 11.5 | 41.0 |
| 11.4 | 35.9 |
| 11.3 | 30.1 |
| 11.6 | 19.2 |
| 12.5 | 64.5 |
| 12.4 | 43.6 |
| 12.7 | 34.6 |
| 12.4 | 30.0 |
| 12.7 | 16.1 |
| 13.3 | 78.6 |
| 13.5 | 50.2 |
| 13.3 | 41.5 |
| 13.4 | 30.7 |
| 13.5 | 18.8 |
| 14.6 | 68.4 |
| 14.6 | 35.7 |
| 14.4 | 26.0 |
| 14.5 | 15.3 |
| 15.6 | 69.5 |
| 15.6 | 37.4 |
| 15.4 | 24.4 |
| 15.7 | 11.7 |
| 16.6 | 75.0 |
| 16.5 | 47.9 |
| 16.6 | 33.3 |
| 16.6 | 18.1 |
| 17.5 | 80.8 |
| 17.7 | 40.7 |
| 17.5 | 31.4 |
| 17.4 | 16.7 |
| 18.5 | 73.1 |
| 18.6 | 48.1 |
| 18.4 | 31.9 |
| 18.3 | 15.8 |
| 19.5 | 90.6 |
| 19.5 | 42.1 |
| 19.4 | 20.1 |
| 20.4 | 45.0 |
| 21.5 | 31.3 |
| 22.3 | 63.4 |
| 23.5 | 49.4 |
| 24.5 | 97.1 |
| 24.5 | 31.1 |
| 25.6 | 30.2 |
| 26.6 | 56.8 |
| 27.3 | 66.9 |
| 28.5 | 74.9 |
| 28.7 | 29.4 |
| 29.3 | 78.4 |
| 29.8 | 22.5 |
| 30.3 | 105.6 |
| 30.3 | 61.4 |
| 30.2 | 33.0 |
| 31.5 | 97.0 |
| 31.6 | 49.2 |
| 31.5 | 26.4 |
| 32.6 | 95.4 |
| 32.4 | 52.7 |
| 32.6 | 33.1 |
| 32.5 | 14.3 |
| 33.6 | 115.1 |
| 33.5 | 59.3 |
| 33.3 | 37.7 |
| 33.6 | 24.4 |
| 34.5 | 103.5 |
| 34.6 | 57.3 |
| 34.4 | 39.1 |
| 34.6 | 16.6 |
| 35.3 | 101.1 |
| 35.7 | 51.5 |
| 35.6 | 27.3 |
| 36.4 | 111.9 |
| 36.5 | 54.0 |
| 36.4 | 24.1 |
| 37.4 | 84.0 |
| 37.5 | 47.0 |
| 37.4 | 23.5 |
| 38.4 | 141.1 |
| 38.4 | 71.9 |
| 38.7 | 47.2 |
| 38.7 | 30.9 |
| 39.6 | 116.0 |
| 39.6 | 52.9 |
| 39.6 | 36.1 |
| 39.4 | 19.5 |
| 40.4 | 115.6 |
| 40.5 | 35.1 |
| 40.7 | 15.8 |
| 41.4 | 96.8 |
| 41.3 | 36.2 |
| 41.6 | 20.1 |
| 42.4 | 90.4 |
| 42.8 | 43.2 |
| 42.5 | 17.1 |
| 43.3 | 95.0 |
| 43.4 | 21.9 |
| 44.5 | 36.6 |
| 45.5 | 109.1 |
| 45.5 | 32.5 |
| 46.6 | 71.7 |
| 46.4 | 20.5 |
| 47.4 | 105.8 |
| 47.4 | 48.1 |
| 47.6 | 23.0 |
| 48.7 | 118.4 |
| 48.6 | 29.2 |
| 49.6 | 135.4 |
| 49.6 | 52.6 |
| 50.3 | 120.9 |
| 50.7 | 51.0 |
| 51.3 | 137.0 |
| 51.6 | 52.8 |
| 52.6 | 66.6 |
| 53.4 | 154.0 |
| 53.7 | 38.2 |
| 54.5 | 145.1 |
| 54.5 | 55.2 |
| 55.3 | 221.3 |
| 55.4 | 81.7 |
| 56.6 | 121.6 |
| 57.5 | 158.8 |
| 58.5 | 110.5 |
| 59.4 | 101.5 |
| 60.7 | 333.6 |
| 60.6 | 125.1 |
| 60.4 | 55.1 |
| 61.5 | 281.7 |
| 61.5 | 149.6 |
| 61.6 | 94.6 |
| 61.5 | 56.5 |
| 62.4 | 188.8 |
| 62.5 | 60.9 |
| 63.5 | 253.7 |
| 63.5 | 118.4 |
| 63.5 | 52.7 |
| 64.5 | 209.4 |
| 64.5 | 76.9 |
| 65.4 | 240.9 |
| 65.6 | 95.0 |
| 66.5 | 309.2 |
| 66.4 | 126.8 |
| 66.4 | 64.7 |
| 67.6 | 142.3 |
| 67.2 | 33.5 |
| 68.3 | 251.9 |
| 68.4 | 69.5 |
| 69.6 | 183.9 |
| 69.3 | 55.8 |
| 70.5 | 103.5 |
| 71.4 | 163.9 |
| 72.6 | 87.7 |
| 73.4 | 107.1 |
| 74.4 | 134.8 |
| 75.3 | 137.0 |
| 76.5 | 151.0 |
| 78.1 | 213.4 |
| 78.0 | 59.2 |
| 79.5 | 77.5 |
|
|
The differences between males and females in iron levels occur because of different physical and hormonal changes experienced throughout the lifecycle. For example, puberty generally occurs earlier in girls (between ages 10 and 14) than in boys (between ages 12 and 16), and results in different types and levels of hormones which affect the growth of each sex differently.Note 11 Later in life, usually after the age of 45, women experience menopause following changes in the production of some hormones.Note 12 These physical and hormonal differences between males and females affect the levels of many substances in the blood or urine when comparing males and females at any given age. For a substance like iron, females of reproductive age have lower levels compared to males and compared to older females because iron loss occurs during menstruation.Note 13 It is because of these many reasons that it is important to have reference ranges that are both age-specific and sex-specific.
Data from the CHMS were used by CALIPER to create reference ranges of normal ferritin values for the Canadian population by age and sex (Table 2).Note 7 While the reference ranges are similar for both males and females in the younger age groups (up to 16 years), the reference ranges for males are much higher than for females in the older age groups (17 years of age and older).
| Age group | Males | Females |
|---|---|---|
| micrograms per litre (µg/L) | ||
| 3 to 5 | 10.7 to 85.2 | 10.7 to 85.2 |
| 6 to 16 | 16.2 to 106.7 | 9.6 to 81.9 |
| 17 to 37 | 39.3 to 439.4 | 6.5 to 147.1 |
| 38 to 79 | 45.8 to 714.8 | 6.0 to 362.6 |
|
||
Start of text box 2
The Canadian Laboratory Initiative on Paediatric Reference Intervals (CALIPER) Project
The Canadian Laboratory Initiative on Paediatric Reference Intervals (CALIPER) Project is a nation-wide initiative aimed at developing a database of complete and accurate age- and sex-specific reference ranges for the pediatric population. CALIPER has used data from the CHMS along with data collected from healthy community children and adolescents in order to fill the gaps that currently exist in pediatric reference ranges in Canada. A database of reference ranges for more than 80 biomarkers is available online (www.caliperdatabase.com) and through a mobile app (CALIPERApp).
For more information on CALIPER go to www.caliperproject.ca.
End of text box 2
Conclusion
Blood and urine samples from a nationally representative sample of healthy Canadians are necessary for the development of age- and sex-specific reference ranges in Canada. The level of a substance in the blood varies due to growth and maturation over the life course, and these changes can be different for males and females. As such, having age- and sex-specific reference ranges for Canadians can improve a doctor's ability to screen, diagnose and monitor diseases.
Janine Clarke is an analyst with Health Statistics Division at Statistics Canada.
Victoria Higgins and Khosrow Adeli are researchers with CALIPER at the Hospital for Sick Children in Toronto, Ontario, Canada.
Start of text box 3
Data source, methods and definitions
Data source
The Canadian Health Measures Survey (CHMS) is a cross-sectional survey conducted by Statistics Canada in partnership with Health Canada and the Public Health Agency of Canada. Data were collected over a two-year collection cycle from a nationally representative sample of Canadians aged 6 to 79 in cycle 1 (March 2007 to February 2009) and 3 to 79 in cycle 2 (August 2009 to November 2011). The results are representative of approximately 96% of the Canadian population: persons living on reserves or other Aboriginal settlements, full-time members of the Canadian Forces, institutionalized populations, and persons living in certain remote regions are excluded. The CHMS includes an in-home interview and a visit to a mobile clinic where physical measurements (e.g., height and weight) and blood and urine samples are taken.
Methods
Scatterplots were created by CALIPER using data from the CHMS to demonstrate the distribution of the data by age and sex. For reasons of confidentiality, each data point represents the average of 11 or more closely associated results. Statistical tests were then used to remove outliers before the calculation of the reference ranges. Reference ranges were created by calculating the 2.5th and 97.5th percentile values for a given substance from a healthy subsample of respondents from the CHMS. Respondents of the CHMS were excluded from the reference range analysis if they:
- were pregnant at the time of the clinic appointment;
- had been diagnosed by a health care professional with a serious medical illness or chronic condition; or
- self-reported the use of any prescription medication.
End of text box 3
Start of text box 4
Related material for this article
Related articles
Adeli, K., V. Higgins, M. Nieuwesteeg, et al. 2015. "Biochemical marker reference values across pediatric, adult, and geriatric ages: Establishment of robust pediatric and adult reference intervals on the basis of the Canadian Health Measures Survey." Clinical Chemistry. Vol. 61, no. 8, p. 1049 to 1062.
Adeli, K., V. Higgins, M. Nieuwesteeg, et al. 2015. "Complex reference values for endocrine and special chemistry biomarkers across pediatric, adult, and geriatric ages: Establishment of robust pediatric and adult reference intervals on the basis of the Canadian Health Measures Survey." Clinical Chemistry. Vol. 61, no. 8, p. 1063–1074.
Adeli, K., J.E. Raizman, Y. Chen, et al. 2015. "Complex biological profile of hematologic markers across pediatric, adult, and geriatric ages: Establishment of robust pediatric and adult reference intervals on the basis of the Canadian Health Measures Survey." Clinical Chemistry. Vol. 61, no. 8, p. 1075 to 1086.
Higgins, V. and K. Adeli. 2015. "CALIPER database of paediatric reference intervals: key milestones and future directions." Folia Medica Copernicana. Vol. 3, no. 1, p. 7 to 12.
Data source
Canadian Health Measures Survey
How to cite this article
Clarke, J., V. Higgins, and K. Adeli. 2016. "Understanding your health by using reference ranges." Health at a Glance. Statistics Canada Catalogue no. 82-624-X.
End of text box 4
- Date modified: