
Chart 2
Life expectancy at birth and at age 1, by sex, Canada, 1920–1922 to 2005–2007
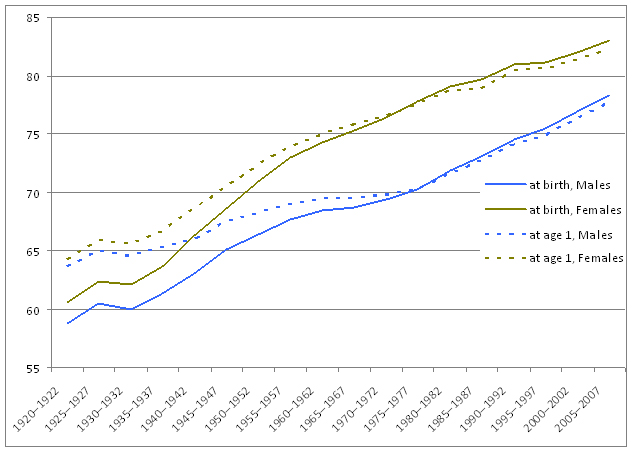
Note: In this chart, the calculation of life expectancy is based on three consecutive years of death data and population estimates.
Sources: Nagunar. Longevity and Historical Life Tables (for 1920–1922 through 1980–1982);
Statistics Canada Catalogue no.84–537, Life Tables (for 1985–1987 and 1990–1992);
Statistics Canada, Vital Statistics, CANSIM table 102–0512, Life expectancy (for 1995–1997 through 2005–2007).
- Date modified: