
Health Reports
Inequalities in access to primary care services and health insurance in Black adults in Canada


DOI: https://www.doi.org/10.25318/82-003-x202600700001-eng
Abstract
Background
Previous research has shown that Black adults in Canada experience higher cause-specific mortality and differential rates of diagnosis and hospitalization compared with White adults. These disparities may reflect underlying differences in access to health care. This study assesses whether inequalities in access to primary and pharmaceutical health care exist between Black and White adults in Canada.
Data and methods
This study used pooled data from the annual Canadian Community Health Survey from 2015 to 2019. Access to care was measured through indicators of primary care access and insurance for prescription medicine. Inequalities were assessed through crude and adjusted differences between Black and White adults, and counterfactual decomposition methods were applied to identify the contributions of specific factors to observed inequalities.
Results
Primary care access and insurance for prescription medicine were significantly lower for Black adults aged 25 years and older, compared with White adults in the same age group, from 2015 to 2019. About three-quarters of the differences in having a regular health care provider and insurance for prescription medicine were explained by population differences in the levels of measured covariates, including demographic, immigrant, and socioeconomic factors. By contrast, less than one-third of the difference in going to a doctor’s office for care of a minor problem was explained by model covariates.
Interpretation
Much of the measured inequality between Black and White adults in having a regular health care provider and insurance for prescription medicine was attributable to differences in demographic factors, immigrant status, and socioeconomic variables. However, these factors explained less of the inequality in visiting a doctor's office for care of a minor problem. Notably, socioeconomic factors — including educational attainment, occupational skill level, and household income — represent modifiable determinants that may be amenable in reducing the observed disparity.
Keywords
Health care disparities; health services accessibility; racialized groups; adult
Authors
Thomas J. Charters, Toyib Olaniyan, and Leanne C. Findlay are with the Health Analysis and Modelling Division, Statistics Canada.
What is already known on this subject?
- Prior analyses using national population-based cohorts such as the Canadian Census Health and Environment Cohort identified elevated mortality risks among Black adults compared with White adults in Canada.
- Subsequent analyses found increased incident diagnoses or hospitalizations, in addition to differences in survivability for cause-specific mortality, among Black adults relative to White adults, with outcomes differing by sex and cause of death.
- Compared with non-racialized Canadians, Black Canadians have lower levels of health care access. However, previous studies have found that this difference may be attributed to demographic and socioeconomic differences between the Black and White populations in Canada.
What does this study add?
- This study updates research on differential access to primary care and insurance for prescription medicine between Black and White adults living in Canada from 2015 to 2019.
- This study used Blinder–Oaxaca counterfactual decomposition methods to quantify the contributions of specific factors to inequalities between Black and White adults in accessing primary care and prescription insurance and to assess how much of the difference was explained by these factors.
- Inequalities in access outcomes between Black and White adults may be largely but not entirely related to differences in demographic factors, immigrant status, and socioeconomic status.
- “Unexplained” portions of the inequalities remaining after equalizing covariates between Black and White adults contributed to about one-quarter to about two-thirds of the gaps in access. This unexplained component suggests that even when Black and White adults share similar socioeconomic and demographic profiles, disparities in access persist, pointing to unmeasured biological, cultural, and structural factors, in addition to measurement error.
Introduction
In 2021, the Black population in Canada comprised 1.5 million people with diverse ethnic and cultural origins, languages, and countries of birth.Note 1 Past research has found greater disease burden among the Black population relative to the White population in Canada, including higher prevalence of diabetes and hypertension, higher rates of behavioural risk factors for cardiovascular disease,Note 2, Note 3 and higher age-standardized mortality during the COVID-19 pandemic.Note 4 Additionally, Black Canadians have been reported to experience a number of inequalities in social determinants of health relating to income, education, employment, food security, and housing, compared with White Canadians.Note 5
Recent research using the Canadian Census Health and Environment Cohorts reported a higher risk of cause-specific mortality in Black adults compared with White adults, including higher mortality from HIV/AIDS, diabetes mellitus, corpus uteri cancer (among women), and prostate cancer (among men).Note 6 A follow-up studyNote 7 explored paths prior to mortality, finding higher rates of incident diagnosis or hospitalization in Black adults relative to White adults, while rates in survivability differed by cause of death. Underlying factors preceding and potentially contributing to differential disease severity and survivability following diagnosis may contribute to heightened mortality risk of Black adults compared with White adults. As such, exploring differential access to health care between Black and White adults in Canada is warranted, given that health care access may contribute to differences between Black and White adults in morbidity and mortality.
Equitable access to health care pertains to equal opportunities to access care for those with equal need, where services are acceptable, timely, and without barriers.Note 8, Note 9 Many Canadian studies have focused on primary care access. Primary care provides the first point of contact for most patients, largely comprises family physicians and general practitioners, offers long-term and individual-focused care, and coordinates with other elements of the health system.Note 10, Note 11, Note 12 Primary care access is commonly measured by opportunities to use a service (e.g., having a regular doctor) or by utilization (e.g., number of consultations).Note 9 This study focuses on the former because utilization may be more subject to intangible or unmeasured factors (e.g., care preferences, comorbidities).
Canada’s universal, publicly funded health care system provides medically necessary physician, hospital, and diagnostic services free at the point of service.Note 13 In principle, access to publicly insured services is based on need rather than the ability to pay, although the distribution of resources within the health system often leads to inequitable access to health services. In 2023, over four in five Canadians had a regular health care provider (83%), with nearly 1 in 10 Canadians reporting unmet health care needs in 2022.Note 14 Enrolment and strong continuity of care with a primary care provider have been found to greatly enhance access to routine care,Note 15 increase adherence to preventive care,Note 16, Note 17 improve management of chronic conditions,Note 18, Note 19 reduce the likelihood of having unmet health needs,Note 20 decrease hospitalizations and emergency room visits,Note 17, Note 21, Note 22, Note 23, Note 24 and lower mortality.Note 25, Note 26
In contrast to physician and hospital services, prescription drugs used outside hospitals are not universally covered in Canada.Note 13 Instead, they are paid for through a mix of public and private insurance, where drug costs may be partly covered by provincial plans (e.g., for groups such as seniors or low-income families, or for specific high-cost drugs)Note 27 or by supplementary health insurance plans, often provided through employers.Note 28 Lack of insurance for prescription medicine has been associated with higher rates of cost-related non-adherence (where patients may skip or delay taking medications because of cost)Note 28, Note 29, Note 30 and high financial burden on families.Note 31 In 2016, about one in five Canadians did not have prescription drug insurance.Note 28 For these reasons, this study considers insurance for prescription medicine as a secondary measure of access.
Comparatively little Canadian research has investigated inequalities in health care access across racialized groups, particularly for Black populations. In 2023, 84% of non-racialized Canadians had a regular care provider, compared with 72% of Black Canadians.Note 14 Differences in having a regular health care provider have been explained by differences in demographic and socioeconomic characteristics between Black and White populationsNote 32 and between racialized and non-racialized populations in Canada.Note 33 However, other evidence suggests that racial inequalities in access have increased over timeNote 34 or differ based on service type,Note 35 such as lower use of mental health services among Black Canadians.Note 36 Qualitative work has highlighted experiences with discrimination or barriers to access among racialized populations receiving health services.Note 37, Note 38 Experiences of discrimination in care have the potential to reduce contact with the health system and impact patient trust and satisfaction, communication, and treatment adherence.Note 39
Inequalities in access to health care may be associated with reductions in routine and preventive care and lead to increased risk of unmet health needs, morbidity, hospitalization, and mortality. This study examines differential access to primary care and insurance for prescription medicine (termed “primary and pharmaceutical care access” hereafter) between Black and White adults living in Canada from 2015 to 2019. This study examines differences in health care access between Black and White Canadian adults aged 25 years and older and assesses how and the extent to which demographic and socioeconomic factors contribute to inequalities in access through the use of regression-based analysis and counterfactual decomposition methods.
Methods and materials
Data
This study used pooled 12-month cycles of the annual Canadian Community Health Survey (CCHS) from 2015 to 2019. The CCHS is a representative cross-sectional survey covering health status, health behaviours, and health care access, in addition to detailed demographic and socioeconomic profiles of respondents. The CCHS collects information on the Canadian population aged 12 years and older residing in private dwellings, excluding those residing on Indian reserves, on Crown lands, in institutions, or in remote regions, or serving in the Canadian Forces.Note 40 Residents of the territories are not represented in the one-year surveys. Approximately 98% of Canadians aged 12 and older are represented by the CCHS.Note 40 Annual response rates ranged from 54.4% to 62.8% over this period.
Measures
Access to primary care was measured by three outcome measures, while access to pharmaceutical care was measured by one. Access to primary care included (a) whether people had a regular health care provider (“Do you have a regular health care provider? By this, we mean one health professional that you regularly see or talk to when you need care or advice for your health”); (b) whether people had a usual place for immediate care for a minor health problem; and, if so, (c) whether they received this care at a doctor’s office or at another place (including a hospital outpatient clinic, a community health centre or centre local de services communautaires, a walk-in clinic, a hospital emergency room, or other). Questions on insurance for prescription medicine were asked in all provinces in 2015, 2016, and 2019 (they were omitted in 2017 and 2018, when they were included as an optional module for less than 6% of respondents), asking, “Do you have insurance that covers all or part of the cost of your prescription medications?”
Respondents specified the racialized or cultural groups they identified with: White, South Asian, Chinese, Black, Filipino, Latin American, Arab, Southeast Asian, West Asian, Korean, Japanese, and other. Individuals who identified as White only or as Black only (did not select multiple racialized or cultural origins) were categorized as White and Black adults, respectively. A third category included all other or multiple racialized and cultural groups. Respondents with Indigenous identities were not included in this study because this group constitutes a distinct identity group under the Employment Equity ActNote 41 with a unique historical, cultural, and social history in Canada. In addition, there was not enough power within the CCHS to explore individual Indigenous identity-specific analysis.
Characteristics related to social determinants of health were included as model covariates and selected based on associations with health and care access.Note 6, Note 9, Note 15 These included sex, age (25 to 34 years, 35 to 44 years, 45 to 54 years, 55 to 64 years, 65 to 74 years, and 75 years or older), and educational attainment (highest certificate, diploma or degree completed is less than a bachelor’s degree, or a bachelor’s degree or higher). The National Occupational Classification (NOC) was used to code occupations from respondent descriptions of their activities, and used to derive NOC skill levels as a measure of the education, training, and experience required for entry in different occupations.Note 42, Note 43 Categories included level 0 (management occupations), skill level A (professional positions), level B (technical jobs and skilled trades), level C (lower-skilled positions), level D (labourer positions), and not applicable (not employed in the reference week for reasons apart from temporary absence). Additional covariates included quintiles of household income, geographic region (Atlantic, Quebec, Ontario, Prairies, and British Columbia), population centre (large urban population centres with 100,000 people or more, medium populations centres with 30,000 to fewer than 100,000 people, small population centres with 1,000 to fewer than 30,000 people, and rural areas with fewer than 1,000 people), living and family arrangements (unattached individual living alone, unattached individual living with others, individual living with a spouse or partner, parent living with a spouse or partner and children, single parent living with children, or other), and immigrant status (landed immigrant or non-permanent resident, or non-immigrant).
Other variables investigated the health profile of respondents. Markers of health status included self-perceived general and mental health (poor, fair, or good vs. very good or excellent); diagnosis by a health professional for high blood pressure, diabetes, or heart disease; and number of chronic conditions (none, or one or more). Categories of body mass index (BMI)Note 44 were derived (underweight or normal weight BMI<25.0 kg/m2 vs. overweight or obese: BMI ≥25.0 kg/m2) although not in pregnant women.
Analytical techniques
Descriptive analysis provided demographic, socioeconomic, and health-status profiles of Black and White adults. Inequalities between Black and White adults in access to primary and pharmaceutical care were quantified by estimating crude and adjusted differences. Multivariate logistic regression models regressed access indicators on a three-category racialized or cultural group variable (White, Black, or other or multiple), in addition to demographic and socioeconomic covariates. Inclusion of other or multiple racialized groups provided a more comprehensive estimation of independent associations, reflecting the national reality. Predictive margins were derived from fit models to estimate absolute (risk difference (RD)) and relative (relative risk (RR)) contrasts in the adjusted probability of access conditional on observed covariates with White as the reference group.
Blinder–Oaxaca decomposition analysisNote 45,Note 46 was used to decompose differences in access to primary and pharmaceutical care between Black and White adults in Canada into “explained” and “unexplained” portions. This method employed a twofold, or pooled, approach based on the oaxaca command for Stata statistical software.Note 47 The explained portion represents the difference in outcomes attributable to group differences in levels of independent variables (termed the quantity effect). That is, it anticipates access to primary care for Black adults in the counterfactual scenario in which Black adults shared the same characteristics as White adults, as observed in the model. The unexplained portion relates to differences in the associations between predictors and outcomes between Black and White adults (that is, differences in coefficient and intercept estimates). The unexplained portionNote 48, Note 49 persists in the scenario where Black and White levels of predictors are equal and may relate to group differences in unobserved variables and sources of measurement error, and potentially reflect societal structural factors. Detailed decomposition included five categories: demographic (sex, age), socioeconomic (educational attainment, NOC skill level, household income), geographic (geographic region, population centre classification), living arrangement, and immigrant status categories. Given binary outcomes, a non-linear decomposition extensionNote 50 fit logit models. Previous health research has employed decomposition to examine racial inequalities in obesity,Note 48 health care use,Note 51 and birth outcomes,Note 52 as well as geographic variation in obesity.Note 53
As a sensitivity analysis, the Blinder–Oaxaca decomposition analysis was repeated on a subsample of working-age respondents aged 25 to 64 years because respondents aged 65 and older may have had access to different benefit structures.27 Further analysis tested whether health status modified the association between racialized or cultural group and primary and pharmaceutical care by including product terms between racialized or cultural group and health status in logistic regression models. Although health status may differ by racialized or cultural group, if it is assumed to be affected by health access outcomes, it should not be included in regression adjustment because this may bias estimation.Note 54 However, evidence for interaction may highlight analytical limitations if health status shows strong and persistent differential effects by racialized or cultural group, which are omitted from the model.
Annual CCHS files were pooled from 2015 to 2019 (2015, 2016, and 2019 for insurance outcomes) to generate a sufficient sample size for multivariate analysis of Black adults. Following recommended procedures,Note 55, Note 56 the sample weights were rescaled to account for differences in sample size across cycles. To account for the complex design of the CCHS,Note 40 bootstrap repeated replicationsNote 57 with pooling-adjusted weights were used to estimate probability and the standard error in all descriptive and analytical procedures. All analyses were performed using Stata 18.0.Note 58
Results
The pooled analytical sample included 245,375 individuals aged 25 years and older, which was reduced to 224,426 after excluding individuals with an Indigenous identity or missing responses to access indicators, racialized or cultural group, or demographic or socioeconomic covariates (4%). Overall, 79% of people in the sample were White (n=199,804), 2.7% were Black (n=3,255), and 18.5% were from other or multiple racialized or cultural groups (n=21,367). For the sensitivity analysis, the sample with complete health indicator information was reduced (n=187,573).
Table 1 provides a demographic and socioeconomic profile of Black and White adults aged 25 years and older from 2015 to 2019. Compared with White adults, Black adults tended to be younger, more educated, and more likely to be employed during the reference week. However, Black adults were more likely to work in lower-skilled occupations and tended to have lower household income. Over half of Black adults (52%) lived in Ontario and over one-quarter (28%) lived in Quebec, with more than 9 in 10 (92%) living in large urban population centres—38 percentage points more than White adults. Over four in five Black adults were immigrants (83%), compared with 13% of White adults. Comparisons of health status between Black and White adults in Canada are shown in Table 2, finding some notable differences between the populations. Black adults were more likely to report having diabetes and were less likely to report having heart disease or chronic conditions.
| Black adults | White adults | Difference | |||||||
|---|---|---|---|---|---|---|---|---|---|
| Percentage | 95% confidence interval | Percentage | 95% confidence interval | Percentage | 95% confidence interval | ||||
| from | to | from | to | from | to | ||||
|
|||||||||
| Sex | |||||||||
| Male | 48.2 | 45.5 | 50.9 | 48.8 | 48.5 | 49.0 | -0.6 | -3.3 | 2.2 |
| Female | 51.8 | 49.1 | 54.5 | 51.2 | 51.0 | 51.5 | 0.6 | -2.2 | 3.3 |
| Age | |||||||||
| 25 to 34 years | 27.4 | 24.9 | 30.0 | 17.8 | 17.6 | 18.1 | 9.5 | 7.0 | 12.1 |
| 35 to 44 years | 28.4 | 26.0 | 30.9 | 16.4 | 16.2 | 16.6 | 12.0 | 9.5 | 14.5 |
| 45 to 54 years | 20.9 | 18.6 | 23.5 | 18.6 | 18.2 | 18.9 | 2.4 | -0.1 | 4.8 |
| 55 to 64 years | 10.7 | 9.2 | 12.5 | 21.3 | 21.1 | 21.6 | -10.6 | -12.2 | -8.9 |
| 65 to 74 years | 8.2 | 6.8 | 9.7 | 15.7 | 15.5 | 15.8 | -7.5 | -9.0 | -6.0 |
| 75 years and older | 4.4 | 3.6 | 5.5 | 10.3 | 10.1 | 10.4 | -5.8 | -6.8 | -4.9 |
| Educational attainment | |||||||||
| Less than a bachelor's degree | 69.0 | 66.6 | 71.4 | 73.7 | 73.3 | 74.1 | -4.7 | -7.1 | -2.2 |
| Bachelor's degree or higher | 31.0 | 28.6 | 33.4 | 26.3 | 25.9 | 26.7 | 4.7 | 2.2 | 7.1 |
| National Occupational Classification skill level | |||||||||
| Not employed | 30.1 | 27.7 | 32.6 | 38.3 | 38.0 | 38.7 | -8.3 | -10.7 | -5.8 |
| Management occupations | 2.5 | 1.9 | 3.4 | 6.9 | 6.7 | 7.1 | -4.4 | -5.1 | -3.6 |
| Skill level A | 15.3 | 13.5 | 17.4 | 14.9 | 14.6 | 15.2 | 0.4 | -1.5 | 2.4 |
| Skill level B | 20.5 | 18.5 | 22.8 | 22.2 | 21.9 | 22.5 | -1.6 | -3.8 | 0.5 |
| Skill level C | 23.7 | 21.4 | 26.2 | 13.8 | 13.5 | 14.1 | 9.9 | 7.4 | 12.3 |
| Skill level D | 7.8 | 6.4 | 9.6 | 3.9 | 3.7 | 4.0 | 3.9 | 2.3 | 5.5 |
| Household income | |||||||||
| Quintile 1 (lowest) | 35.6 | 32.6 | 38.6 | 15.2 | 14.8 | 15.5 | 20.4 | 17.4 | 23.4 |
| Quintile 2 | 24.2 | 21.9 | 26.6 | 18.9 | 18.6 | 19.2 | 5.3 | 2.9 | 7.7 |
| Quintile 3 | 19.0 | 16.8 | 21.4 | 20.5 | 20.2 | 20.8 | -1.6 | -3.8 | 0.7 |
| Quintile 4 | 13.5 | 11.7 | 15.4 | 21.9 | 21.5 | 22.2 | -8.4 | -10.3 | -6.6 |
| Quintile 5 (highest) | 7.8 | 6.6 | 9.2 | 23.6 | 23.2 | 23.9 | -15.7 | -17.1 | -14.4 |
| Geographic region | |||||||||
| Atlantic | 1.8 | 1.4 | 2.4 | 8.2 | 8.1 | 8.3 | -6.3 | -6.9 | -5.8 |
| Quebec | 27.7 | 25.1 | 30.5 | 26.9 | 26.7 | 27.2 | 0.8 | -1.9 | 3.5 |
| Ontario | 52.1 | 48.9 | 55.3 | 35.2 | 34.9 | 35.5 | 16.9 | 13.7 | 20.2 |
| Prairies | 15.4 | 13.6 | 17.3 | 17.7 | 17.5 | 17.9 | -2.4 | -4.2 | -0.5 |
| British Columbia | 3.0 | 2.4 | 3.8 | 12.0 | 11.8 | 12.2 | -9.0 | -9.8 | -8.3 |
| Population centre classification | |||||||||
| Rural area | 2.5 | 1.9 | 3.3 | 21.6 | 21.0 | 22.2 | -19.1 | -19.9 | -18.2 |
| Small population centre | 2.6 | 2.1 | 3.3 | 14.5 | 14.0 | 15.0 | -11.9 | -12.6 | -11.2 |
| Medium population centre | 3.3 | 2.7 | 3.9 | 10.5 | 10.1 | 10.9 | -7.2 | -7.9 | -6.5 |
| Large urban population centre | 91.6 | 90.4 | 92.6 | 53.4 | 52.8 | 54.0 | 38.2 | 37.0 | 39.4 |
| Living arrangement | |||||||||
| Unattached individual living alone | 17.3 | 15.5 | 19.3 | 18.9 | 18.3 | 19.7 | -1.6 | -3.3 | 0.0 |
| Unattached individual living with others | 6.9 | 5.7 | 8.3 | 3.7 | 3.5 | 3.9 | 3.2 | 1.9 | 4.4 |
| Individual living with a spouse or partner | 11.5 | 10.1 | 13.1 | 35.6 | 35.2 | 35.9 | -24.1 | -25.6 | -22.6 |
| Parent living with a spouse or partner and children | 32.2 | 29.7 | 34.7 | 28.3 | 27.7 | 28.9 | 3.9 | 1.3 | 6.4 |
| Single parent living with children | 14.9 | 12.9 | 17.0 | 4.8 | 4.7 | 5.0 | 10.0 | 8.0 | 12.1 |
| Other living arrangement | 17.3 | 14.8 | 20.2 | 8.6 | 8.3 | 9.0 | 8.7 | 6.1 | 11.3 |
| Immigrant status | |||||||||
| Immigrant | 83.4 | 81.4 | 85.3 | 13.4 | 13.1 | 13.7 | 70.0 | 68.0 | 72.0 |
| Non-immigrant | 16.6 | 14.7 | 18.6 | 86.6 | 86.3 | 86.9 | -70.0 | -72.0 | -68.0 |
| Black adults | White adults | Difference | |||||||
|---|---|---|---|---|---|---|---|---|---|
| Percentage | 95% confidence interval | Percentage | 95% confidence interval | Percentage | 95% confidence interval | ||||
| from | to | from | to | from | to | ||||
|
|||||||||
| Self-perceived health | |||||||||
| Poor | 1.8 E use with caution | 1.3 | 2.6 | 2.8 | 2.7 | 2.9 | -1.0 | -1.6 | -0.3 |
| Fair | 8.3 | 6.9 | 10.1 | 8.1 | 7.9 | 8.3 | 0.2 | -1.4 | 1.8 |
| Good | 27.8 | 25.4 | 30.4 | 27.4 | 27.0 | 27.7 | 0.5 | -2.1 | 3.0 |
| Very good | 32.3 | 29.6 | 35.1 | 38.3 | 37.9 | 38.6 | -6.0 | -8.7 | -3.2 |
| Excellent | 29.7 | 27.0 | 32.6 | 23.5 | 23.1 | 23.8 | 6.3 | 3.4 | 9.1 |
| Self-perceived mental health | |||||||||
| Poor | 1.2 E use with caution | 0.8 | 1.9 | 1.3 | 1.2 | 1.4 | -0.1 | -0.6 | 0.4 |
| Fair | 4.6 | 3.5 | 6.0 | 5.3 | 5.2 | 5.5 | -0.7 | -2.0 | 0.5 |
| Good | 19.7 | 17.6 | 22.0 | 22.4 | 22.1 | 22.7 | -2.7 | -4.9 | -0.5 |
| Very good | 33.5 | 30.6 | 36.6 | 38.1 | 37.7 | 38.5 | -4.6 | -7.6 | -1.6 |
| Excellent | 40.9 | 38.1 | 43.8 | 32.9 | 32.5 | 33.2 | 8.1 | 5.2 | 10.9 |
| Has diabetes | |||||||||
| No | 89.2 | 87.3 | 90.9 | 92.1 | 91.9 | 92.3 | -2.9 | -4.7 | -1.0 |
| Yes | 10.8 | 9.1 | 12.7 | 7.9 | 7.7 | 8.1 | 2.9 | 1.0 | 4.7 |
| Has high blood pressure | |||||||||
| No | 80.0 | 77.4 | 82.3 | 79.1 | 78.8 | 79.4 | 0.9 | -1.6 | 3.3 |
| Yes | 20.0 | 17.7 | 22.6 | 20.9 | 20.6 | 21.2 | -0.9 | -3.3 | 1.6 |
| Has heart disease | |||||||||
| No | 98.3 | 97.5 | 98.9 | 94.5 | 94.3 | 94.6 | 3.9 | 3.2 | 4.5 |
| Yes | 1.7 E use with caution | 1.1 | 2.5 | 5.5 | 5.4 | 5.7 | -3.9 | -4.5 | -3.2 |
| Number of chronic conditions | |||||||||
| None | 62.7 | 59.8 | 65.5 | 48.8 | 48.4 | 49.2 | 13.9 | 11.1 | 16.8 |
| One | 21.5 | 19.2 | 23.9 | 27.6 | 27.3 | 27.9 | -6.1 | -8.5 | -3.8 |
| Two | 10.3 | 8.7 | 12.3 | 14.5 | 14.2 | 14.7 | -4.1 | -5.9 | -2.3 |
| Three or more | 5.5 | 4.4 | 6.9 | 9.2 | 9.0 | 9.4 | -3.7 | -4.9 | -2.4 |
| Body mass index category | |||||||||
| Normal weight or underweight | 28.8 | 26.3 | 31.4 | 32.3 | 32.0 | 32.7 | -3.5 | -6.1 | -1.0 |
| Overweight | 41.2 | 38.4 | 44.0 | 37.3 | 36.9 | 37.7 | 3.9 | 1.1 | 6.7 |
| Obese | 30.0 | 27.4 | 32.7 | 30.3 | 30.0 | 30.7 | -0.4 | -3.1 | 2.3 |
Nearly 9 in 10 White adults (87%) and about three-quarters of Black adults (76%) had a regular health care provider. While about 9 in 10 Black and White adults had a usual place to go for care of a minor problem, about three-fifths of White adults (58%)—compared with less than half of Black adults (48%)—would go to a doctor’s office for this care (Chart 1). Table 3 presents crude and adjusted differences between Black and White adults’ access to primary and pharmaceutical care. Black adults had about a 10 percentage-point lower prevalence of having a regular health care provider, visiting a doctor’s office for care of a minor problem, and having insurance for prescription medicine. Following adjustment for demographic and socioeconomic covariates, Black adults were 1.9 percentage-points (95% confidence interval [CI]=0.0 to 3.7) less likely than White adults to report having a regular health care provider and 5.8 percentage-points (95% CI=2.9 to 8.7) less likely to report visiting a doctor’s office for immediate care of a minor problem.
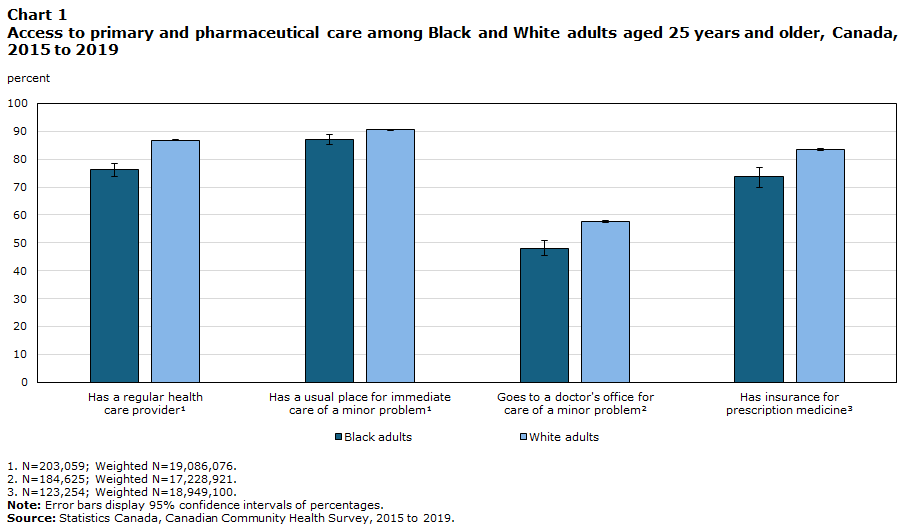
Description of Chart 1
| Black adults | White adults | |||||
|---|---|---|---|---|---|---|
| percent | 95% confidence interval | percent | 95% confidence interval | |||
| from | to | from | to | |||
| Has a regular health care providerData table for Chart 1 Note 1 | 76.2 | 73.8 | 78.4 | 86.8 | 86.6 | 87.1 |
| Has a usual place for immediate care of a minor problemData table for Chart 1 Note 1 | 87.1 | 85.3 | 88.8 | 90.6 | 90.3 | 90.8 |
| Goes to a doctor's office for care of minor problemData table for Chart 1 Note 2 | 48.1 | 45.3 | 50.9 | 57.6 | 57.2 | 58.0 |
| Has insurance for prescription medicineData table for Chart 1 Note 3 | 73.6 | 69.7 | 77.2 | 83.3 | 83.0 | 83.7 |
Source: Statistics Canada, Canadian Community Health Survey, 2015 to 2019. |
||||||
| Crude association | Adjusted association | |||||||||||
|---|---|---|---|---|---|---|---|---|---|---|---|---|
| Risk difference | 95% confidence interval | Risk ratio | 95% confidence interval | Risk difference | 95% confidence interval | Risk ratio | 95% confidence interval | |||||
| from | to | from | to | from | to | from | to | |||||
Source: Statistics Canada, Canadian Community Health Survey, 2015 to 2019. |
||||||||||||
| Has a regular health care provider Table 3 Note 1 | -0.107 | -0.130 | -0.083 | 0.877 | 0.850 | 0.904 | -0.019 | -0.037 | 0.000 | 0.978 | 0.957 | 0.999 |
| Has a usual place for immediate care of a minor problem Table 3 Note 1 | -0.034 | -0.052 | -0.017 | 0.962 | 0.943 | 0.982 | 0.005 | -0.011 | 0.020 | 1.005 | 0.988 | 1.023 |
| Goes to a doctor's office for care of a minor problem Table 3 Note 2 | -0.096 | -0.124 | -0.067 | 0.834 | 0.785 | 0.883 | -0.058 | -0.087 | -0.029 | 0.900 | 0.851 | 0.949 |
| Has insurance for prescription medicine Table 3 Note 3 | -0.097 | -0.135 | -0.059 | 0.883 | 0.838 | 0.929 | -0.020 | -0.050 | 0.009 | 0.975 | 0.940 | 1.011 |
Table 4 shows the predicted probabilities, differences, and decomposition of differences between Black and White adults in access to primary and pharmaceutical care. The portion of the difference in access between Black and White adults explained in the counterfactual scenario where Black adults shared the same levels of measured covariates as White adults differed between outcomes. Out of the 10.7 percentage-point difference in having a regular health care provider, about 77% was explained by covariates in the model, primarily through equalizing population differences in demographic characteristics (3.9 percentage-points) and immigrant status (3.6 percentage-points). By contrast, approximately 68% of the difference between Black and White adults in going to a doctor’s office for care of a minor problem was unexplained by the covariates in the model. About 73% of the 9.7 percentage-point difference in having insurance for prescription medicine was explained by model covariates—largely immigrant status (3.9 percentage-points) and socioeconomic status (3.5 percentage-points). The estimated percent difference that was explained for having a usual place for care of a minor problem (3.9 percentage-points) was slightly larger than the measured difference (3.4 percentage-points), implying that in the counterfactual scenario, Black adults would have higher levels of access for this outcome than White adults.
| Racialized or cultural group or explanatory predictors | Has a regular health care provider Table 4 Note 1 | Has a usual place for immediate care of a minor problem Table 4 Note 1 | Goes to a doctor's office for care of a minor problem Table 4 Note 2 | Has insurance for prescription medicine Table 4 Note 3 | ||||||||
|---|---|---|---|---|---|---|---|---|---|---|---|---|
| Estimate | 95% confidence interval | Estimate | 95% confidence interval | Estimate | 95% confidence interval | Estimate | 95% confidence interval | |||||
| from | to | from | to | from | to | from | to | |||||
Source: Statistics Canada, Canadian Community Health Survey, 2015 to 2019. |
||||||||||||
| Predicted probability | ||||||||||||
| White adults | 0.868 | 0.866 | 0.871 | 0.906 | 0.903 | 0.908 | 0.576 | 0.572 | 0.580 | 0.833 | 0.830 | 0.837 |
| Black adults | 0.762 | 0.738 | 0.785 | 0.871 | 0.854 | 0.889 | 0.481 | 0.453 | 0.509 | 0.736 | 0.699 | 0.773 |
| Difference between Black and White adults | 0.107 | 0.083 | 0.130 | 0.034 | 0.017 | 0.052 | 0.096 | 0.067 | 0.124 | 0.097 | 0.059 | 0.135 |
| Percentage difference explained | 0.082 | 0.069 | 0.095 | 0.039 | 0.029 | 0.048 | 0.030 | 0.017 | 0.044 | 0.071 | 0.056 | 0.086 |
| Percentage difference unexplained | 0.024 | 0.001 | 0.048 | -0.004 | -0.025 | 0.017 | 0.065 | 0.037 | 0.094 | 0.026 | -0.008 | 0.060 |
| Decomposition of explained difference | ||||||||||||
| Demographic | 0.039 | 0.034 | 0.045 | 0.012 | 0.009 | 0.015 | 0.028 | 0.023 | 0.033 | 0.007 | 0.003 | 0.010 |
| Socioeconomic | 0.015 | 0.012 | 0.018 | 0.009 | 0.006 | 0.012 | 0.017 | 0.013 | 0.021 | 0.035 | 0.028 | 0.042 |
| Geographic | -0.008 | -0.012 | -0.003 | -0.002 | -0.005 | 0.002 | -0.024 | -0.031 | -0.016 | -0.016 | -0.021 | -0.011 |
| Living arrangement | -0.001 | -0.004 | 0.002 | -0.003 | -0.005 | 0.000 | 0.007 | 0.004 | 0.011 | 0.007 | 0.002 | 0.011 |
| Immigrant status | 0.036 | 0.028 | 0.044 | 0.022 | 0.015 | 0.029 | 0.001 | -0.008 | 0.010 | 0.039 | 0.029 | 0.048 |
Appendix Table 1 reproduces the decomposition analysis on a subset of working-age Canadians aged 25 to 64 years, showing generally comparable results. Further sensitivity analysis determining whether health status moderated associations between racialized or cultural group and care access revealed predominantly non-significant interaction terms between racialized or cultural group and health status (Appendix Table 2).
Discussion
While recent Canadian studiesNote 6, Note 7 have reported differential hospitalization, diagnosis, and mortality between Black and White adults in Canada, less is known about access to health care. Unequal access to primary care may contribute to inequalities in health, preventive care, chronic disease management, and hospitalizations,Note 7, Note 17, Note 18, Note 24, Note 26 while unequal access to insurance for prescription medicine may contribute to treatment non-adherence and difficulties in treatment and management of conditions.Note 28, Note 29, Note 30 This study establishes that indicators of primary care access—including having a regular health care provider, having a usual place for care of a minor problem, and going to a doctor’s office for care of a minor problem, in addition to having insurance for prescription medicine—were significantly lower for Black adults aged 25 and older, compared with White adults in the same age group, from 2015 to 2019. Consistent with findings from earlier periods,Note 32, Note 33 conventional regression-based approaches controlling for demographic and socioeconomic factors accounted for much or all of the observed differences.
To estimate the contributions of specific factors to inequalities in access between Black and White adults more comprehensively, this study incorporated Blinder–Oaxaca decomposition analysis. Results suggested that if Black adults in Canada shared the same levels of observed covariates as White adults, the reported differential would decrease by about three-quarters for having a regular health care provider and having insurance for prescription medication (77% and 73%, respectively) but by one-third (32%) for going to a doctor’s office for care of a minor problem.
Detailed decomposition showed how specific predictors contributed to the explained portion of the inequality. Differences in demographic (sex and age) characteristics were notable contributors to the explained difference in primary care access. Advanced age may increase the likelihood of seeking care, given higher perceived health needs, and also influence the type of care received. It is worth noting that the study sample had a higher proportion of younger adults aged 25–54 among Black adults (approximately 77%) compared with White adults (approximately 53%). For instance, attendees of walk-in clinics are younger and tend to use care outside regular working hours,Note 59, Note 60 suggesting work-related commitments. Furthermore, immigrant status explained approximately one-third of the differences in reported access to a regular health care provider, and this is supported by a large number of studies noting barriers (e.g., knowledge, linguistic, cultural) to accessing health care by immigrant populations in Canada.Note 15, Note 32, Note 33, Note 61 Additionally, Black adults in this sample were substantially more likely to be immigrants (83.4%) compared with White adults (13.4%). Decomposition showed that geographic factors contributed to higher access among Black adults compared with White adults, possibly relating to high representation of Black adults in provinces such as OntarioNote 14 and in urban areasNote 62 with comparatively higher availability of primary care providers.
Inequalities in access to insurance for prescription medicine were more likely to be driven by socioeconomic factors and immigrant status. Results suggest that improving or equalizing socioeconomic factors, including educational attainment, NOC skill level, and household income, would reduce inequality regarding insurance for prescription medicine by over one-third (36%). It is likely that socioeconomic factors were more important drivers of inequality for insurance because of mixed public-private coverage,Note 13 where insurance is largely provided through employers and insurance coverage follows an income gradient.Note 28, Note 30
Some Canadians with or without a regular doctor may obtain care for minor issues from locations outside a doctor’s office. Walk-in clinics, emergency rooms, and similar institutions may offer solutions for patients experiencing temporal and geographic barriers to care.Note 59, Note 60 Although these options provide an accessible source of primary care, routinely seeking care from sources other than a regular care provider may lead to relational and informational discontinuities of care and, potentially, worse health.Note 59 That is, these options may lack the benefits typically attributed to primary care, such as long-standing relationships with providers, consistent record-keeping on individuals’ medical histories, and coordination of patient care with other providers.Note 11, Note 25 Notably, going to a doctor’s office for care of a minor problem was the only access measure where measured covariates explained less than half of the difference (32%).
In decomposition analysis, unexplained portions relate to differences in the effects of covariates and the inequality that would remain if covariates were at equal levels between groups.Note 48, Note 49 In this study, about one-quarter of the gap between Black and White adults in having a regular health care provider (23%) and having prescription drug insurance (27%) and over two-thirds (68%) of the gap in going to a doctor’s office for care of a minor problem were unexplained by differences in levels of covariates. The unexplained portion suggests that even when Black and White adults share similar observed socioeconomic and demographic profiles, factors such as unmeasured biological, cultural, and structural factors, in addition to measurement error may play a role.Note 48 Examples of unobserved variables may include transportation, work schedule flexibility, and cultural attitudes or perceptions around care.Note 8 Second, measurement error may arise where there are differences in what a covariate measures, depending on racialized or cultural identity. For instance, use of the population centre measure of urbanicity may obscure intra-urban differences in proximity to primary careNote 63 that may disadvantage Black adults.
Societal structural barriers such as discrimination may reduce access to primary and pharmaceutical care among racialized or cultural groups after equalizing covariates.Note 37, Note 38 The 2024 Survey on Health Care Access and Experiences – Primary and Specialist Care found that 5.4% of Black adults who had consulted a health professional for non-urgent primary or specialist care in the past year reported an experience of discrimination based on race. Experiencing discrimination may reduce patient contact with primary care providers, in addition to impacting trust, satisfaction with care received, and treatment adherence.Note 33, Note 39
Some limitations of this study are worth noting. First, the conclusions of this study may be sensitive to unmeasured variables, which may help account for inequality in access between Black and White adults. Notably, statistical models did not adjust for health status, assuming that it would be affected by access, although health may also be independently affected by racialized or cultural group. Sensitivity analysis found only minor evidence of statistical interaction, suggesting that omitting health status would not lead to an imbalance in unmeasured predictors expanding the unexplained portion of the inequality. Further, though continuity of care may have greater relevance for long-term patient health and mortality,Note 17, Note 18, Note 19,Note 24, Note 25, Note 26 information specifically describing patient attachment and continuity was not available from the CCHS. In this study, continuity of care may be partly inferred through going to a doctor’s office for care of a minor problem. A limitation specific to pooled Blinder–Oaxaca decomposition was that measured covariates may systemically overstate the explained portion of the difference, although the racialized or cultural group indicator was included as an additional control variable to ameliorate this.Note 49
Conclusions
Results from this study suggest that demographics, socioeconomic status, geography, and immigrant status explained a substantial share of inequalities between Black and White adults in access to care, though the extent of explanation varied across outcomes. Unexplained differences may reflect unmeasured barriers relating to work schedule flexibility, health system navigation, cultural preferences, and societal structural barriers. These findings may provide insights into efforts to develop more targeted and inclusive interventions for improving equitable access to primary and pharmaceutical care in Canada. Further research may explore the multidimensional and interrelated relationships between health and access to primary care across racialized groups in Canada and explore continuity of care within these populations.
Acknowledgment
We are grateful for the support of Md Kamrul Islam who provided analysis of the Survey of Health Care Access and Experiences - Primary and Specialist Care.
| Racialized or cultural group or explanatory predictors | Has a regular health care provider Appendix Table 1 Note 1 | Has a usual place for immediate care of a minor problem Appendix Table 1 Note 1 | Goes to a doctor's office for care of a minor problem Appendix Table 1 Note 2 | Has insurance for prescription medicine Appendix Table 1 Note 3 | ||||||||
|---|---|---|---|---|---|---|---|---|---|---|---|---|
| Estimate | 95% confidence interval | Estimate | 95% confidence interval | Estimate | 95% confidence interval | Estimate | 95% confidence interval | |||||
| from | to | from | to | from | to | from | to | |||||
Source: Statistics Canada, Canadian Community Health Survey, 2015 to 2019. |
||||||||||||
| Predicted probability | ||||||||||||
| White adults | 0.843 | 0.839 | 0.846 | 0.900 | 0.897 | 0.902 | 0.551 | 0.546 | 0.555 | 0.841 | 0.837 | 0.846 |
| Black adults | 0.735 | 0.709 | 0.761 | 0.867 | 0.847 | 0.887 | 0.453 | 0.423 | 0.484 | 0.726 | 0.684 | 0.767 |
| Difference between Black and White adults | 0.108 | 0.081 | 0.134 | 0.033 | 0.013 | 0.053 | 0.098 | 0.067 | 0.128 | 0.116 | 0.073 | 0.158 |
| Percentage difference explained | 0.080 | 0.065 | 0.095 | 0.041 | 0.029 | 0.053 | 0.033 | 0.017 | 0.050 | 0.095 | 0.075 | 0.114 |
| Percentage difference unexplained | 0.028 | 0.001 | 0.055 | -0.008 | -0.033 | 0.016 | 0.064 | 0.032 | 0.097 | 0.021 | -0.017 | 0.058 |
| Decomposition of explained difference | ||||||||||||
| Demographic | 0.022 | 0.017 | 0.028 | 0.007 | 0.004 | 0.010 | 0.015 | 0.010 | 0.020 | 0.002 | -0.001 | 0.005 |
| Socioeconomic | 0.019 | 0.015 | 0.023 | 0.011 | 0.008 | 0.015 | 0.021 | 0.016 | 0.026 | 0.050 | 0.041 | 0.059 |
| Geographic | -0.007 | -0.013 | -0.001 | -0.001 | -0.005 | 0.002 | -0.021 | -0.030 | -0.013 | -0.018 | -0.024 | -0.011 |
| Living arrangement | 0.000 | -0.003 | 0.004 | -0.002 | -0.005 | 0.001 | 0.007 | 0.003 | 0.011 | 0.011 | 0.006 | 0.016 |
| Immigrant status | 0.045 | 0.035 | 0.055 | 0.026 | 0.017 | 0.035 | 0.012 | 0.000 | 0.024 | 0.050 | 0.036 | 0.063 |
| Has a regular health care provider Appendix Table 2 Note 1 | Has a usual place for immediate care of a minor problem Appendix Table 2 Note 1 | Goes to a doctor's office for care of a minor problem Appendix Table 2 Note 2 | Has insurance for prescription medicine Appendix Table 2 Note 3 | |||||
|---|---|---|---|---|---|---|---|---|
| Coefficient | p-value | Coefficient | p-value | Coefficient | p-value | Coefficient | p-value | |
Source: Statistics Canada, Canadian Community Health Survey, 2015 to 2019. |
||||||||
| Self-rated health (good, fair, or poor) | 0.167 | 0.259 | 0.188 | 0.367 | 0.009 | 0.947 | 0.101 | 0.588 |
| Self-rated mental health (good, fair, or poor) | 0.282 | 0.073 | 0.404 | 0.032 | 0.184 | 0.184 | 0.255 | 0.220 |
| Diabetes | 0.332 | 0.343 | 0.133 | 0.694 | 0.101 | 0.622 | 0.040 | 0.912 |
| High blood pressure | 0.317 | 0.141 | -0.079 | 0.747 | 0.167 | 0.239 | 0.088 | 0.700 |
| Heart disease | -1.126 | 0.091 | 1.481 | 0.025 | 0.427 | 0.401 | 0.246 | 0.722 |
| One or more chronic conditions | 0.174 | 0.263 | 0.253 | 0.187 | 0.140 | 0.267 | 0.323 | 0.109 |
| Overweight or obese | 0.130 | 0.394 | -0.049 | 0.791 | 0.309 | 0.026 | 0.175 | 0.398 |
- Date modified: