
Health Reports
Canadian Active Living Environments 2.0: Development of an open-source pipeline for the replication and extension of the Canadian Active Living Environments measure
 ,
Search for Statistics Canada publications by Meisam Ghasedi,
Meisam Ghasedi, ORCID for Meisam Ghasedi
, Gorham Achot, and
Search for Statistics Canada publications by Nancy A. Ross,
Nancy A. Ross, ORCID for Nancy A. Ross
,
Search for Statistics Canada publications by Meisam Ghasedi,
Meisam Ghasedi, ORCID for Meisam Ghasedi
, Gorham Achot, and
Search for Statistics Canada publications by Nancy A. Ross,
Nancy A. Ross, ORCID for Nancy A. Ross

DOI: https://www.doi.org/10.25318/82-003-x202600600001-eng
Abstract
Background
The Canadian Active Living Environments (Can-ALE) project was developed in 2019 to provide a standardized, pan-Canadian indicator of how supportive neighbourhood built environments are for physical activity and active transportation, enabling comparisons across places and over time. Can-ALE 1.0 produced measures for the 2006 and 2016 census years, but it did not include 2011 or 2021. As well, the data and processing steps were not packaged in a fully reproducible format, limiting longitudinal analyses and replication. In this study, the original measure was replicated and extended by developing Can-ALE 2.0, an open-source, reproducible R-based workflow to generate Can-ALE metrics for the 2011, 2016, and 2021 census years.
Data and methods
Can-ALE 2.0 was calculated for all Canadian dissemination areas (DAs) using four key measures: weighted dwelling density, transit stop counts, street intersection density (intersections where three or more streets meet), and a weighted point-of-interest measure. To better represent where residents actually live within each DA, these components were calculated using a population-weighted centroid (based on where people are concentrated) rather than the geometric centroid (the centre of the area). DAs were then classified into five ordered support categories using k-medians clustering based on the overall index.
Results
Over the decade from 2011 to 2021, the national distribution of DAs shifted toward more supportive active living environments: the proportion classified in the two least supportive categories declined, while the share in the moderate and high support categories increased. When transit stop availability was incorporated to create a transit-inclusive version of Can-ALE 2.0 (available for 2016 and 2021), the proportion of DAs classified in the highest support category increased from 6.6% to 12.2% in 2016 and from 6.0% to 10.3% in 2021, indicating that transit access meaningfully changes how neighbourhood support for active living is characterized.
Interpretation
This study developed an updated, open-source, reproducible methodology to generate Can-ALE 2.0, which extends Can-ALE coverage to 2011, 2016, and 2021 and improves geographic accuracy by using population-weighted centroids. By providing a standardized longitudinal dataset (and a transit-inclusive version for 2016 and 2021), Can-ALE 2.0 can be used in future studies to examine how changes in neighbourhood built environments relate to physical activity and health outcomes, and to inform policies and investments that aim to reduce physical inactivity, obesity, and diabetes.
Keywords
active living environments, built environment, active transportation, walking to work, open data, public health
Authors
Daniel Fuller and Meisam Ghasedi are with the Department of Community Health and Epidemiology at the University of Saskatchewan. Gorham Achot and Nancy A. Ross are with the Department of Public Health Sciences at Queen’s University.
Introduction
The way walkability is conceptualized and operationalized has evolved over time, transitioning from a utility- and infrastructure-centred view to a more comprehensive definition that includes factors such as destination accessibility, safety, and connectivity.Note 1 Walkability is measured because these neighbourhood features can influence how easily people can incorporate walking and other active modes of transportation into daily life, with implications for population health. These features are closely linked to improved public health and the creation of more vibrant and livable communities.Note 2 However, walkable environments are not a panacea: associations with health and social outcomes are not always strong or consistent and can be influenced by socioeconomic and other contextual factors. In addition, highly walkable areas can have higher exposure to traffic-related air pollution, which may offset some cardiometabolic benefits in certain contexts. As cities continue to grow, the focus on creating more walkable living environments has become more widespread. Environments that support walking and active transport provide an accessible way for individuals to maintain regular physical activity, social cohesion, and well-being.Note 3Note 4
Early research on walking focused on its utilitarian function, a means of travelling to destinations dictated by road and sidewalk infrastructure. But of course, walking can be considered as an end itself, valued as a form of leisure, recreation, and social interaction.Note 5Note 6Note 7 A broadened perspective that includes both utilitarian and leisure or pleasure walking is perhaps better encapsulated by the term “active living environment” (ALE), which has been defined as “the emergent natural, built, and social properties of neighbourhoods that promote physical activity and health and allow for equitable access to health-enhancing resources.1” In Canadian population-based studies linking Canadian Active Living Environments (Can-ALE) data with national health survey data, more supportive ALEs are associated with more walking and higher physical activity.Note 8Note 9 In turn, increased physical activity is strongly associated with favourable health outcomes such as lower obesity and incident diabetes risk.Note 10Note 11
A significant portion of the Canadian population across all ages and demographics fails to meet the Canadian 24-Hour Movement Guidelines; fewer than 1 in 10 adultsNote 12 and fewer than 1 in 5 children and youth meet all three recommendations.Note 13 Meeting the guidelines is associated with better health outcomes, improved aerobic fitness, and lower body mass index, yet most Canadians 5 years and older do not meet their weekly target of physical activity.Note 12Note 14 Because everyday walking and active transportation are key ways people accumulate physical activity, neighbourhood walkability and other built environment features can play an important role in enabling routine activity at the population level. The built environment can therefore be instrumental in supporting physical activity, particularly in supporting routine types of daily activity that influence a large proportion of the population.Note 4Note 15
Can-ALE 1.0 was developed in 2019 to allow for a nationally standardized ALE measure in Canadian cities. The measure was developed for Canadian census years 2006 and 2016.Note 2
The overall goal of this paper was to replicate and extend Can-ALE 1.0 by developing and documenting Can-ALE 2.0, an open-source and reproducible set of R scripts and processing steps that can be used to generate Can-ALE measures consistently across census years. The original Can-ALE metrics were extended and replicated by employing three approaches. First, the data and processing workflow (i.e., the code and steps used to produce the measures) for Can-ALE were redeveloped because the original point-of-interest data used to develop Can-ALE for 2006, a public file, do not stay static over time. To assess the impact of differences introduced by changes in data sources and processing methods, the 2016 data previously calculated using PostGIS and QGIS were reprocessed using the new R script-based implementation, and the results were compared for quantitative differences. Second, Can-ALE was developed for previously unavailable census years: 2011 and 2021. Completing these years means that Can-ALE is available for 2011, 2016, and 2021 and can be used for longitudinal analysis. Third, the associations between the Can-ALE measure and the commuting mode shares by walking (walk to work) and by active transportation were examined for 2011, 2016, and 2021. While active transportation is typically defined as trips made by walking, cycling, or using other emerging mobility options, this study broadens the definition to include public transit. This was done to create a more comprehensive active and sustainable transport variable that broadens the utility of the Can-ALE dataset.
Data and methods
Data collection and preparation
This study builds an open-source pipeline of the previously developed Can-ALE 1.0 measure, which was available for the 2006 and 2016 census years. The updated ALE index for 2011, 2016, and 2021 was calculated using four core measures: weighted dwelling density, transit stop counts, intersection density (three or more legs), and a weighted point of interest (POI) (Table 1). All code, original data, and Can-ALE data are provided at https://can-ale.ca.
| Measure | Definition | Data source |
|---|---|---|
| Sources: Authors’ calculations; Statistics Canada, census and Road Network File; OpenStreetMap; and General Transit Feed Specification. | ||
| Weighted dwelling density | The number of dwellings per square kilometre within a 1-kilometre circle centred on a dissemination area's population-weighted centroid | Census (Statistics Canada) |
| Transit stops | The number of available transit stops within 1 kilometre of the population-weighted centroid of the dissemination area | General Transit Feed Specification |
| Intersection density (three or more legs) |
The number of three-way-or-more intersections on roads per square kilometre calculated within a 1-kilometre buffer around the population-weighted centroid of each dissemination area, excluding roads classified as motorways (highways, freeways) or slip roads (e.g., highway entrance and exit ramps) | Road Network File (Statistics Canada) |
| Weighted points of interest |
The number of points of interest (e.g., libraries, schools, hospitals) within 1 kilometre of the population-weighted centroid of the dissemination area and weighted according to their importance and distance from this centroid | OpenStreetMap |
All measures were calculated within a 1-kilometre buffer centred on the population-weighted centroid of each dissemination area (DA), rather than the DA’s geometric centroid used in Can-ALE 1.0. This ensures that measures more accurately reflect where people actually live within standardized census boundaries. To estimate the Can-ALE measures within each buffer, a precise areal interpolation method at the dissemination block (DB) level—the smallest census geographic unit within a DA—was used. This method assumes a uniform distribution of the population across the DBs rather than the larger unit of analysis (DAs). Supplementary Appendix 1, available in online appendix on GitHub, provides definitions of DA and DB, including their role as standard geographic units used by Statistics Canada for census data dissemination.
Although all measures are ultimately summarized at the DA level, DBs were used to compute the DA population-weighted centroid and allocate population- and dwelling-based counts to the 1-kilometre DA buffer. The analysis identifies all DBs that intersect and overlap a buffer and calculates the proportion of each DB’s area that lies inside the buffer. This weighted centroid serves as the “centre of mass” of the population within the DA and was calculated by taking the weighted means of the centroids of its component DBs, using each block’s population as the weight. For DAs with zero population, the geometric centroid was used to ensure that no areas were missed.
Weighted dwelling density
Dwelling density was calculated by analyzing a 1-kilometre buffer around the population-weighted centroid of each DA, using census data obtained through the cancensus package in R.Note 16 Based on the population-weighted centroid, the dwelling counts for each DB were then proportionally allocated based on this overlap. These aggregated values were then divided by the buffer’s area to derive the final density estimates for each DA.
Transit stops
To calculate the transit stop count within each DA, transit data were downloaded for both the 2016 and 2021 census years using an automated R script from the TransitFeeds website, an open repository of publicly available General Transit Feed Specification (GTFS) files.Note 17 GTFS files provide standardized information on stop locations, routes, and schedules. TransitFeeds was selected because it offers a centralized way to access GTFS feeds from many Canadian transit agencies. However, GTFS availability and completeness vary by region and agency, and some areas have limited or no GTFS coverage, resulting in unclassified DAs in the transit-inclusive analyses. It is worth mentioning that the number of transit stops for 2011 was not available because of the lack of GTFS data in 2011. The code was developed to be able to select representative weekdays by excluding weekends, statutory holidays, and specific non-statutory holidays. The resulting transit stop locations were organized by province and transit agency, then categorized into census metropolitan areas (CMAs) or non-CMAs for subsequent analyses. This is an enhancement over Can-ALE 1.0, in that all stops located in CMAs and non-CMAs are now included. Finally, transit stop counts within each DA were calculated by counting the number of stops within the 1-kilometre buffer surrounding each DA’s population-weighted centroid.
Intersection density (three or more legs)
Intersection density metrics were generated using Statistics Canada’s road network shapefiles from 2011, 2016, and 2021. Limited-access roads (e.g., highways and freeways) were removed from each of the road files before calculating intersection density, and then an R script was developed to calculate the intersections with three or more legs, where a leg is a connecting road segment entering the intersection. To speed up the processing time and optimize the process of running the R script to calculate intersection density, provinces were subdivided into smaller 10-kilometre-by-10-kilometre tiles to optimize spatial processing. Within each tile, intersections comprising three or more road segments were identified, counted, and attributed to each DA buffer. Finally, intersection densities were aggregated and exported for each province separately.
Points of interest
OpenStreetMap (OSM) provides POIs to the Can-ALE dataset for the 2011, 2016, and 2021 census years. OSM has a wide variety of mapped features (e.g., schools, shops, parks, benches, ATMs, soccer fields) consisting of both points and polygon features.Note 18 While the incompleteness of OSM data can be a potential barrier for research purposes on specific types of features, its use is well justified in previous studies.Note 19Note 20Note 21Note 22 OSM provides valuable data on unique, small-scale environmental features, such as benches and fountains, which are traditionally difficult to map but are conceptually important for studies on active living. However, because of a lack of sufficient data in the 2006 census year, it was not considered in the Can-ALE 2.0 project for the ALE calculation index. For the 2011, 2016, and 2021 census years, in the first step, polygon-type POIs were converted into centroids to standardize data representation and joined to the point shapefile to produce a single POI shapefile. Then, POI categories not relevant to ALE variables were excluded using predefined OSM classification codes. Lastly, two types of methods were implemented to weight the POIs in the calculation process. The first weight was applied to ensure that POIs closer to a DA’s population-weighted centroid were more likely to be used by people than those farther away. This involved applying the negative exponential decay function (1.0126e-0.0013x) used by Zhao et al.,Note 23 where x represents the distance in metres up to the POIs’ thresholds of 1,000 metres. The second weighting method, implemented to increase the robustness and validity of the counted POIs, involved weighting every type of POI on a scale from 1 to 4 (1 = lower relationship with ALE behaviour; 4 = higher relationship). Supplementary Appendix 2, available in the online appendix on GitHub, provide the weighting coefficients used. The number of POIs within 1 kilometre of the population-weighted centroid was calculated using spatial intersection methods, for both weighted and unweighted POIs.
To evaluate and demonstrate Can-ALE 2.0, five analyses were conducted.
First, a comparative analysis assessed reproducibility by comparing Can-ALE 2.0 outputs with previously generated measures from the PostGIS and QGIS workflow for a shared geography and year; for computational efficiency and data completeness, this comparison was conducted in Alberta (2016).
Second, a longitudinal analysis summarized temporal patterns in the main Can-ALE component measures by comparing mean values across longitudinally comparable DAs for 2011, 2016, and 2021.
Third, an association analysis examined correlations between Can-ALE 2.0 measures and census-derived commuting indicators for 2011, 2016, and 2021. Specifically, the analysis assessed correlations with the walking-to-work mode share, defined as the proportion of employed people aged 15 years and older who primarily commute by walking, and with the active-transportation-to-work mode share, defined as the proportion of employed people aged 15 years and older with a fixed workplace address who primarily commute by walking, cycling, or using public transportation.Note 2
Fourth, DAs were classified into five ordered categories using k-medians clustering based on the overall Can-ALE measure, reflecting how supportive each area is for active living and transportation; the spatial distribution of these categories was then mapped for selected cities.
Finally, to assess how methodological choices affected classification results, confusion matrixes were used to compare DA category assignments in 2016 between the unweighted and POI-weighted versions of (a) the overall ALE class and (b) the ALE transit class (Figure 4).
Results
Comparative analysis
As shown in Figure 1, Can-ALE 1.0 and Can-ALE 2.0 estimates were largely similar for dwelling density and transit stop counts, with differences observed for intersection density and POIs.
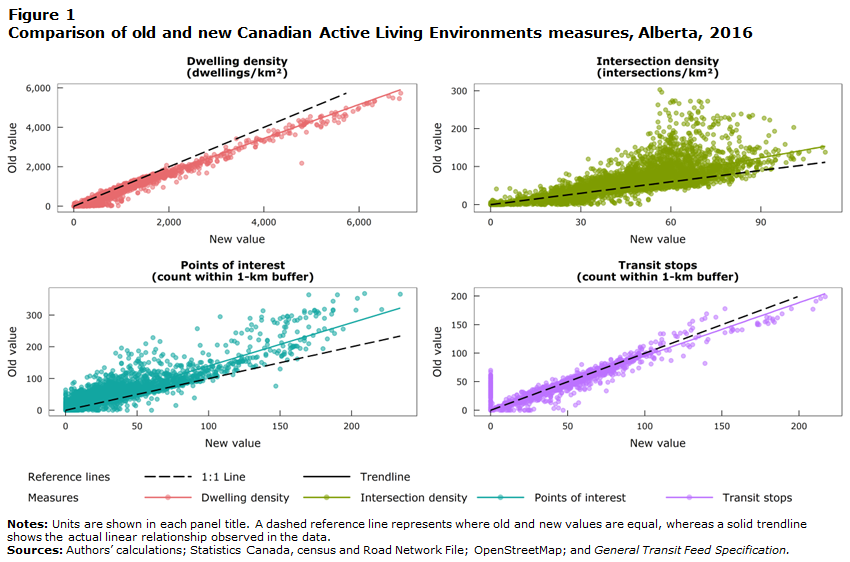
Description for Figure 1
Short text
Four-panel scatterplot comparing old and new Canadian Active Living Environments measures for dwelling density, intersection density, points of interest, and transit stops in Alberta in 2016.
Long description
The title of Figure 1 is “Comparison of old and new Canadian Active Living Environments measures, Alberta, 2016.”
The figure is a two-by-two panel of scatterplots comparing old values (vertical axis) and new values (horizontal axis). In every panel, the X-axis reads “New value” and the Y-axis reads “Old value.” Each panel includes (1) many semitransparent points (one per observation), (2) a black dashed 1:1 reference line (where old equals new), and (3) a coloured fitted trendline.
Top-left panel: Dwelling density (dwellings/km²)
The horizontal axis ranges from approximately 0 to 7,000 and the vertical axis from approximately 0 to 6,000. The points form a tight upward-sloping band near the 1:1 line, indicating strong agreement between old and new dwelling density. The cluster of points sits slightly below the 1:1 line over much of the range, suggesting the new dwelling density is often slightly higher than the old. A small number of points deviate downward from the main band at higher values.
Top-right panel: Intersection density (intersections/km²)
The horizontal axis ranges from approximately 0 to 100 and the vertical axis from approximately 0 to 300. The points form a broad upward-sloping wedge, with the densest cluster around mid-range new values. The fitted trendline lies generally above the 1:1 line, indicating that the old intersection density values are often higher than the new values for the same observations. Several points reach relatively high old values (well above 200), while new values remain below about 100.
Bottom-left panel: Points of interest (count within 1-km buffer)
The horizontal axis ranges from approximately 0 to 250 and the vertical axis from approximately 0 to 400. The scatter shows an upward trend with noticeable spread, especially as values increase. The fitted trendline is mostly above the 1:1 line, indicating the old point-of-interest (POI) counts are typically higher than the new POI counts at comparable levels. There are a few high-value points with old POI counts well above 300.
Bottom-right panel: Transit stops (count within 1-km buffer)
The horizontal axis ranges from approximately 0 to 220 and the vertical axis from approximately 0 to 220. Most points follow a strong diagonal pattern, indicating close agreement between the old and new transit stop count measures. There is also a visible vertical cluster of points near a new value close to 0, spanning a range of old values, while the remaining points increase steadily toward the upper right.
A legend below the panels identifies the 1:1 line (black dashed) and the trendline (solid), and the four measures by colour: dwelling density (pink or red), intersection density (green), points of interest (teal), and transit stops (purple).
The notes and sources below the figure read as follows:
Notes: Units are shown in each panel title. A dashed reference line represents where old and new values are equal, whereas a solid trendline shows the actual linear relationship observed in the data.
Sources: Authors’ calculations; Statistics Canada, census and Road Network File; OpenStreetMap; and General Transit Feed Specification.
While several factors may contribute to the differences between the results from the new R script and the old PostGIS and QGIS methods, the main reason is the shift from using geometric centroids to the more accurate population-weighted centroids. Transit stop counts were broadly similar between Can-ALE 1.0 (PostGIS and QGIS) and Can-ALE 2.0 (R-based) estimates. The minor differences can be attributed to the data sources used: the previous Can-ALE project used 2017 GTFS data for CMA stops only, while the current version uses 2016 data for both CMA and non-CMA stops. The higher dwelling density obtained by the new scripts is the expected outcome of using population-weighted centroids with a 1-kilometre buffer, since dwellings are, by definition, located in the most densely settled parts of a DA.
As shown in Figure 1, a larger difference is seen between the results for the intersection density measure obtained from the new R-developed script and those from the previous method using PostGIS and QGIS. While minor differences are expected from using population-weighted centroids and the Statistics Canada road network in the new method, instead of OSM data, the notable differences observed in some DAs likely stem from duplicate nodes or edges introduced during multiple spatial processing steps in the PostGIS method.
Regarding the POI comparison in Figure 1, there was a difference between the old and new POI counts for Alberta in 2016. Apart from the use of population-weighted centroids, these differences could be primarily related to two aspects of spatial data analysis. First, the PostGIS and QGIS workflow used in Can-ALE 1.0 leveraged geographic coordinates with geodesic buffers. These slightly enlarged the buffer size, making it approximately 1% to 3% bigger than the more accurate planar 1-kilometre buffer used in the current work. This could lead to a higher number of POIs. Second, the previous workflow relied heavily on manual operations in QGIS and PostGIS, and small differences or errors in the process, such as when merging layers, buffering, or making spatial joins, could lead to small variations and inconsistencies. These refinements make the new method more precise and generally result in lower POI counts compared with the old method. The results obtained using R-developed scripts were double-checked with ArcGIS Pro, confirming that they are aligned with the ArcGIS analysis results.
Longitudinal analysis
Understanding how built environment characteristics evolve over time is a key step to assessing the overall progress made in the active living friendliness of surrounding environments. As shown in Figure 2, private dwelling density has increased over time: the average number of dwellings per square kilometre increased from around 968 in 2011 to more than 1,054 in 2021. The average number of transit stops rose from around 26 in 2016 to more than 28 in 2021. While this indicates growth, public transit usage and service were significantly impacted by the COVID-19 pandemic in late 2020 and the effects continued in 2021, suggesting the underlying growth trend may be more substantial. It is important to note that the number of transit stops for 2011 was not available because of the lack of GTFS data.
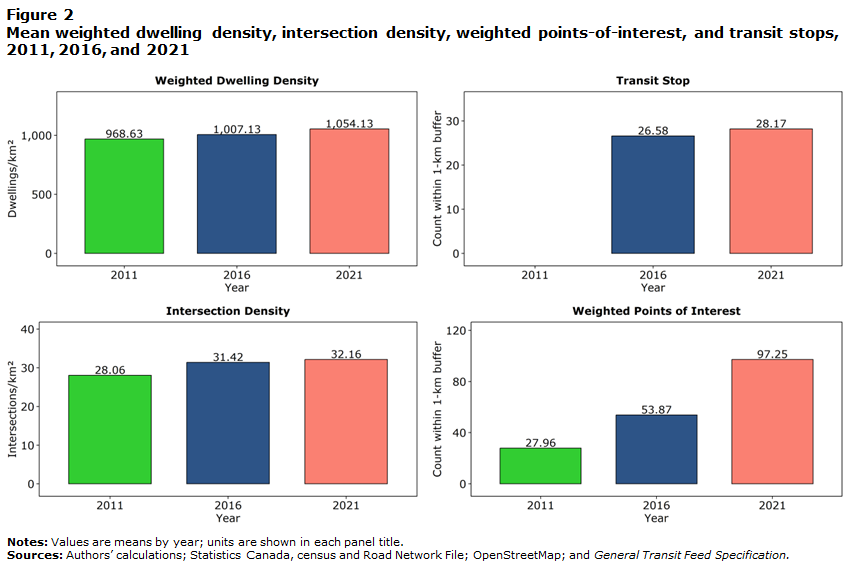
Description for Figure 2
Short text
Multi-panel bar chart showing mean weighted dwelling density, intersection density, weighted points-of-interest, and transit stops for 2011, 2016, and 2021.
Long description
The title of Figure 2 is “Mean weighted dwelling density, intersection density, weighted points-of-interest, and transit stops, 2011, 2016, and 2021.”
The figure contains four small bar-chart panels. Each panel shows mean values by year using three colours: green for 2011, blue for 2016, and red for 2021 (as indicated by the legend labelled Year). Values are printed above the bars. Units are shown in each panel title.
Top-left panel: Weighted Dwelling density (dwellings/km²)
Three bars show dwelling density increasing slightly over time: 968.63 (2011), 1,007.13 (2016), and 1,054.13 (2021).
Top-right panel: Transit stops (count within 1-km buffer)
This panel shows two visible bars: 26.58 (2016) and 28.17 (2021). A 2011 bar is not shown in this panel.
Bottom-left panel: Intersection density (intersections/km²)
Three bars show intersection density increasing over time: 28.06 (2011), 31.42 (2016), and 32.16 (2021).
Bottom-right panel: Weighted Points of interest (count within 1-km buffer)
Three bars show points of interest increasing substantially over time: 27.96 (2011), 53.87 (2016), and 97.25 (2021).
The notes and sources below the figure read as follows:
Notes: Values are means by year; units are shown in each panel title.
Sources: Authors’ calculations; Statistics Canada, census and Road Network File; OpenStreetMap; and General Transit Feed Specification.
The density of intersections with three or more legs within DAs increased steadily from 2011 to 2021, rising from about 28 to nearly 32 intersections per square kilometre. Overall, these descriptive trends indicate consistent growth in urban built environments in Canada over time, with improvements in both street network connectivity and transit availability, alongside rising dwelling density.
POIs from OSM could not be reliably analyzed longitudinally because the dataset has existed publicly for just over 10 years and is continuously evolving.Note 2 Missing POIs in earlier years do not necessarily indicate that they did not exist but rather that they were recorded later as data quality and accuracy improved. The number of POIs in the OSM dataset is growing, suggesting that data completeness is improving over time. Until OSM POIs achieve saturation nationally, they may not be a reliable source for longitudinal analysis;Note 2Note 24 nevertheless, they can be used effectively to develop the ALE index for each census year independently.
Correlation analysis
The ALE measures revealed varied and distinct levels of association with the walking-to-work and active-transportation-to-work rates (Table 2). Because Can-ALE measures the built environment around the place of residence, these correlations reflect residential exposure rather than the workplace environment or commute route. This mismatch may be smaller for walking to work, which typically occurs over shorter distances than cycling or transit commuting. While correlations with overall active transportation were consistently stronger, they remained largely stable or showed only minor changes over the decade. Conversely, associations with walking to work, though weaker, showed larger changes across census years and generally grew stronger over time. This pattern is evident for weighted dwelling density, whose correlation with walking to work increased from r = 0.35 in 2011 to r = 0.40 in 2016 and r = 0.49 in 2021, while its correlation with active transportation to work remained high and stable, with r = 0.80 in 2011, r = 0.82 in 2016, and r = 0.80 in 2021. A similar pattern was observed for POI-based measures. For weighted POIs, walking to work increased from r = 0.34 (2011) to r = 0.48 (2016) and r = 0.56 (2021), whereas active transportation to work remained relatively stable (r = 0.68 in 2011, r = 0.68 in 2016, and r = 0.70 in 2021). Because OSM POI coverage has improved over time, part of this increase may reflect changes in data completeness rather than changes in the built environment only. Conversely, the correlations for intersection density and transit stops tended to decline for active transportation while remaining stable or slightly increasing for walking. This could be caused by the transit operational challenges during the pandemic. Supplementary Appendix 3, available in the online appendix on GitHub, show summaries of active commuting rates across ALE categories.
| Measure | Correlation with walking to work rates | Correlation with active transportation to work rates | ||||
|---|---|---|---|---|---|---|
| 2011 | 2016 | 2021 | 2011 | 2016 | 2021 | |
Sources: Authors’ calculations; Statistics Canada, census and Road Network File; OpenStreetMap; and General Transit Feed Specification. |
||||||
| Dwelling density (weighted) | 0.35 | 0.4 | 0.49 | 0.80 | 0.82 | 0.80 |
| Intersection density (three or more legs) | 0.25 | 0.25 | 0.31 | 0.64 | 0.64 | 0.60 |
| Points of interest | 0.36 | 0.49 | 0.56 | 0.65 | 0.66 | 0.69 |
| Points of interest (weighted) | 0.34 | 0.48 | 0.56 | 0.68 | 0.68 | 0.70 |
| Transit stops | .. not available for a specific reference period | 0.44 | 0.47 | .. not available for a specific reference period | 0.69 | 0.66 |
Active living environment cluster groups
Table 3 presents descriptive statistics for the five k-medians cluster groups (very low to very high) based on the overall standardized ALE index score, for 2011, 2016, and 2021. K-medians clustering is a data-driven method that automatically groups areas into a set number (k) of categories based on similarity in their index values, using medians to define each group’s centre. For each year and class, it reports the number of DAs (count) and the mean, minimum, and maximum values of the overall index score. Table 3 also reports results for ALE transit, a transit-inclusive version of the index, shown separately because it is computed only for the subset of DAs with available transit stop data (2016 and 2021).
| Year/Measure/Statistic | Overall | 1 (very low) |
2 (low) |
3 (moderate) |
4 (high) |
5 (very high) |
|---|---|---|---|---|---|---|
| Note: Averages for overall active living environment (ALE) scores are effectively zero because the ALE scores are z-scored with a mean of zero.
Sources: Authors’ calculations; Statistics Canada, census and Road Network File; OpenStreetMap; and General Transit Feed Specification. |
||||||
| 2011 | ||||||
| ALE | ||||||
| Count | 56,204 | 15,051 | 12,528 | 15,481 | 9,936 | 3,208 |
| Average | 0 | -2.46 | -1.05 | 0.29 | 2.21 | 7.40 |
| Minimum | -2.61 | -2.61 | -2 | -0.82 | 0.97 | 3.14 |
| Maximum | 26.38 | -1.23 | 0.97 | 1.26 | 5.49 | 26.38 |
| 2016 | ||||||
| ALE | ||||||
| Count | 56,589 | 15,015 | 11,616 | 16,041 | 10,177 | 3,740 |
| Average | 0 | -2.46 | -1.10 | 0.32 | 1.86 | 6.87 |
| Minimum | -2.61 | -2.61 | -1.99 | -0.73 | 0.24 | 2.54 |
| Maximum | 28.66 | -1.48 | 0.28 | 2.99 | 6.12 | 28.66 |
| ALE transit | ||||||
| Count | 30,465 | 729 | 5,059 | 12,196 | 8,752 | 3,729 |
| Average | 1.35 | -3.66 | -1.84 | 0.17 | 2.30 | 8.33 |
| Minimum | -4.33 | -4.33 | -3.64 | -2.27 | -1.34 | 2.19 |
| Maximum | 32.8 | -1.35 | 1.72 | 4.74 | 7.65 | 32.80 |
| 2021 | ||||||
| ALE | ||||||
| Count | 57,932 | 15,208 | 11,764 | 16,152 | 11,334 | 3,474 |
| Average | 0 | -2.48 | -1.10 | 0.27 | 1.86 | 7.29 |
| Minimum | -2.64 | -2.64 | -2.02 | -0.77 | 0.30 | 2.49 |
| Maximum | 25.31 | -1.47 | 0.25 | 2.68 | 5.90 | 25.31 |
| ALE transit | ||||||
| Count | 33,697 | 791 | 5,964 | 13,124 | 10,344 | 3,474 |
| Average | 1.25 | -3.56 | -1.81 | 0.08 | 2.35 | 8.76 |
| Minimum | -4.22 | -4.22 | -3.55 | -2.19 | -1.27 | 1.88 |
| Maximum | 29.09 | -1.86 | 1.52 | 4.88 | 9.73 | 29.09 |
DAs in Group 1 represent the least supportive ALEs, while DAs in Group 5 represent the most supportive. Nearly half of all DAs were classified into the two lowest ALE categories. The total percentage of DAs in these groups was 49.1% in 2011, declining slightly to 47.1% in 2016 and 46.6% in 2021. This pattern suggests a slow, gradual shift toward more active-living-supportive neighbourhood environments over time, with a smaller number of DAs being categorized in the least supportive categories over the decade. Moreover, the combined share of DAs in the moderate and high categories (groups 3 and 4) went up from 45.2% in 2011 to 47.4% in 2021. Overall, these descriptive changes indicate a modest shift in the distribution of DAs toward higher support categories of active living over the decade. However, formal statistical tests of these differences were not conducted because the analysis summarizes the full set of DAs included in the study (rather than a sample), and with such large counts, even small differences would be expected to be statistically significant.
After adding transit stops to create the ALE transit index, the results for 2016 and 2021 revealed a notable decrease in the number of classifiable DAs, with 26,124 unclassified in 2016 and 24,235 in 2021. This stemmed from treating DAs with zero stops as missing for consistency between 2016 and 2021 and the limitation of the GTFS data for some DAs in 2016, as previously discussed. Among the areas that could be classified using the ALE transit index, the share of DAs in the very low support group (Group 1) dropped to just 2.4% in 2016 and 2.3% in 2021, a sharp difference from over 26% in the original ALE. DAs with moderate and high support (groups 3 and 4) comprised the majority of classified areas, at 68.8% in 2016 and 69.6% in 2021. Furthermore, the proportion of DAs in the very high support category (Group 5) increased with the incorporation of transit in both years, rising from 6.6% (ALE) to 12.2% (ALE transit) in 2016, and similarly from 6.0% (ALE) to 10.3% (ALE transit) in 2021. In contrast, comparing the ALE transit classes of 2016 and 2021, the proportion of DAs in the least supportive categories (groups 1 and 2) remained consistent at approximately 20% for both years. The most notable shift occurred at the top of the scale, where the share of DAs in the very high group (Group 5) decreased from 12.2% in 2016 to 10.3% in 2021. A potential reason for this change could be the impact of the pandemic on public transit, since the 2021 GTFS data likely reflect service reductions and schedule alterations rather than a fundamental change in the built environment.
Spatial distribution of active living environment categories in four Canadian cities
Spatial analysis of ALE categories in selected cities (Montréal, Hamilton, Calgary, and Saskatoon) exhibits similar trends in 2016 and 2021. These cities were selected to provide illustrative examples across different Canadian regions and urban contexts (large metropolitan area, mid-sized city, and smaller city) while maintaining sufficient data coverage for mapping. As shown in Figure 3, central urban areas, particularly downtown cores and densely populated residential zones, belong mostly to the high ALE categories (groups 4 and 5). Neighbourhoods at the urban periphery and rural fringes tend to belong to the lowest ALE categories (groups 1 and 2). This spatial distribution suggests an association between urban form (e.g., residential density, connectivity, and amenity availability) and Can-ALE category patterns.
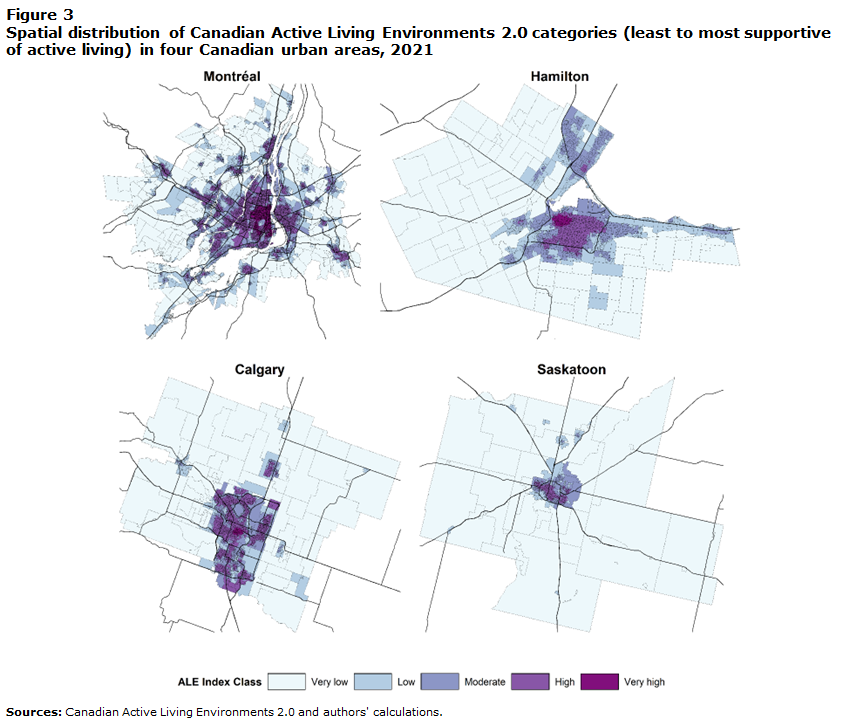
Description for Figure 3
Short text
Four city maps show the 2021 Canadian Active Living Environments 2.0 categories (from least to most supportive of active living) in Montréal, Hamilton, Calgary, and Saskatoon, with higher categories concentrated near city centres.
Long description
The title of Figure 3 is “Spatial distribution of Canadian Active Living Environments 2.0 categories (least to most supportive of active living) in four Canadian urban areas, 2021.”
The figure contains four maps, one for each city: Montréal, Hamilton, Calgary, and Saskatoon. Each map shows the entire urban area of the city. The city is divided into many smaller areas, and each area is coloured based on its Canadian Active Living Environments 2.0 category.
A legend at the bottom shows five categories, moving from least supportive to most supportive of active living: very low, low, moderate, high, and very high. Lighter colours represent lower categories, and darker purple colours represent higher categories.
Across all four cities, the darker colours (high and very high) are mostly located in the central parts of the city, especially around downtown and nearby built-up neighbourhoods. The lighter colours (very low and low) are more common toward the outer edges of the urban area. Moderate areas often appear between the centre and the outer areas.
Thin black lines show major roads to help the reader recognize the city layout.
The source below the figure reads as follows:
Sources: Canadian Active Living Environments 2.0 and authors’ calculations.
Impact of methodological changes on active living environment and active living environment transit classifications
Figure 4 summarizes how POI weighting changed ALE and ALE transit category assignments in 2016. Most DAs retained their original category assignment after POI weighting, especially in the lower-support categories, indicating relatively stable classification for the overall ALE index (Figure 4 [a]). In contrast, as can be seen in Figure 4 (b), more changes are observed in the ALE transit class confusion matrix. A greater number of DAs in classes 2 and 3 shifted toward adjacent classes after incorporating weighted POIs. This highlights that the density and relevance of POIs are more sensitive in transit-oriented environments because access to transit is directly associated with the spatial distribution and relative importance of surrounding destinations. Overall, weighting POIs resulted in moderate adjustments in the ALE index and some reclassification in the ALE transit index.
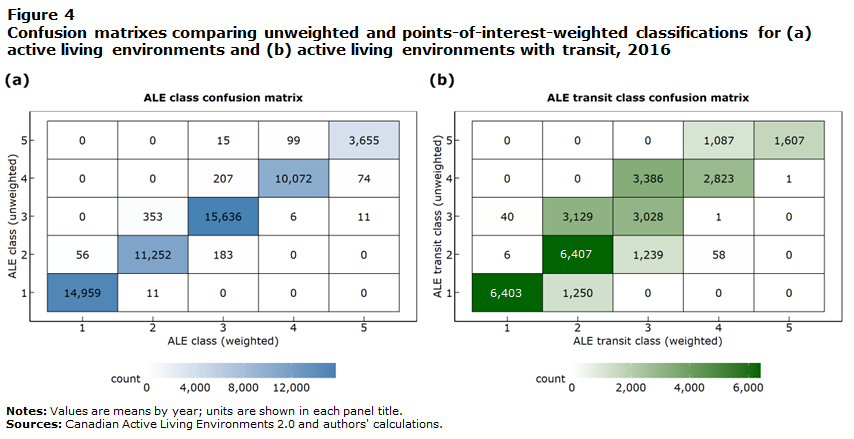
Description for Figure 4
Short text
Two confusion-matrix heatmaps (2016) comparing unweighted vs. point-of-interest-weighted category assignments for (a) active living environments (ALE) and (b) ALE transit (classes 1 to 5), with most counts on the diagonal and more off-diagonal shifts for ALE transit.
Long description
The title of Figure 4 is “Confusion matrixes comparing unweighted and point-of-interest-weighted classifications for (a) active living environments and (b) active living environments with transit, 2016.”
The figure has two panels: (a) on the left and (b) on the right. Each panel is a five-by-five confusion-matrix heatmap with the unweighted class on the vertical axis and the point-of-interest-weighted class on the horizontal axis. Both axes are labelled with classes 1 through 5. Each cell contains a count and is shaded (darker shading indicates larger counts). A colour bar labelled Count appears under each panel.
Panel (a): ALE
- Y-axis: ALE class (unweighted)
- X-axis: ALE class (weighted)
Most observations fall on the main diagonal (same class before and after weighting), with the largest diagonal counts being 14,959 (Class 1→1), 11,252 (Class 2→2), 15,636 (Class 3→3), 10,072 (Class 4→4), and 3,655 (Class 5→5).
Off-diagonal changes are comparatively small and mainly occur between adjacent classes, such as 353 (Class 3→2), 183 (Class 2→3), 207 (Class 4→3), 99 (Class 5→4), and 74 (Class 4→5). Very few observations shift by more than one class—for example, 15 (Class 5→3).
The colour bar beneath panel (a) ranges from 0 to about 12,000 (tick marks at 0, 4,000, 8,000, and 12,000).
Panel (b): ALE transit
- Y-axis: ALE transit class (unweighted)
- X-axis: ALE transit class (weighted)
Panel (b) also shows many observations on the diagonal, including 6,403 (Class 1→1), 6,407 (Class 2→2), 3,028 (Class 3→3), 2,823 (Class 4→4), and 1,607 (Class 5→5).
Compared with panel (a), panel (b) shows more off-diagonal shifts, especially between classes 2 and 3 and between classes 3 and 4. Notable adjacent-class shifts include 3,129 (Class 3→2) and 1,239 (Class 2→3), as well as 3,386 (Class 4→3) and 1,087 (Class 5→4). Additional smaller shifts include 1,250 (Class 1→2) and 58 (Class 2→4).
The colour bar beneath panel (b) ranges from 0 to about 6,000 (tick marks at 0, 2,000, 4,000, and 6,000).
The note and source below the figure read as follows:
Note: ALE = active living environment
Source: Canadian Active Living Environments 2.0 and authors’ calculations.
Discussion
The major goal of this study was to replicate and extend the previously developed Can-ALE metrics for the 2006 and 2016 census years. By developing an accessible, transparent R-based pipeline and integrating detailed built environment metrics, such as intersection connectivity, weighted dwelling density, transit stop availability, and POIs, the project enables analyses of how Canadian neighbourhoods have transformed over three distinct census periods (2011, 2016, and 2021). This replication involved re-accessing and analyzing the original project’s data and developing a new code pipeline in R to streamline the process of the calculations. It was then possible to include the previously unavailable census years (2011 and 2021) and validate longitudinal changes in built environment metrics over time. In this regard, four key measures were chosen and extracted at the DA level for this analysis, based on their relevance to the active living behaviours of people and their availability through open-source data for the three census years of 2011, 2016, and 2021. It is worth mentioning that, because of the unavailability of OSM and GTFS data for 2006, the 2006 estimates were not reanalyzed. As a result, Can-ALE 2.0 provides a methodologically consistent series for 2011, 2016, and 2021, while 2006 values from Can-ALE 1.0 should be used separately and are not directly comparable to the Can-ALE 2.0 series.
Several review studies show associations between ALEs or walkability and health outcomes.Note 25Note 26Note 27 A systematic review and meta-analysis examining longitudinal associations between built environment characteristics, including walkability, and hypertension showed that, while there were 36 longitudinal studies included in the review, the majority (64%) of studies included only measures of walkability at one time point.Note 28 This work developed and validated Can-ALE 2.0, a standardized longitudinal tool that can be linked to population health datasets to enable future studies examining how changes in ALEs relate to physical activity and health outcomes, including etiological research.
The comparative analyses and examination of the impact of methodological changes suggest that Can-ALE 2.0 can be used for longitudinal analyses, particularly using the overall ALE score (composite index) or ALE class (five-category grouping from least to most supportive). It should be noted that ALE transit scores and classes are available only for the 2016 and 2021 census years. As well, the analysis does show differences in the POI data across years. These differences are particularly evident between the 2011 and 2016 census years. While it is possible to conduct longitudinal analyses, it is recommended to use the overall ALE score or ALE class for longitudinal analysis, rather than relying on individual measures, such as POI or intersection density, which may be more sensitive to differences in input data across years. Users requiring a transit-inclusive perspective should use ALE transit (2016 and 2021 only); users requiring 2006 data should use Can-ALE 1.0 separately, as 2006 data are not directly comparable to the Can-ALE 2.0 series.
Strengths and limitations
The main strength of this study lies in the applicability of its comprehensive and open-source code using openly available data, providing widespread accessibility and reproducibility for other researchers. The development of an optimized R-based computational coding pipeline has significantly increased processing accuracy and efficiency compared with the methodology in Can-ALE 1.0. However, limitations were encountered during the data collection and analysis. Reaching back to 2006 proved unreliable for calculating POIs from OSM. Although GeofabrikNote 18 provided datasets for the earlier census years, the 2006 data were found to be largely empty. Therefore, the ALE index calculation proceeded with the 2011, 2016, and 2021 census years. There are also a few limitations related to the transit stop measure in this study. Since GTFS data were available only for 2016 and 2021, the ALE transit index could be calculated just for these two census years. Moreover, some DAs had blank or zero records for transit stops, and it was not possible to distinguish between missing data and genuine zeros (i.e., no transit stops exist) because of the unavailability of GTFS data for those specific DAs. In this regard, all zero records were treated as missing values to maintain consistency between the 2016 and 2021 census years. Finally, the GTFS data used for this study included only regular transit stops, such as those for buses, subways, and trams. They did not contain the stop locations of emerging mobility options such as bike share or e-scooter programs.
Conclusion
Can-ALE 2.0 provides an important step forward in realizing the evolution of ALE metrics across Canada, delivering the first pan‑Canadian longitudinal analysis built entirely through an open-data R pipeline that is publicly shared and reproducible. This enhanced resource opens new possibilities for researchers and policy makers to monitor and evaluate progress toward healthier, more active communities nationwide. The work was able to broadly replicate Can-ALE 1.0 and successfully extend the measures for the 2011 and 2021 census years, which were not previously available. This work enables future studies by linking Can-ALE 2.0 to cohort and population health datasets to examine associations between ALEs, changes in these environments, and health outcomes among Canadians.
- Date modified: