
Health Reports
The impacts of extreme heat events on non-accidental, cardiovascular, and respiratory mortality: An analysis of 12 Canadian cities from 2000 to 2020

DOI: https://www.doi.org/10.25318/82-003-x202400600001-eng
Abstract
Background
Extreme heat has significant impacts on mortality. In Canada, past research has analyzed the degree to which non-accidental mortality increases during single extreme heat events; however, few studies have considered multiple causes of death and the impacts of extreme heat events on mortality over longer time periods.
Data and methods
Daily death counts attributable to non-accidental, cardiovascular, and respiratory causes were retrieved for the 12 most populous cities in Canada from 2000 to 2020. Generalized additive models were applied to quantify daily mortality risks for people aged younger than 65 years and for those aged 65 years and older in each city and for each cause of death. Model results were used to calculate the change in mortality risks and the number of excess deaths attributable to extreme heat during extreme heat events.
Results
Elevated mortality risks were observed during extreme heat events in most cities for non-accidental and respiratory causes. The impacts of extreme heat on non-accidental mortality were typically greater for people aged 65 and older than for those aged younger than 65. Significantly higher non-accidental mortality risks were observed during extreme heat events for people aged 65 and older in Montréal, the city of Québec, Surrey, and Toronto. For cardiovascular and respiratory causes, people aged 65 and older had significantly higher mortality risks during extreme heat events in Montréal, and both Montréal and Toronto, respectively. In the 12 cities, approximately 670 excess non-accidental deaths, 115 excess cardiovascular deaths, and 115 excess respiratory deaths were attributable to extreme heat events during the study period. Mortality risks during extreme heat events were generally higher in cities with larger proportions of renter households and fewer extreme heat events.
Interpretation
This study estimates the longer-term impacts of extreme heat events on three mortality outcomes in a set of large Canadian cities. As climate change causes more frequent and intense extreme heat events, and as policy makers aim to reduce the health impacts of heat, it is important to understand how and where extreme heat affects health.
Keywords
Extreme heat, mortality, heatwave, temperature, climate change
Authors
Matthew Quick is with the Health Analysis Division at Statistics Canada.
What is already known on this subject?
- Extreme heat has significant impacts on mortality.
- In the Canadian context, past research has quantified the degree to which non-accidental mortality risks increase during single extreme heat events.
- As climate change causes more frequent and intense extreme heat events, it is important to understand the longer-term health impacts of extreme heat on multiple mortality outcomes.
What does this study add?
- In most cities, there were elevated non-accidental and respiratory mortality risks during extreme heat events.
- The impacts of extreme heat on mortality were typically greater for people aged 65 and older than for those aged younger than 65.
- Mortality risks during extreme heat events were higher in cities with large proportions of renter households and infrequent extreme heat events.
Introduction
Extreme heat has been shown to be associated with elevated mortality risks in Canada and a variety of international contexts.Note 1, Note 2, Note 3, Note 4, Note 5, Note 6, Note 7, Note 8 Characterized by high temperatures and high levels of humidity persisting for multiple hours or days, extreme heat events are typically defined and declared by governments and public health agencies. They are one part of heat-health warning systems that aim to raise public awareness about extreme heat and provide information and resources to reduce heat exposure.Note 9, Note 10 As extreme heat events become longer, more frequent, and more intense because of climate change,Note 11 and as both health and climate change adaptation policies aim to reduce the impacts of extreme heat,Note 12 it is increasingly important to understand where and how heat affects a variety of health outcomes, including mortality.
Exposure to extreme heat is associated with mortality through several pathways. First, endogenous or exogenous heat may overwhelm the thermoregulatory capacities of the human body and lead to heat exhaustion, heat illness, and heat stroke. Typically characterized by a combination of high body temperatures (40℃ or higher) and central nervous system dysfunction, heat stroke is a serious heat-related illness that, without rapid cooling, may lead to death.Note 13 Second, heat exposure is associated with the occurrence and exacerbation of many existing health conditions, including cardiovascular and respiratory diseases, that may increase mortality risks.Note 13, Note 14 Third, heat promotes the formation of air pollutants, such as ozone, that have been shown to be positively associated with the risk of premature death for both short- and long-term exposures.Note 15
In general, past studies exploring the impacts of extreme heat events on mortality in Canada have focused on quantifying the degree to which non-accidental deaths increase during a single event. For example, Kosatsky et al.Note 16 observed that non-accidental deaths increased by approximately 40% during a 2009 heat wave in Vancouver, British Columbia. In Quebec, Bustinza et al.Note 17 found that non-accidental mortality rates in eight health regions increased by about 33% during a five-day heatwave in 2010, but that only three regions exhibited significant increases relative to the average in the previous five years. More recently, Henderson et al.Note 18 observed a 440% increase in community deaths (i.e., not at care facilities) in Vancouver during the 2021 heat dome event, with higher risks among people aged 65 and older. To date, however, fewer studies have considered the impacts of extreme heat events on multiple causes of death and over longer periods (i.e., more than one event across one or more years), as well as how mortality risks during extreme heat events vary geographically across the country.
This study analyzes the impacts of extreme heat events on non-accidental, cardiovascular, and respiratory deaths from 2000 to 2020 in 12 of the largest cities in Canada. The first objective of this study was to quantify the degree to which the city-, cause-, and age-group-specific mortality risks were higher or lower during days classified as extreme heat events, compared with days without extreme heat events. The second objective was to estimate the number of excess deaths attributable to extreme heat events during the study period. The third objective of this study was to describe how and why the impacts of extreme heat and extreme heat events on mortality vary across this set of climatically and geographically diverse cities.
Methods
Mortality data
Daily mortality data from 2000 to 2020 were extracted from the Canadian Vital Statistics - Death database for the 12 cities with populations greater than 500,000 in the 2021 Census (from most to least populous): Toronto, Montréal, Calgary, Ottawa, Edmonton, Winnipeg, Mississauga, Vancouver, Brampton, Hamilton, Surrey, and Québec. All cities were defined using 2021 census subdivision (CSD) boundaries, except for Montréal and Québec. Montréal was defined as the Montréal CSD and all other cities and villages on the Island of Montréal (e.g., Beaconsfield, Dorval). Québec was defined as the Québec CSD, as well as the city of L’Ancienne-Lorette. Approximately 34% of the national population lived in these 12 cities, based on the 2021 Census.Note 19
Daily mortality counts were calculated for two age groups (younger than 65 years and 65 years and older)Note 20, Note 21 and three causes of death: non-accidental causes (International Classification of Diseases [ICD]-9 codes 000 to 799 and ICD-10 codes A00 to R99), cardiovascular causes (ICD-9 codes 390 to 459 and ICD-10 codes I00 to I99), and respiratory causes (ICD-9 codes 460 to 510 and ICD-10 codes J00 to J99). All analyses were restricted to the summer months: June, July, and August.Note 4, Note 22
Meteorological and air pollution data
Daily temperature and humidity data were retrieved from Environment and Climate Change Canada (ECCC) for all weather stations located within the geographical boundaries of the 12 cities. Daily maximum temperatures and minimum relative humidity values were set to the maximum and minimum values observed among the set of weather stations in each city, respectively.Note 6 Humidex values were calculated based on daily maximum temperatures and minimum relative humidity values.Note 23 The humidex combines temperature and humidity to better describe how hot and humid weather feels to the average person.Note 24 Note that relative humidity data were not available in Brampton during the study period, so values from Mississauga—the nearest city, located approximately 20 km southeast—were used.
Ozone (O3), nitrogen dioxide (NO2), and fine particulate matter (PM2.5) data measured at air pollution monitoring stations within city boundaries were retrieved from the National Air Pollution Surveillance Program.Note 25 To reduce the impact of outliers in the hourly data, daily air pollution levels were calculated using the 10% trimmed means.6 Air pollutants were included as covariates in the regression models to account for possible short-term positive associations with mortality.Note 2, Note 21, Note 26, Note 27
Defining extreme heat events
Extreme heat events were defined using the heat warning criteria published by ECCC.Note 28 Developed in collaboration with a variety of stakeholders, including Health Canada and provincial and territorial health authorities, heat warning criteria specify temperature and humidex thresholds that, if met or exceeded, initiate an extreme heat event. Heat warning criteria are published for 15 geographic zones in Canada. In Calgary, for example, an extreme heat event is declared when two or more days are expected to have a maximum temperature of 29℃ and a minimum temperature of 14℃. By contrast, in Toronto, an extreme heat event is declared when two or more days are expected to have a maximum temperature of 31℃ and a minimum temperature of 20℃ or humidex values of at least 40. The heat warning criteria for the 12 cities analyzed in this study are described in Appendix 1.
Modelling daily mortality risks
For each city (j = 1, …, 12), cause of death (k = 1, 2, 3), and age group (m = 1, 2), the observed mortality counts on day i (= 1, …, 1,932) were modelled using a log-linear generalized additive model with the following covariates: the maximum temperature on day i; the average of the maximum temperatures on the three days preceding day i;Note 6, Note 29 a binary variable set to 1 if day i is classified as an extreme heat event;Note 2, Note 30 the average levels of O3, NO2, and PM2.5 on day i; a set of binary variables measuring the day of the week;Note 31 a binary variable set to 1 for all days in the year 2020; and continuous time.
To allow for non-linear associations with mortality, the regression coefficients for the two temperature variables, the three air pollution variables, and continuous time were specified using thin plate splines.Note 6, Note 32, Note 33, Note 34 Continuous time was included to remove longer-term trends in the data (e.g., increasing death counts caused by increasing population sizes and changing age structures) while retaining shorter-term variability.Note 6, Note 9, Note 29 The binary variable measuring extreme heat days captured the effects of extreme heat events on mortality that depart from the effects of temperature.Note 2, Note 3, Note 31 The binary variable set to 1 for all days in the year 2020 was intended to adjust for the higher average death counts during the COVID-19 pandemic. All models were estimated using a quasi-Poisson likelihood to allow for overdispersion in the mortality counts. The models were fit using the mgcv package (v1.8-39)Note 35 in the R statistical software (v.4.1).Note 36
The results of the log-linear generalized additive models were used to calculate daily heat-related mortality risks ( s) for each city, cause, and age group (Equation [1]). s quantify the combined effects of temperature and extreme heat events on mortality. In Equation (1), f denotes the non-linear function of daily maximum temperature, g denotes the non-linear function of the average maximum temperature of the preceding three days, and denotes the coefficient for the binary variable capturing the added effects of extreme heat events. To assess the relative magnitude of s during extreme heat events, extreme heat relative risks ( s) were calculated by dividing the average of the s on all extreme heat event days by the average of the s on all other days (without extreme heat events).Note 3, Note 6 The overall s (i.e., combined for both age groups) were calculated as the average of on extreme heat event days divided by the average of on days without extreme heat events.
The number of excess deaths attributable to extreme heat events was calculated following Equation (2), where Y denotes the average number of deaths on a day without an extreme heat event and N denotes a total count of extreme heat event days.Note 6 The number of excess deaths was calculated annually for each city, cause, and age group. The cumulative number of excess deaths was then calculated as the sum of annual excess deaths from 2000 to 2020.
For each quantity derived from the model results (i.e., s, s, and excess deaths), uncertainty was evaluated by creating posterior distributions of model parameters based on the estimated coefficients and variance-covariance matrices, and then calculating the derived quantity based on 10,000 simulations from the posterior distributions. The 95% uncertainty intervals reported in this article represent the 2.5 and 97.5 percentile values of these simulations.
Sensitivity analyses
The first sensitivity analysis defined extreme heat events as two or more consecutive days with maximum temperatures equal to or greater than the 95 percentile of the daily maximum temperatures during the months of June, July, and August from 2000 to 2020 (Appendix 1).Note 37 The second and third analyses included only one of the temperature-related covariates. The fourth sensitivity analysis estimated the non-linear associations between temperature and mortality via penalized cubic splines.Note 7 The fifth analysis restricted the study period to 2000 to 2019. The results of the sensitivity analyses are shown in Appendix 2 and are generally similar to those presented below.
Results
Table 1 shows the average daily death counts on days without extreme heat events, as well as the average number of days classified as having extreme heat events per year during the study period. In general, the magnitude of average daily death counts aligns with the population sizes of each city, with the highest and smallest numbers of daily deaths observed in Toronto and Brampton, respectively. For all cities and causes, daily death counts were higher among people aged 65 and older than those aged younger than 65.
| City and age group | Number of deaths per day on days without extreme heat events | Extreme heat event days per year |
|||||
|---|---|---|---|---|---|---|---|
| Non-accidental causes |
Cardiovascular causes |
Respiratory causes |
|||||
| Mean | Stanard Deviation |
Mean | Stanard Deviation |
Mean | Stanard Deviation |
Mean | |
| Brampton | |||||||
| Younger than 65 | 1.2 | 1.1 | 0.3 | 0.5 | 0.0 | 0.2 | 5.8 |
| 65 and older | 3.1 | 2.0 | 1.0 | 1.1 | 0.3 | 0.5 | 5.8 |
| Calgary | |||||||
| Younger than 65 | 2.9 | 1.8 | 0.6 | 0.8 | 0.1 | 0.3 | 1.9 |
| 65 and older | 10.1 | 3.6 | 3.8 | 2.0 | 0.9 | 0.9 | 1.9 |
| Edmonton | |||||||
| Younger than 65 | 3.0 | 1.8 | 0.7 | 0.8 | 0.2 | 0.4 | 5.0 |
| 65 and older | 9.7 | 3.5 | 3.4 | 1.9 | 1.0 | 1.0 | 5.0 |
| Hamilton | |||||||
| Younger than 65 | 2.0 | 1.4 | 0.5 | 0.7 | 0.1 | 0.3 | 7.1 |
| 65 and older | 8.0 | 3.0 | 2.6 | 1.6 | 0.8 | 0.9 | 7.1 |
| Mississauga | |||||||
| Younger than 65 | 3.2 | 1.8 | 0.7 | 0.8 | 0.1 | 0.3 | 5.8 |
| 65 and older | 9.9 | 3.7 | 3.1 | 1.8 | 0.9 | 0.9 | 5.8 |
| Montréal | |||||||
| Younger than 65 | 6.0 | 2.5 | 1.3 | 1.2 | 0.2 | 0.5 | 3.4 |
| 65 and older | 28.0 | 5.7 | 8.2 | 3.1 | 2.5 | 1.6 | 3.4 |
| Ottawa | |||||||
| Younger than 65 | 2.5 | 1.6 | 0.5 | 0.7 | 0.1 | 0.3 | 4.3 |
| 65 and older | 10.2 | 3.5 | 3.3 | 1.8 | 0.9 | 1.0 | 4.3 |
| Québec | |||||||
| Younger than 65 | 1.7 | 1.3 | 0.4 | 0.6 | 0.1 | 0.3 | 1.8 |
| 65 and older | 8.5 | 3.0 | 2.4 | 1.6 | 0.8 | 0.9 | 1.8 |
| Surrey | |||||||
| Younger than 65 | 1.7 | 1.3 | 0.3 | 0.6 | 0.1 | 0.3 | 0.9 |
| 65 and older | 5.9 | 2.7 | 2.0 | 1.4 | 0.5 | 0.7 | 0.9 |
| Toronto | |||||||
| Younger than 65 | 7.5 | 2.7 | 1.6 | 1.3 | 0.3 | 0.5 | 11.3 |
| 65 and older | 31.7 | 6.0 | 10.2 | 3.4 | 2.8 | 1.7 | 11.3 |
| Vancouver | |||||||
| Younger than 65 | 2.4 | 1.6 | 0.4 | 0.7 | 0.1 | 0.3 | 0.8 |
| 65 and older | 10.0 | 3.2 | 3.3 | 1.9 | 1.0 | 1.0 | 0.8 |
| Winnipeg | |||||||
| Younger than 65 | 2.6 | 1.6 | 0.6 | 0.8 | 0.1 | 0.3 | 3.0 |
| 65 and older | 10.7 | 3.3 | 3.7 | 2.0 | 1.0 | 1.9 | 3.0 |
| Sources: Canadian Vital Statistics - Death database; Environment and Climate Change Canada Historical Data, 2000 to 2020; and Environment and Climate Change Canada Criteria for Public Weather Alerts. | |||||||
During the 21-year study period, extreme heat events were most frequent in the cities located in southwestern Ontario and least frequent in the cities located in British Columbia. For example, Toronto and Hamilton, which experience a continental climate characterized by warm and humid summers, averaged approximately 11 and 7 extreme heat days per year during the study period, respectively. By comparison, both Vancouver and Surrey, which experience more moderate oceanic climates, averaged about one extreme heat event day per year. The consistency of extreme heat events over time also varied considerably; for example, Vancouver recorded 6 years with one or more extreme heat event days, while Toronto recorded 19 years.
Extreme heat relative risks
The s for non-accidental, cardiovascular, and respiratory mortality are shown in Figure 1 (see also Appendix 3). estimates larger than 1 indicate that, on average, s on extreme heat event days were greater than on days without extreme heat events. Focusing first on non-accidental mortality, overall point estimates were greater than 1 in 10 of 12 cities. For both age groups combined, only Montréal had an that was significantly greater than 1 at 95% uncertainty, with a 9% (95% confidence interval [CI]: 4% to 15%) higher mortality risk on extreme heat event days. The s for people aged 65 and older were greater than for those aged younger than 65 in 7 of 12 cities. In Montréal, Québec, Surrey, and Toronto, in particular, older people had significantly elevated non-accidental mortality risks on extreme heat days. Non-accidental mortality risks were not significantly higher during extreme heat events for younger people in any of the cities analyzed.
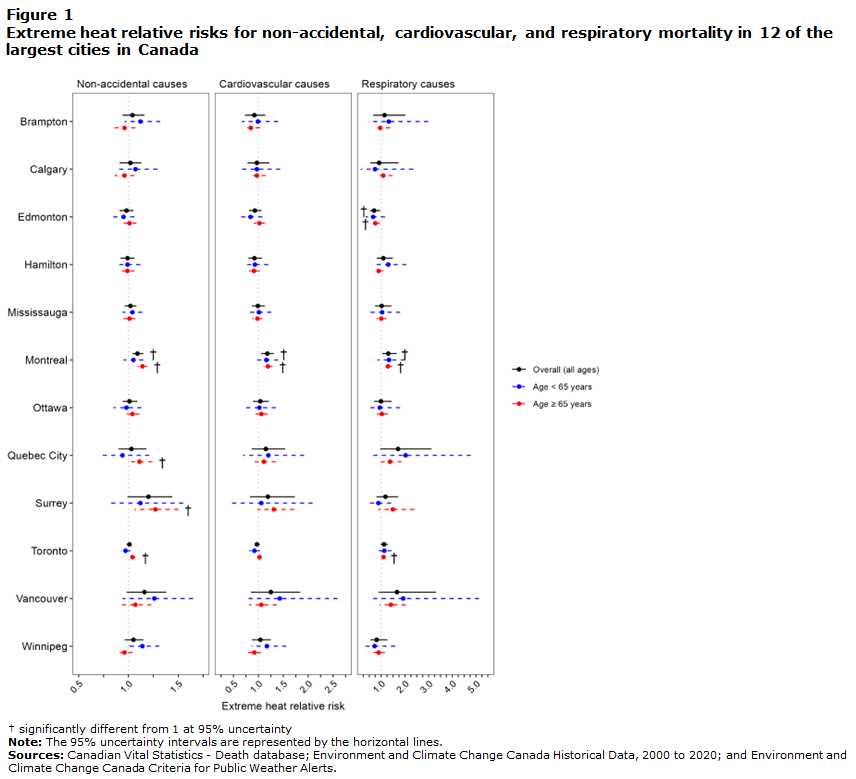
Description of Figure 1
| City and Age group | Non-accidental causes | Cardiovascular causes | Respiratory causes | ||||||
|---|---|---|---|---|---|---|---|---|---|
| Mean | 2.5 percentile | 97.5 percentile | Mean | 2.5 percentile | 97.5 percentile | Mean | 2.5 percentile | 97.5 percentile | |
| Brampton | |||||||||
| Overall (all ages) | 1.04 | 0.94 | 1.15 | 0.92 | 0.73 | 1.14 | 1.14 | 0.66 | 2.02 |
| Younger than 65 | 1.12 | 0.95 | 1.31 | 0.99 | 0.67 | 1.40 | 1.32 | 0.46 | 2.98 |
| 65 and older | 0.96 | 0.86 | 1.07 | 0.85 | 0.69 | 1.03 | 0.97 | 0.65 | 1.38 |
| Calgary | |||||||||
| Overall (all ages) | 1.02 | 0.91 | 1.13 | 0.97 | 0.78 | 1.22 | 0.91 | 0.54 | 1.73 |
| Younger than 65 | 1.07 | 0.89 | 1.28 | 0.97 | 0.62 | 1.44 | 0.74 | 0.14 | 2.35 |
| 65 and older | 0.96 | 0.86 | 1.06 | 0.97 | 0.82 | 1.15 | 1.09 | 0.77 | 1.48 |
| Edmonton | |||||||||
| Overall (all ages) | 0.98 | 0.92 | 1.05 | 0.93 | 0.81 | 1.06 | 0.7Data table for figure 1 Note † | 0.52 | 0.97 |
| Younger than 65 | 0.95 | 0.84 | 1.06 | 0.84 | 0.64 | 1.08 | 0.66 | 0.34 | 1.16 |
| 65 and older | 1.01 | 0.95 | 1.08 | 1.02 | 0.91 | 1.13 | 0.75Data table for figure 1 Note † | 0.59 | 0.94 |
| Hamilton | |||||||||
| Overall (all ages) | 0.99 | 0.93 | 1.06 | 0.92 | 0.80 | 1.07 | 1.09 | 0.81 | 1.49 |
| Younger than 65 | 0.99 | 0.87 | 1.12 | 0.93 | 0.71 | 1.20 | 1.30 | 0.77 | 2.06 |
| 65 and older | 1.00 | 0.93 | 1.06 | 0.91 | 0.81 | 1.03 | 0.89 | 0.71 | 1.08 |
| Mississauga | |||||||||
| Overall (all ages) | 1.02 | 0.96 | 1.08 | 0.99 | 0.88 | 1.13 | 1.02 | 0.74 | 1.43 |
| Younger than 65 | 1.04 | 0.94 | 1.14 | 1.00 | 0.80 | 1.26 | 1.04 | 0.55 | 1.80 |
| 65 and older | 1.01 | 0.95 | 1.07 | 0.98 | 0.88 | 1.08 | 1.00 | 0.80 | 1.22 |
| Montréal | |||||||||
| Overall (all ages) | 1.09Data table for figure 1 Note † | 1.04 | 1.15 | 1.18Data table for figure 1 Note † | 1.05 | 1.31 | 1.3Data table for figure 1 Note † | 1.04 | 1.65 |
| Younger than 65 | 1.05 | 0.95 | 1.15 | 1.16 | 0.94 | 1.40 | 1.33 | 0.84 | 2.00 |
| 65 and older | 1.14Data table for figure 1 Note † | 1.09 | 1.19 | 1.19Data table for figure 1 Note † | 1.10 | 1.29 | 1.28Data table for figure 1 Note † | 1.11 | 1.47 |
| Ottawa | |||||||||
| Overall (all ages) | 1.01 | 0.94 | 1.09 | 1.04 | 0.89 | 1.21 | 0.99 | 0.70 | 1.44 |
| Younger than 65 | 0.99 | 0.85 | 1.13 | 1.02 | 0.75 | 1.35 | 0.94 | 0.43 | 1.80 |
| 65 and older | 1.04 | 0.97 | 1.11 | 1.06 | 0.94 | 1.19 | 1.03 | 0.82 | 1.29 |
| Québec | |||||||||
| Overall (all ages) | 1.03 | 0.90 | 1.18 | 1.15 | 0.87 | 1.54 | 1.71 | 0.96 | 3.12 |
| Younger than 65 | 0.94 | 0.72 | 1.21 | 1.20 | 0.69 | 1.92 | 2.03 | 0.66 | 4.78 |
| 65 and older | 1.12Data table for figure 1 Note † | 1.01 | 1.24 | 1.11 | 0.90 | 1.35 | 1.37 | 0.98 | 1.87 |
| Surrey | |||||||||
| Overall (all ages) | 1.20 | 0.99 | 1.44 | 1.19 | 0.83 | 1.73 | 1.19 | 0.80 | 1.71 |
| Younger than 65 | 1.12 | 0.80 | 1.55 | 1.06 | 0.47 | 2.09 | 0.88 | 0.50 | 1.42 |
| 65 and older | 1.27Data table for figure 1 Note † | 1.07 | 1.50 | 1.31 | 0.98 | 1.72 | 1.49 | 0.87 | 2.40 |
| Toronto | |||||||||
| Overall (all ages) | 1.01 | 0.98 | 1.03 | 0.97 | 0.92 | 1.03 | 1.12 | 0.98 | 1.28 |
| Younger than 65 | 0.97 | 0.93 | 1.02 | 0.92 | 0.82 | 1.03 | 1.13 | 0.86 | 1.44 |
| 65 and older | 1.04Data table for figure 1 Note † | 1.01 | 1.07 | 1.03 | 0.98 | 1.07 | 1.10Data table for figure 1 Note † | 1.01 | 1.20 |
| Vancouver | |||||||||
| Overall (all ages) | 1.16 | 0.99 | 1.38 | 1.25 | 0.85 | 1.84 | 1.68 | 0.89 | 3.31 |
| Younger than 65 | 1.26 | 0.94 | 1.65 | 1.43 | 0.72 | 2.59 | 1.93 | 0.53 | 5.13 |
| 65 and older | 1.07 | 0.92 | 1.23 | 1.06 | 0.81 | 1.37 | 1.41 | 0.93 | 2.04 |
| Winnipeg | |||||||||
| Overall (all ages) | 1.05 | 0.96 | 1.15 | 1.04 | 0.87 | 1.25 | 0.81 | 0.54 | 1.27 |
| Younger than 65 | 1.14 | 0.98 | 1.32 | 1.17 | 0.86 | 1.56 | 0.72 | 0.27 | 1.59 |
| 65 and older | 0.96 | 0.89 | 1.04 | 0.92 | 0.80 | 1.05 | 0.90 | 0.68 | 1.16 |
Sources: Canadian Vital Statistics - Death database; Environment and Climate Change Canada Historical Data, 2000 to 2020; and Environment and Climate Change Canada Criteria for Public Weather Alerts. |
|||||||||
For cardiovascular mortality, overall point estimates were greater than 1 in 6 of 12 cities: Montréal, Ottawa, Québec, Surrey, Vancouver, and Winnipeg. The only city in which extreme heat events had a significant impact on overall cardiovascular mortality was Montréal, where daily mortality risks increased by about 18% (95% CI: 5% to 31%) on extreme heat event days, compared with days without extreme heat events. For the age-group-specific estimates, the point estimates were greater for people aged 65 and older than for those aged younger than 65 in five cities. For older adults, daily cardiovascular mortality risks were significantly higher during extreme heat events in Montréal, with an increase of 19% (95% CI: 10% to 29%), compared with days without extreme heat events. There were no cities in which people aged younger than 65 had s significantly greater than 1.
Like both non-accidental and cardiovascular mortality, the overall s for respiratory mortality indicated higher mortality risks on extreme heat days in the majority of cities; only Calgary, Edmonton, Ottawa, and Winnipeg had overall point estimates smaller than 1. The overall for respiratory causes was significantly greater than 1 in Montréal, with a 30% (95% CI: 4% to 65%) higher average daily mortality risk during extreme heat events. By contrast, the overall was significantly less than 1 in Edmonton, with a 30% (95% CI: 3% to 48%) smaller average daily mortality risk on extreme heat days. Extreme heat events were also associated with significantly higher respiratory mortality risks among older adults in both Montréal and Toronto.
Excess deaths attributable to extreme heat events
Table 2 displays the number of excess deaths from non-accidental, cardiovascular, and respiratory causes attributable to extreme heat events. During the study period and in all cities, approximately 668 excess non-accidental deaths, 115 excess cardiovascular deaths, and 114 excess respiratory deaths were attributed to the increased mortality risks during extreme heat events (Figure 1). The number of excess non-accidental deaths was greater than zero in Montréal, Surrey, and Toronto, at 95% uncertainty. The remaining nine cities had estimated excess death counts that included zero. Extreme heat events were found to be associated with significantly greater than zero excess deaths attributable to cardiovascular causes in Montréal and to respiratory causes in Montréal, Québec, and Toronto. Montréal was the only city in which extreme heat events were associated with an unambiguous increase in excess deaths for all three outcomes. This finding aligns with past research analyzing non-accidental and cardiorespiratory causes of death in this city.Note 17, Note 20, Note 38, Note 39
| City | Non-accidental causes | Cardiovascular causes | Respiratory causes | ||||||
|---|---|---|---|---|---|---|---|---|---|
| Mean | 2.5 percentile |
97.5 percentile |
Mean | 2.5 percentile |
97.5 percentile |
Mean | 2.5 percentile |
97.5 percentile |
|
| Brampton | 1 | -46 | 52 | -21 | -45 | 7 | 0 | -12 | 15 |
| Calgary | -8 | -51 | -39 | -4 | -28 | 22 | 2 | -9 | 16 |
| Edmonton | -3 | -80 | 79 | -6 | -48 | 40 | -33 | -51 | -11 |
| Hamilton | -9 | -93 | -76 | -37 | -79 | 8 | -9 | -30 | 15 |
| Mississauga | 22 | -61 | 108 | -9 | -52 | 38 | 0 | -22 | 26 |
| Montréal | 295 | 188 | 409 | 130 | 70 | 193 | 56 | 24 | 93 |
| Ottawa | 32 | -49 | 107 | 19 | -21 | 62 | 2 | -16 | 24 |
| Québec | 32 | -8 | 76 | 12 | -8 | 35 | 14 | 1 | 29 |
| Surrey | 34 | 9 | 63 | 12 | -1 | 28 | 5 | -2 | 16 |
| Toronto | 250 | 35 | 471 | 25 | -93 | 146 | 76 | 11 | 144 |
| Vancouver | 23 | -7 | 55 | 7 | -9 | 24 | 10 | 0 | 22 |
| Winnipeg | -1 | -60 | 61 | -13 | -44 | 22 | -9 | -23 | 9 |
| Sources: Canadian Vital Statistics - Death database; Environment and Climate Change Canada Historical Data, 2000 to 2020; and Environment and Climate Change Canada Criteria for Public Weather Alerts. | |||||||||
Discussion
This study has estimated the impacts of extreme heat events on non-accidental, cardiovascular, and respiratory mortality in 12 of the largest cities in Canada from 2000 to 2020. This study builds on past research by analyzing multiple causes of death, modelling the associations between extreme heat and mortality over a longer time period, and exploring how the impacts of extreme heat events vary between cities. Broadly, this study shows that daily mortality risks were higher on extreme heat event days for non-accidental and respiratory causes in most cities and that the city-specific impacts of extreme heat on cardiovascular mortality were more heterogeneous. Extreme heat events were found to be more strongly associated with mortality for people aged 65 and older, compared with those aged younger than 65; people aged younger than 65 did not have significantly higher mortality risks during extreme heat events for any causes or in any cities.
Compared with past research, the results of this study suggest that the average longer-term impacts of extreme heat events on mortality were considerably smaller than those previously estimated from analyses of single events.Note 16, Note 17, Note 18, Note 39 One explanation for this difference is that the majority of past studies focus on events known to have been associated with large increases in mortality and, as such, reflect the upper-tail risk of extreme heat events. This study, by contrast, considers all extreme heat events over two decades, some of which have been considered in past studies, as well as many events that likely had little or no impact on daily mortality. The results of this study do, however, align with past work focused on the impacts of extreme heat over longer periods. For example, Anderson and BellNote 2 reported that non-accidental mortality risks increased by about 4% during heatwaves across 43 cities in the United States from 1987 to 2000, and Peng et al.6 observed a 7.5% increase in daily non-accidental mortality during heatwaves in Chicago from 1987 to 2005. Using population-weighted averages of the s (based on 2021 Census data), this study finds that daily mortality risks increased by about 4.2% for non-accidental causes, 3.8% for cardiovascular causes, and 11.7% for respiratory causes during extreme heat events.
Describing the heterogeneity of extreme heat impacts
The results of this study show that the impacts of extreme heat events were most substantial in Montréal and Toronto, and that, with a few exceptions, the mortality risks during extreme heat events in the other 10 cities were not significantly different from the daily averages (Figure 1; Table 2). One explanation for this heterogeneity between cities may be the concentration of rental housing and lower levels of air conditioning access among renters, compared with owners.Note 40 Exploratory analyses indicate that the overall s for all three mortality outcomes are positively correlated with the proportion of renter households (Pearson’s r = 0.24 for non-accidental causes, 0.63 for cardiovascular causes, and 0.57 for respiratory causes [see Appendix 4]). Of the 12 cities analyzed in this study, Montréal and Toronto had two of the three highest proportions of renter households (61% and 48%, respectively, based on the 2021 Census). Recent research has shown that people in rental dwellings are significantly less likely to have air conditioning than provincial averages in Quebec (49% compared with an average of 58%), Ontario (71% compared with 85%), and British Columbia (24% compared with 32%).Note 41
A second possible explanation for the between-city heterogeneity of s and excess deaths relates to the link between historical meteorological conditions and acclimatization or adaptation. Past research has suggested that people living in areas with lower ambient temperatures and fewer extreme heat events may have lower levels of physical acclimatization and may lack the adaptation measures necessary to deal with extreme heat (e.g., air conditioning).Note 22, Note 42 Supporting this interpretation, in these 12 cities, negative correlations were observed between the average number of extreme heat days per year (Table 1) and the overall s for non-accidental (Pearson’s r = -0.61), cardiovascular (-0.68), and respiratory (-0.33) causes. Surrey and Vancouver, in particular, had the fewest extreme heat events (Table 1) but among the highest s attributable to non-accidental and cardiovascular causes.
Limitations and future research
One limitation of this study is that the models assume that the associations between temperature, extreme heat events, and mortality did not change during the study period; however, it is possible that these associations have weakened or strengthened over time because of the increasing adoption of adaptation measures and the higher temperatures and longer events observed in recent years, for example.Note 17, Note 20 Second, this study used mortality, temperature, and air pollution data measured at the city level and did not account for local variations within cities. Third, this study considered only two age groups because of sparse death counts for respiratory and cardiovascular causes in the smaller cities (Table 1), yet it is likely that mortality risks vary by more precise age groups. Fourth, only the 12 largest cities in Canada were analyzed to ensure sufficient daily death counts during the study period, and, as such, it is not clear how the results of this study generalize to smaller cities and rural communities. Fifth, this study adopted a policy-informed but restrictive definition of extreme heat events that may not capture many hot and humid days below the proposed thresholds but may also be associated with elevated mortality risks.Note 43
To better understand the impacts of extreme heat on health in Canada, future research may consider extending the exploratory correlation analysis conducted in this study to model the city-specific s or s as a function of city-level characteristics, such as air conditioning prevalence and the presence or type of climate change adaptation initiatives.Note 40 Additionally, future work may investigate additional health outcomes associated with heat (e.g., hospitalizations) or apply matched or case-crossover research designs that are appropriate for analyzing rarer causes of death (e.g., mental disorders or substance-related poisonings). Finally, case-crossover and small-area spatiotemporal analysesNote 44 could provide insight regarding how mortality risks during extreme heat events are modified by individual (e.g., sex) and local sociodemographic and built environment characteristics, as well as the presence of place-based adaptation initiatives, such as cooling centres.
| City | Environment and Climate Change Canada heat warning criteria | 95th percentile of Tmax during the study period |
|---|---|---|
| Brampton | Two or more consecutive days of Tmax >= 31°C and Tmin >= 21°C or Hmax >= 40 | Two or more consecutive days of Tmax >= 33°C |
| Calgary | Two or more consecutive days of Tmax >= 29°C and Tmin >= 14°C | Two or more consecutive days of Tmax >= 31°C |
| Edmonton | Two or more consecutive days of Tmax >= 29°C and Tmin >= 14°C | Two or more consecutive days of Tmax >= 31°C |
| Hamilton | Two or more consecutive days of Tmax >= 31°C and Tmin >= 21°C or Hmax >= 40 | Two or more consecutive days of Tmax >= 33°C |
| Mississauga | Two or more consecutive days of Tmax >= 31°C and Tmin >= 21°C or Hmax >= 40 | Two or more consecutive days of Tmax >= 33°C |
| Montréal | One hour of Tmax >= 30°C and Hmax >= 40 or Tmax >= 40°C | Two or more consecutive days of Tmax >= 32°C |
| Ottawa | Two or more consecutive days of Tmax >= 31°C and Tmin >= 21°C or Hmax >= 40 | Two or more consecutive days of Tmax >= 33°C |
| Québec | One hour of Tmax >= 30°C and Hmax >= 40 or Tmax >= 40°C | Two or more consecutive days of Tmax >= 31°C |
| Surrey | Two or more consecutive days of Tmax >= 33°C and Tmin >= 17°C | Two or more consecutive days of Tmax >= 34°C |
| Toronto | Two or more consecutive days of Tmax >= 31°C and Tmin >= 21°C or Hmax >= 40 | Two or more consecutive days of Tmax >= 35°C |
| Vancouver | Two or more consecutive days of Tmax >= 29°C and Tmin >= 16°C | Two or more consecutive days of Tmax >= 36°C |
| Winnipeg | Two or more consecutive days of Tmax >= 32°C and Tmin >= 16°C | Two or more consecutive days of Tmax >= 37°C |
|
Notes: Tmax denotes daily maximum temperature. Tmin denotes daily minimum temperature. Hmax denotes daily maximum humidex. Sources: Environment and Climate Change Canada Historical Data, 2000 to 2020; and Environment and Climate Change Canada Criteria for Public Weather Alerts. |
||

Description of Appendix 2
This figure shows three charts of extreme heat relative risks (EHRR) on the y-axis for 12 cities on the x-axis: Brampton, Calgary, Edmonton, Hamilton, Mississauga, Montréal, Ottawa, Québec, Surrey, Toronto, Vancouver, and Winnipeg. For each city in each chart, six estimates are shown, with a dot and a vertical line showing the 95% uncertainty. From left to right, these estimates are from the main model and sensitivity models 1 through 5. From top to bottom, the chart represents the EHRR for non-accidental causes, cardiovascular causes, and respiratory causes. In each chart, for each city, the six vertical lines overlap, representing no significant differences between the main model and any of the sensitivity analyses.
| City and age group | Non-accidental causes | Cardiovascular causes | Respiratory causes | ||||||
|---|---|---|---|---|---|---|---|---|---|
| Mean | 2.5 percentile |
97.5 percentile |
Mean | 2.5 percentile |
97.5 percentile |
Mean | 2.5 percentile |
97.5 percentile |
|
| Brampton | |||||||||
| Younger than 65 | 1.12 | 0.95 | 1.31 | 0.99 | 0.67 | 1.40 | 1.32 | 0.46 | 2.98 |
| 65 and older | 0.96 | 0.86 | 1.07 | 0.85 | 0.69 | 1.03 | 0.97 | 0.65 | 1.38 |
| Overall (all ages) | 1.04 | 0.94 | 1.15 | 0.92 | 0.73 | 1.14 | 1.14 | 0.66 | 2.02 |
| Calgary | |||||||||
| Younger than 65 | 1.07 | 0.89 | 1.28 | 0.97 | 0.62 | 1.44 | 0.74 | 0.14 | 2.35 |
| 65 and older | 0.96 | 0.86 | 1.06 | 0.97 | 0.82 | 1.15 | 1.09 | 0.77 | 1.48 |
| Overall (all ages) | 1.02 | 0.91 | 1.13 | 0.97 | 0.78 | 1.22 | 0.91 | 0.54 | 1.73 |
| Edmonton | |||||||||
| Younger than 65 | 0.95 | 0.84 | 1.06 | 0.84 | 0.64 | 1.08 | 0.66 | 0.34 | 1.16 |
| 65 and older | 1.01 | 0.95 | 1.08 | 1.02 | 0.91 | 1.13 | 0.75 | 0.59 | 0.94 |
| Overall (all ages) | 0.98 | 0.92 | 1.05 | 0.93 | 0.81 | 1.06 | 0.70 | 0.52 | 0.97 |
| Hamilton | |||||||||
| Younger than 65 | 0.99 | 0.87 | 1.12 | 0.93 | 0.71 | 1.20 | 1.30 | 0.77 | 2.06 |
| 65 and older | 1.00 | 0.93 | 1.06 | 0.91 | 0.81 | 1.03 | 0.89 | 0.71 | 1.08 |
| Overall (all ages) | 0.99 | 0.93 | 1.06 | 0.92 | 0.80 | 1.07 | 1.09 | 0.81 | 1.49 |
| Mississauga | |||||||||
| Younger than 65 | 1.04 | 0.94 | 1.14 | 1.00 | 0.80 | 1.26 | 1.04 | 0.55 | 1.80 |
| 65 and older | 1.01 | 0.95 | 1.07 | 0.98 | 0.88 | 1.08 | 1.00 | 0.80 | 1.22 |
| Overall (all ages) | 1.02 | 0.96 | 1.08 | 0.99 | 0.88 | 1.13 | 1.02 | 0.74 | 1.43 |
| Montréal | |||||||||
| Younger than 65 | 1.05 | 0.95 | 1.15 | 1.16 | 0.94 | 1.40 | 1.33 | 0.84 | 2.00 |
| 65 and older | 1.14 | 1.09 | 1.19 | 1.19 | 1.10 | 1.29 | 1.28 | 1.11 | 1.47 |
| Overall (all ages) | 1.09 | 1.04 | 1.15 | 1.18 | 1.05 | 1.31 | 1.30 | 1.04 | 1.65 |
| Ottawa | |||||||||
| Younger than 65 | 0.99 | 0.85 | 1.13 | 1.02 | 0.75 | 1.35 | 0.94 | 0.43 | 1.80 |
| 65 and older | 1.04 | 0.97 | 1.11 | 1.06 | 0.94 | 1.19 | 1.03 | 0.82 | 1.29 |
| Overall (all ages) | 1.01 | 0.94 | 1.09 | 1.04 | 0.89 | 1.21 | 0.99 | 0.70 | 1.44 |
| Québec | |||||||||
| Younger than 65 | 0.94 | 0.72 | 1.21 | 1.20 | 0.69 | 1.92 | 2.03 | 0.66 | 4.78 |
| 65 and older | 1.12 | 1.01 | 1.24 | 1.11 | 0.90 | 1.35 | 1.37 | 0.98 | 1.87 |
| Overall (all ages) | 1.03 | 0.90 | 1.18 | 1.15 | 0.87 | 1.54 | 1.71 | 0.96 | 3.12 |
| Surrey | |||||||||
| Younger than 65 | 1.12 | 0.80 | 1.55 | 1.06 | 0.47 | 2.09 | 0.88 | 0.50 | 1.42 |
| 65 and older | 1.27 | 1.07 | 1.50 | 1.31 | 0.98 | 1.72 | 1.49 | 0.87 | 2.40 |
| Overall (all ages) | 1.20 | 0.99 | 1.44 | 1.19 | 0.83 | 1.73 | 1.19 | 0.80 | 1.71 |
| Toronto | |||||||||
| Younger than 65 | 0.97 | 0.93 | 1.02 | 0.92 | 0.82 | 1.03 | 1.13 | 0.86 | 1.44 |
| 65 and older | 1.04 | 1.01 | 1.07 | 1.03 | 0.98 | 1.07 | 1.10 | 1.01 | 1.20 |
| Overall (all ages) | 1.01 | 0.98 | 1.03 | 0.97 | 0.92 | 1.03 | 1.12 | 0.98 | 1.28 |
| Vancouver | |||||||||
| Younger than 65 | 1.26 | 0.94 | 1.65 | 1.43 | 0.72 | 2.59 | 1.93 | 0.53 | 5.13 |
| 65 and older | 1.07 | 0.92 | 1.23 | 1.06 | 0.81 | 1.37 | 1.41 | 0.93 | 2.04 |
| Overall (all ages) | 1.16 | 0.99 | 1.38 | 1.25 | 0.85 | 1.84 | 1.68 | 0.89 | 3.31 |
| Winnipeg | |||||||||
| Younger than 65 | 1.14 | 0.98 | 1.32 | 1.17 | 0.86 | 1.56 | 0.72 | 0.27 | 1.59 |
| 65 and older | 0.96 | 0.89 | 1.04 | 0.92 | 0.80 | 1.05 | 0.90 | 0.68 | 1.16 |
| Overall (all ages) | 1.05 | 0.96 | 1.15 | 1.04 | 0.87 | 1.25 | 0.81 | 0.54 | 1.27 |
| Sources: Canadian Vital Statistics - Death database; Environment and Climate Change Canada Historical Data, 2000 to 2020; and Environment and Climate Change Canada Criteria for Public Weather Alerts. | |||||||||
| Mortality type and age group |
Percentage of renter households |
Average number of extreme heat events |
|---|---|---|
| Non-accidental | ||
| Younger than 65 | 0.02 | -0.50 |
| 65 and older | 0.36 | -0.39 |
| Overall | 0.24 | -0.61 |
| Cardiovascular | ||
| Younger than 65 | 0.57 | -0.63 |
| 65 and older | 0.44 | -0.43 |
| Overall | 0.63 | -0.68 |
| Respiratory | ||
| Younger than 65 | 0.53 | -0.18 |
| 65 and older | 0.57 | -0.54 |
| Overall | 0.57 | -0.33 |
| Sources: Canadian Vital Statistics - Death database; Environment and Climate Change Canada Historical Data, 2000 to 2020; Environment and Climate Change Canada Criteria for Public Weather Alerts; and Statistics Canada Census of Population Subdivision Profiles, 2021. | ||
- Date modified: