
Health Reports
Harmonizing the assessment of allostatic load across cycles of the Canadian Health Measures Survey: Variable selection and calculation method
by Errol M. Thomson, Mike Walker and Brittany Halverson-Duncan

DOI: https://www.doi.org/10.25318/82-003-x202400500002-eng
Abstract
Background
The availability of measures to operationalize allostatic load—the cumulative toll on the body of responding to stressor demands—in population health surveys may differ across years or surveys, hampering analyses on the entire sampled population. Here, impacts of variable selection and calculation method were evaluated to generate an allostatic load index applicable across all cycles of the Canadian Health Measures Survey (CHMS).
Methods
Data from CHMS cycles 1 to 4 were used to compare allostatic load scores when replacing the most prevalent risk factor, waist-to-hip ratio—available in cycles 1 to 4 but not 5 and 6—with body mass index (BMI), waist circumference, waist circumference within BMI groups (classified as normal, overweight, or obese), or waist-to-height ratio. Indexes were generated using clinical or sex-specific empirically defined risk thresholds and as count-based or continuous scores. Logistic regression models that included age and sex were used to relate each potential index to socioeconomic indicators (educational attainment, household income).
Results
Of the variables assessed, waist-to-height ratio and waist circumference were closest to waist-to-hip ratio according to an individual’s percentile ranking and in classifying “at risk” using either clinical or empirically defined cut-offs. Allostatic load profiles generated using waist-to-height ratios most closely resembled profiles constructed using waist-to-hip ratios. Sex-dependent associations with educational attainment and household income were maintained across constructs whether indexes were count-based or continuous.
Interpretation
Allostatic load profiles and associations with socioeconomic indicators were robust to variable substitution and method of calculation, supporting the use of a harmonized index across survey cycles to assess the cumulative toll on health of stressor exposure.
Keywords
allostatic load, stress, biomonitoring, age, sex, socioeconomic position, Canadian Health Measures Survey
Authors
Errol M. Thomson, Mike Walker and Brittany Halverson-Duncan are with the Environmental Health Science and Research Bureau, Healthy Environments and Consumer Safety Branch at Health Canada. Errol M. Thomson is also with the Department of Biochemistry, Microbiology and Immunology at the Faculty of Medicine, University of Ottawa.
What is already known on this subject?
- Allostatic load, essentially the cumulative wear and tear on the body of responding to stressors, is a predictor of trajectories of health and disease that can be used to assess the physiological toll of exposure to chemical and non-chemical stressors.
- Assessment of allostatic load requires measuring a set of biological indicators linked to stress that remains consistent across the sampled population and sampling period; the implications of replacing discontinued measures with alternatives are unknown.
What does this study add?
- Using data from the Canadian Health Measures Survey (CHMS), several potential replacement measures for waist-to-hip ratio—an allostatic load measure available in cycles 1 to 4 but not 5 and 6—were assessed in a nationally representative population of Canadian adults.
- Compared with body mass index (BMI), waist circumference, or waist circumference within BMI group, waist-to-height ratio was most similar to waist-to-hip ratio in terms of risk profile and contributed to allostatic load profiles that most resembled those generated with waist-to-hip ratio.
- This new allostatic load index can be applied across all cycles of the CHMS to evaluate subclinical effects of behaviours and exposures on health in Canadians.
Introduction
There is growing acceptance that both chemical and non-chemical stressors are important health determinants and, moreover, that the stress context may modify the effect of or response to exposure to a novel stressor.Note 1, Note 2 The theoretical underpinnings for the relationship between stressor exposure and health effects were articulated in the concept of allostatic load, the notion that the adaptation to stressor exposure by the body’s stress response systems may come at a cost, resulting in “wear and tear” that can increase the likelihood of disease.Note 3 Pioneering studies by Seeman, McEwen, and colleagues showed that allostatic load was predictive of future morbidity and mortality,Note 4, Note 5 highlighting its relevance as a predictor for trajectories of health and disease with aging. Since then, numerous studies have investigated relationships between exposures—often psychosocial—and allostatic load, and between allostatic load and disease.
Biomonitoring data reveal that individuals carry measurable levels of multiple chemicals,Note 6 but little is known about cumulative health effects of chemical mixtures or their potential interactions with individual or contextual characteristics. Because allostatic load may serve to integrate effects of chemical and non-chemical stressors, there is interest in applying the allostatic load paradigm by leveraging biomonitoring surveys to assess effects and potential interactions of chemical and non-chemical stressors on health.Note 7 Efforts to operationalize allostatic load typically involve selecting a set of biomarkers and anthropometric measures that have been linked to stress processes. These vary widely and are largely dependent upon data availability; however, they typically include metabolic, cardiovascular, and inflammatory subindexes. In some cases, they also include primary mediators of stress activation, such as the stress hormone cortisol. Importantly, the use of a composite measure was shown to be superior to individual components in predicting morbidity and mortality,Note 5 supporting the notion that allostatic load indexes capture broader physiological dysregulation relevant to health. However, there remains considerable debate regarding which components should be included in constructing an allostatic load index, and how the allostatic load score should be calculated.
Indeed, despite the utility of allostatic load indexes as composite indicators of stressor effects and as predictors of trajectories of health and disease, the fact that the scores themselves differ according to the inclusion or exclusion of component measures impedes direct comparison across studies.Note 8 In a prior study, a national allostatic load profile for Canadians was generated using measures employed in numerous prior studies, enabling, for example, direct comparison with results from a similar survey conducted in the United States, the National Health and Nutrition Examination Survey (NHANES).Note 7 However, the population survey from which the data were obtained—the Canadian Health Measures Survey (CHMS)—stopped collecting data on hip circumference for later cycles of the survey, resulting in one of the measures, waist-to-hip ratio (WHR), no longer being available. As a result, the allostatic load construct used for cycles 1 to 3 could no longer be applied to all cycles of the survey.
To enable use of the full dataset available in a survey, or to facilitate analyses across surveys, it may be necessary to create a harmonized index. In the CHMS, of all the measures used to construct the allostatic load index, high WHR was the most prevalent risk factor and exhibited the greatest contrast in profile between sexes.Note 7 It is unclear to what extent substitution with another measure may alter allostatic load profiles or the relationship to individual characteristics such as age, sex, and socioeconomic position. Body mass index (BMI), waist circumference (WC), WHR, and waist-to-height ratio (WHtR) are commonly used to assess general and central obesity in clinical practiceNote 9 and—with the exception of WHtR—are frequently used as measures in allostatic load indexes.Note 10 In the present study, CHMS data were used to compare individual and population-level changes in scores for allostatic load indexes in which other commonly used measures were substituted for WHR. Associations between the various constructs and indicators of socioeconomic position were then assessed to evaluate whether relationships were maintained across indexes.
Methods
Survey
The CHMS is an ongoing (2007 to present) nationally representative biomonitoring survey that collects information on the health and lifestyle factors of Canadians aged 3 to 79 living in the 10 provinces. Data collected include detailed health, nutrition, and lifestyle information; demographic and socioeconomic data; and physical measures recorded at a mobile examination centre. Individuals living in the three territories or on reserves and settlements in the provinces, full-time members of the Canadian Forces, institutionalized individuals, and residents of certain remote areas are excluded from the survey. Further details are available in the CHMS data user guides.Note 11 In the present study, data from CHMS cycles 1, 2, 3, and 4 were used, covering 21,858 people, with a focus on the adult subset, which includes individuals aged 20 to 79 (n=13,533). Pregnant women and any person with a missing indicator or factor were also excluded, resulting in the inclusion of 12,304 to 12,329 people in the models generated in the study, depending upon the measure used.
Allostatic load score
In a previous study analyzing data from CHMS cycles 1, 2, and 3, allostatic load scores were generated using the following nine measures: total cholesterol (CHOL), high-density lipoprotein (HDL), glycated hemoglobin (HbA1c), WHR, systolic blood pressure (SBP), diastolic blood pressure (DBP), resting heart rate (HR), C-reactive protein (CRP), and serum albumin (ALB).Note 7 Since neither Cycle 5 nor Cycle 6 included the WHR measure, four replacement candidates were considered: BMI; WC; WC within designated BMI groupings (WC2), where the BMI groups are normal (BMI less than 24.9), overweight (25 to 29.9), obese (30 to 34.9), and obese II and III (over 35); and WHtR. While these four potential replacement variables were measured in cycles 1 to 6, analyses were performed using cycles 1 to 4 to evaluate and compare impacts of variable composition versus WHR. Thus, five possible collections of measures were used to compute allostatic load scores on a subset of individuals sampled in cycles 1 to 4. Each collection of measures included CHOL, HDL, HbA1c, SBP, DBP, HR, CRP, and ALB, along with one of WHR, BMI, WC, WC2, and WHtR. The resulting sample size for each collection of measures was 12,306 for WHR, 12,329 for BMI, 12,322 for WC, 12,304 for WC2, and 12,310 for WHtR.
For each collection of measures, allostatic load scores were calculated in three ways: (1) using clinically determined high-risk thresholds, (2) using empirically determined high-risk thresholds, and (3) using continuous scores. The high-risk thresholds defined according to clinical guidelines or determined empirically are provided in Table 1. Empirically determined high-risk thresholds were defined as any measure falling above the 75th percentile for all variables except HDL and ALB; for these two, values below the 25th percentile were considered high risk. For allostatic load scores using either clinically or empirically determined risk thresholds, dichotomous indicators were created for each measure: a value of “1” was assigned for high risk, and a value of “0” was assigned for all other measurements. Values were summed across all measures to produce scores in which higher values were considered to represent greater physiological dysregulation. The continuous score was determined for each measure by assigning an individual a value between 0 and 1 according to their percentile value for the variable. For example, an individual with a measure that falls at the 43rd percentile within their collection cycle and sex was assigned a continuous score of 0.43 for that measure. For HDL and ALB, the continuous score was obtained using a 1-percentile value. This approach yields continuous scores that are always positive, with larger scores indicting higher risk and lower scores indicating lower risk. The continuous allostatic load score was computed by taking the sum of continuous scores across the collection of measures. For all allostatic load calculation approaches, measures were weighted equally, in keeping with most prior efforts to operationalize allostatic load. Empirically determined risk thresholds and continuous scores were calculated within each cycle and within each sex for all measures.
| Risk factors and unit | Clinical cut-off |
Empirically determined cut-off (75th or 25th percentile) | Sample size |
|||||||
|---|---|---|---|---|---|---|---|---|---|---|
| Cycle 1 | Cycle 2 | Cycle 3 | Cycle 4 | |||||||
| Male | Female | Male | Female | Male | Female | Male | Female | |||
| Diastolic blood pressure | ||||||||||
| mm Hg | 90 | 81 | 75 | 80 | 75 | 79 | 74 | 81 | 76 | 13,381 |
| Systolic blood pressure | ||||||||||
| mm Hg | 140 | 120 | 120 | 120 | 120 | 120 | 120 | 120 | 120 | 13,381 |
| Heart rate | ||||||||||
| Bt/min | 90 | 73 | 75 | 73 | 75 | 74 | 76 | 74 | 75 | 13,381 |
| Cholesterol | ||||||||||
| mmol/L | 6.208 | 5.7 | 5.8 | 5.6 | 5.7 | 5.5 | 5.5 | 5.4 | 5.5 | 13,215 |
| C-reactive protein | ||||||||||
| mg/L | 3 | 2.5 | 3.3 | 2.6 | 3.6 | 2.8 | 3.9 | 2.7 | 3.8 | 12,770 |
| Glycated hemoglobin | ||||||||||
| percent | 6.4 | 5.8 | 5.8 | 6.0 | 5.9 | 5.6 | 5.5 | 5.6 | 5.6 | 12,865 |
| Waist circumference | ||||||||||
| cm | ||||||||||
| Male | 102 | 100 | 97 | 110 | 99 | 110 | 100 | 110 | 100 | 13,351 |
| Female | 88 | |||||||||
| BMI | 30 | 30 | 30 | 30 | 31 | 30 | 31 | 31 | 32 | 13,363 |
| Waist-to-hip ratio | ||||||||||
| Male | 0.9 | 1.0 | 0.89 | 1.0 | 0.91 | 1.0 | 0.92 | 1.0 | 0.92 | 13,333 |
| Female | 0.85 | |||||||||
| Waist-to-height ratio | 0.5 | 0.61 | 0.61 | 0.60 | 0.62 | 0.61 | 0.63 | 0.62 | 0.64 | 13,338 |
| Albumin | ||||||||||
| g/L | 38 | 45 | 43 | 43 | 41 | 42 | 41 | 42 | 40 | 13,190 |
| High-density lipoprotein | ||||||||||
| mmol/L | 1.0344 | 1.0 | 1.2 | 1.0 | 1.2 | 1.0 | 1.3 | 0.98 | 1.2 | 13,216 |
| Waist circumference by BMI | ||||||||||
| BMI less than 25 | ||||||||||
| cm | ||||||||||
| Male | 90 | 89 | 81 | 86 | 81 | 89 | 84 | 89 | 84 | 4,643 |
| Female | 80 | Note ...: not applicable | Note ...: not applicable | Note ...: not applicable | Note ...: not applicable | Note ...: not applicable | Note ...: not applicable | Note ...: not applicable | Note ...: not applicable | Note ...: not applicable |
| BMI 25 to 30 | ||||||||||
| cm | ||||||||||
| Male | 100 | 100 | 94 | 100 | 97 | 100 | 99 | 100 | 99 | 4,933 |
| Female | 90 | Note ...: not applicable | Note ...: not applicable | Note ...: not applicable | Note ...: not applicable | Note ...: not applicable | Note ...: not applicable | Note ...: not applicable | Note ...: not applicable | Note ...: not applicable |
| BMI 30 to 35 | ||||||||||
| cm | ||||||||||
| Male | 110 | 110 | 110 | 110 | 110 | 110 | 110 | 110 | 110 | 2,370 |
| Female | 105 | Note ...: not applicable | Note ...: not applicable | Note ...: not applicable | Note ...: not applicable | Note ...: not applicable | Note ...: not applicable | Note ...: not applicable | Note ...: not applicable | Note ...: not applicable |
| BMI more than or equal to 35 | ||||||||||
| cm | ||||||||||
| Male | 125 | 130 | 120 | 130 | 120 | 130 | 130 | 130 | 120 | 1,385 |
| Female | 115 | Note ...: not applicable | Note ...: not applicable | Note ...: not applicable | Note ...: not applicable | Note ...: not applicable | Note ...: not applicable | Note ...: not applicable | Note ...: not applicable | Note ...: not applicable |
|
... not applicable Notes: BMI = body mass index, mm Hg = millimetre of mercury, Bt/min = beats per minute, mmol/L = millimole per litre, mg/L = milligram per litre, cm = centimetre, g/L = gram per litre. Source: Canadian Health Measures Survey, cycles 1, 2, 3, and 4. |
||||||||||
Analyses
An investigation of dissimilarity between the discrete (clinical and empirical) scores incorporating WHR and each of the possible replacement variables BMI, WC, WC2, and WHtR was performed by calculating the proportion of individuals having 0 or 1 scores that do not match for each pairing of WHR with a replacement variable. Contrasts were further investigated by comparing the difference between an individual’s WHR percentile and the percentile of each replacement variable as determined within each cycle and sex.
Ordinal regression models were applied to the discrete count-based allostatic load scores, while linear regression models were applied to the continuous allostatic load scores. Models included continuous age, sex, education, and adjusted household income. Individual educational attainment was divided into the categories “less than high school,” “high school,” and “postsecondary” (defined as having been awarded a diploma or degree). Household income was adjusted for household size by assigning weights (first member = 1, second member = 0.4, third and subsequent members = 0.3), the sum of which determined the household weight factor.Note 12 Adjusted household incomes determined by dividing household income by the weight factor were grouped into quintiles, each representing one-fifth of the sample. Age squared was included in models to allow for potential non-linear relationships between age and allostatic load score and was removed if it was not significant in the model. For modelling purposes and to ensure an adequate sample size for each discrete allostatic load score, individuals with clinical allostatic load scores greater than 4 were collapsed into the new group “5+,” while those with empirical allostatic load scores greater than 7 were collapsed into the new group “8+.” All data analyses were conducted in R.Note 13 For population-level analyses, model fits and summary statistics were computed using the survey packageNote 14 and the ordinal package.Note 15 Variance estimation for all population-level tests, models, and estimates followed the balanced repeated replicates approach and used the combined bootstrap weights for cycles 1, 2, 3, and 4 supplied with the CHMS, and 46 degrees of freedom, as specified by the guides and instructions for combining multiple cycles.Note 11, Note 16, Note 17, Note 18, Note 19 Satterthwaite-adjusted F statistics were used to determine the significance of model parameters.
Results
The population profile of individuals surpassing the risk threshold was examined for WHR and each of the potential replacement measures (Chart 1). The proportion of the population surpassing risk thresholds increased with age for all measures (p < 0.001). Profiles for WHR and WHtR increased more steeply in males than in females, a contrast that was less evident for other measures, which tended to exhibit more similar increases with age. WHR correlated more closely with WC (0.76, 95% confidence interval [CI] 0.74 to 0.78) than with WHtR (0.68, 95% CI 0.66 to 0.70) or BMI (0.50, 95% CI 0.47 to 0.53). Within each sex, however, similar correlations were observed between WHR and each of WC and WHtR, i.e., for males, 0.82 (95% CI 0.80 to 0.84) and 0.85 (95% CI 0.84 to 0.87), respectively, and for females, 0.71 (95% CI 0.69 to 0.74) and 0.73 (95% CI 0.71 to 0.75), respectively. Correlations between WHR and BMI remained lower in sex-stratified analyses (0.64, 95% CI 0.62 to 0.67 for males; 0.48, 95% CI 0.44 to 0.51 for females).
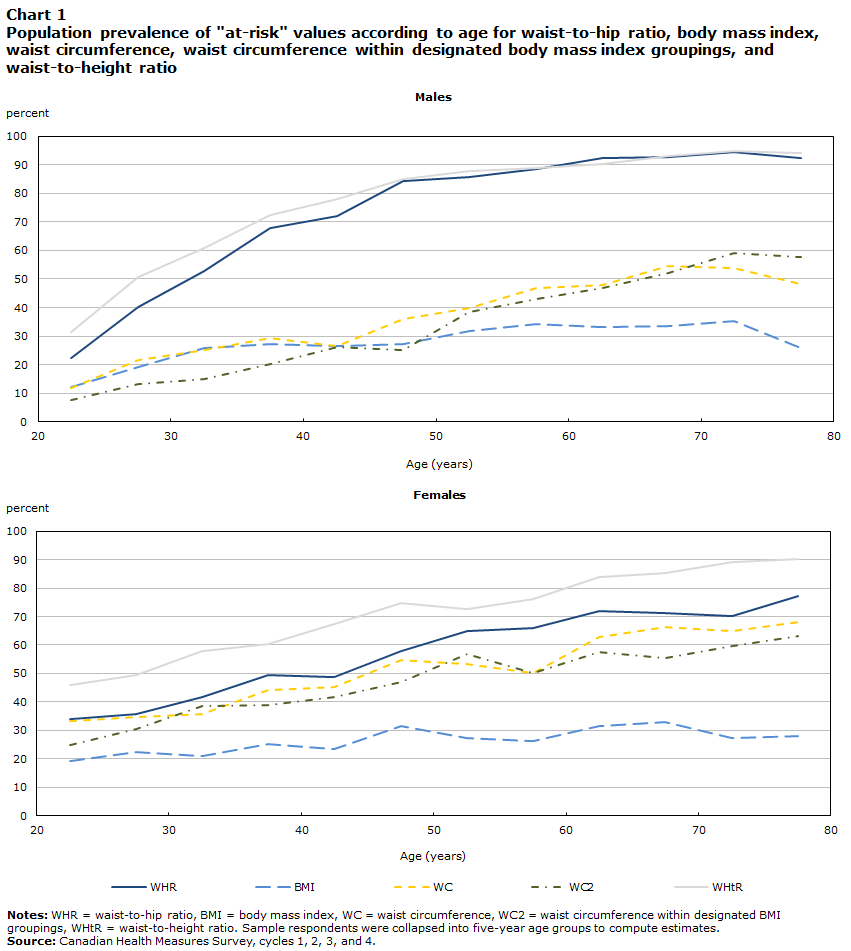
Description of Chart 1
| Age | WHR | BMI | WC | WC2 | WHtR |
|---|---|---|---|---|---|
| percent | |||||
| Males | |||||
| 22.5 | 22.280 | 12.287 | 11.933 | 7.463 | 31.527 |
| 27.5 | 40.257 | 19.293 | 21.501 | 13.288 | 50.719 |
| 32.5 | 52.637 | 25.738 | 24.974 | 15.103 | 60.731 |
| 37.5 | 68.040 | 27.279 | 29.450 | 20.347 | 72.426 |
| 42.5 | 72.176 | 26.420 | 26.406 | 26.263 | 78.194 |
| 47.5 | 84.175 | 27.226 | 36.006 | 25.283 | 85.002 |
| 52.5 | 85.824 | 31.934 | 39.708 | 38.548 | 88.022 |
| 57.5 | 88.641 | 34.074 | 46.880 | 43.024 | 88.904 |
| 62.5 | 92.321 | 33.231 | 47.832 | 46.743 | 90.341 |
| 67.5 | 92.882 | 33.658 | 54.434 | 52.034 | 93.230 |
| 72.5 | 94.345 | 35.246 | 53.752 | 59.129 | 94.892 |
| 77.5 | 92.504 | 25.950 | 48.221 | 57.856 | 94.327 |
| Females | |||||
| 22.5 | 34.022 | 19.282 | 33.119 | 24.895 | 45.864 |
| 27.5 | 35.822 | 22.204 | 34.657 | 30.391 | 49.492 |
| 32.5 | 41.586 | 20.978 | 35.819 | 38.693 | 57.853 |
| 37.5 | 49.381 | 25.339 | 44.039 | 39.069 | 60.377 |
| 42.5 | 48.740 | 23.329 | 45.220 | 41.672 | 67.258 |
| 47.5 | 57.724 | 31.360 | 54.802 | 46.894 | 74.588 |
| 52.5 | 64.979 | 27.392 | 53.441 | 56.861 | 72.578 |
| 57.5 | 65.821 | 26.254 | 50.093 | 50.074 | 76.008 |
| 62.5 | 72.089 | 31.400 | 62.653 | 57.667 | 83.842 |
| 67.5 | 71.353 | 32.832 | 66.275 | 55.266 | 85.198 |
| 72.5 | 70.222 | 27.320 | 64.814 | 59.710 | 89.290 |
| 77.5 | 77.214 | 27.923 | 68.028 | 63.184 | 90.304 |
|
Notes: WHR = waist-to-hip ratio; BMI = body mass index; WC = waist circumference; WC2 = waist circumference within designated BMI groupings; WHtR = waist-to-height ratio. Sample respondents were collapsed into five-year age groups to compute estimates. Source: Canadian Health Measures Survey cycles 1 to 4. |
|||||
Next, the percentage of individuals in the sample who would be differentially classified as “at risk” by replacing WHR was assessed for each of the potential replacement variables. When computing 0 and 1 values using clinically determined risk thresholds, the percentages of values that disagreed with WHR were 15% for WHtR, 29% for WC, 33% for WC2, and 43% for BMI. Similarly, when empirically determined risk thresholds were used, the percentages of values that disagreed with WHR were 17% for WHtR, 18% for WC, 24% for WC2, and 24% for BMI.
Because dichotomous “at-risk” classifications do not provide insight into how close an individual’s measured value was to the risk threshold, the difference in percentile scores between WHR and each of the replacement variables was examined (Figure 1). The middle 50% of individuals was closest to a percentile difference of zero for WHtR and WC, with a broader range evident for the other two measures.
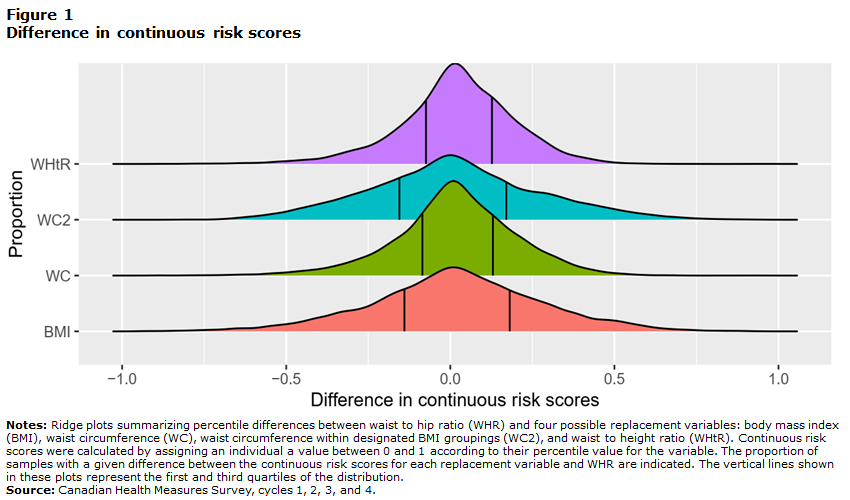
Description of Figure 1
This figure shows ridge plots summarizing percentile differences between waist-to-hip ratio (WHR) and four possible replacement variables: body mass index (BMI), waist circumference (WC), waist circumference within designated BMI groupings (WC2), and waist-to-height ratio (WHtR). Continuous risk scores were calculated by assigning an individual a value between 0 and 1 according to their percentile value for the variable. The proportions of samples with a given difference between the continuous risk scores for each replacement variable and WHR are indicated. The vertical lines shown in these plots represent the first and third quartiles of the distribution.
All distributions are symmetrical curves centred at 0. The BMI and WC2 distributions are flatter, and the first and third quartiles shown on the plot with vertical lines are more distant from each other than for the two other distributions. The distributions for WC and WHtR are steeper around 0, and the difference between the first and third quartile is smaller.
To examine the effect of WHR substitution at the population level, allostatic load indexes were generated using each of the measures, and their profiles were compared as a function of age (Chart 2). Allostatic load constructs showed some differences in profile when determined according to clinical cut-offs, notably a steeper rise and generally higher scores when WHR was used, a profile most closely followed when the replacement variable was WHtR (Chart 2, left). These observations held true for analyses conducted on sex-specific profiles (data not shown), which exhibited sex-dependent differences in profile—a levelling off in older males not observed in older females—as previously described.Note 7 Allostatic load profiles generated with empirically defined cut-offs were very similar across constructs (Chart 2, right), and this again held true for analyses conducted for each sex separately (not shown).
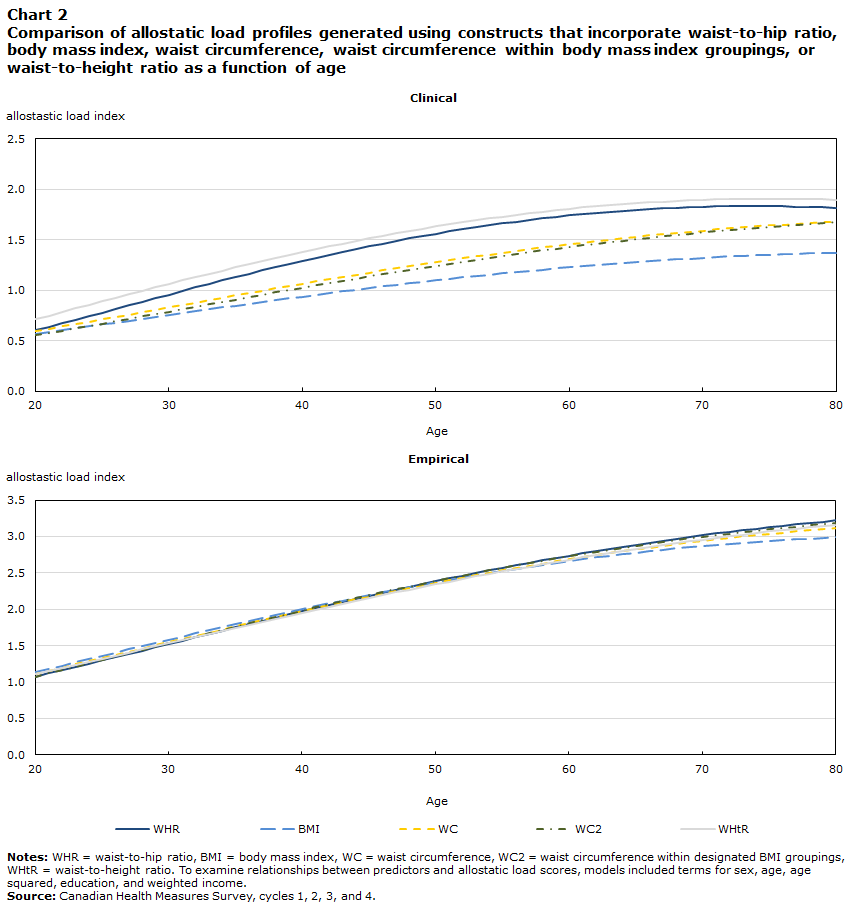
Description of Chart 2
| Age | Clinical | Empirical | ||||||||
|---|---|---|---|---|---|---|---|---|---|---|
| WHR | BMI | WC | WC2 | WHtR | WHR | BMI | WC | WC2 | WHtR | |
| allostastic load index | ||||||||||
| 20 | 0.602 | 0.568 | 0.596 | 0.553 | 0.715 | 1.074 | 1.138 | 1.113 | 1.075 | 1.110 |
| 21 | 0.636 | 0.586 | 0.619 | 0.575 | 0.750 | 1.118 | 1.182 | 1.155 | 1.120 | 1.152 |
| 22 | 0.671 | 0.605 | 0.642 | 0.598 | 0.785 | 1.162 | 1.226 | 1.198 | 1.165 | 1.193 |
| 23 | 0.706 | 0.624 | 0.665 | 0.622 | 0.820 | 1.207 | 1.270 | 1.242 | 1.210 | 1.235 |
| 24 | 0.742 | 0.642 | 0.688 | 0.645 | 0.855 | 1.252 | 1.315 | 1.285 | 1.256 | 1.278 |
| 25 | 0.778 | 0.661 | 0.712 | 0.669 | 0.890 | 1.297 | 1.359 | 1.329 | 1.302 | 1.320 |
| 26 | 0.814 | 0.680 | 0.735 | 0.692 | 0.925 | 1.342 | 1.404 | 1.373 | 1.348 | 1.363 |
| 27 | 0.850 | 0.699 | 0.759 | 0.716 | 0.960 | 1.388 | 1.448 | 1.417 | 1.394 | 1.405 |
| 28 | 0.886 | 0.718 | 0.783 | 0.740 | 0.994 | 1.433 | 1.492 | 1.460 | 1.440 | 1.448 |
| 29 | 0.922 | 0.737 | 0.807 | 0.764 | 1.029 | 1.479 | 1.537 | 1.504 | 1.486 | 1.491 |
| 30 | 0.957 | 0.755 | 0.831 | 0.788 | 1.063 | 1.525 | 1.581 | 1.548 | 1.532 | 1.534 |
| 31 | 0.993 | 0.774 | 0.854 | 0.812 | 1.097 | 1.570 | 1.624 | 1.592 | 1.578 | 1.577 |
| 32 | 1.028 | 0.793 | 0.878 | 0.836 | 1.130 | 1.616 | 1.668 | 1.635 | 1.624 | 1.619 |
| 33 | 1.062 | 0.811 | 0.902 | 0.860 | 1.163 | 1.661 | 1.711 | 1.679 | 1.670 | 1.662 |
| 34 | 1.097 | 0.830 | 0.926 | 0.884 | 1.195 | 1.706 | 1.754 | 1.722 | 1.715 | 1.704 |
| 35 | 1.131 | 0.848 | 0.949 | 0.908 | 1.227 | 1.752 | 1.796 | 1.765 | 1.761 | 1.747 |
| 36 | 1.164 | 0.866 | 0.973 | 0.932 | 1.259 | 1.796 | 1.839 | 1.807 | 1.806 | 1.789 |
| 37 | 1.197 | 0.884 | 0.996 | 0.956 | 1.290 | 1.841 | 1.880 | 1.850 | 1.850 | 1.831 |
| 38 | 1.229 | 0.902 | 1.019 | 0.979 | 1.320 | 1.885 | 1.921 | 1.892 | 1.895 | 1.872 |
| 39 | 1.261 | 0.920 | 1.042 | 1.003 | 1.350 | 1.929 | 1.962 | 1.934 | 1.939 | 1.914 |
| 40 | 1.292 | 0.937 | 1.065 | 1.026 | 1.379 | 1.973 | 2.002 | 1.975 | 1.982 | 1.955 |
| 41 | 1.322 | 0.955 | 1.087 | 1.049 | 1.408 | 2.016 | 2.042 | 2.016 | 2.025 | 1.996 |
| 42 | 1.352 | 0.972 | 1.110 | 1.071 | 1.436 | 2.059 | 2.081 | 2.056 | 2.068 | 2.036 |
| 43 | 1.381 | 0.988 | 1.132 | 1.094 | 1.463 | 2.102 | 2.119 | 2.096 | 2.110 | 2.076 |
| 44 | 1.409 | 1.005 | 1.153 | 1.116 | 1.489 | 2.144 | 2.157 | 2.136 | 2.152 | 2.116 |
| 45 | 1.436 | 1.021 | 1.175 | 1.138 | 1.515 | 2.185 | 2.194 | 2.175 | 2.193 | 2.155 |
| 46 | 1.463 | 1.037 | 1.196 | 1.160 | 1.540 | 2.226 | 2.231 | 2.213 | 2.233 | 2.194 |
| 47 | 1.489 | 1.053 | 1.217 | 1.181 | 1.564 | 2.267 | 2.267 | 2.251 | 2.273 | 2.232 |
| 48 | 1.513 | 1.068 | 1.238 | 1.202 | 1.588 | 2.307 | 2.302 | 2.289 | 2.313 | 2.270 |
| 49 | 1.537 | 1.084 | 1.258 | 1.223 | 1.610 | 2.346 | 2.336 | 2.325 | 2.351 | 2.307 |
| 50 | 1.561 | 1.099 | 1.278 | 1.244 | 1.632 | 2.385 | 2.370 | 2.361 | 2.390 | 2.344 |
| 51 | 1.583 | 1.113 | 1.297 | 1.264 | 1.654 | 2.423 | 2.403 | 2.397 | 2.427 | 2.381 |
| 52 | 1.604 | 1.127 | 1.317 | 1.284 | 1.674 | 2.461 | 2.435 | 2.432 | 2.464 | 2.416 |
| 53 | 1.625 | 1.141 | 1.335 | 1.303 | 1.693 | 2.498 | 2.466 | 2.466 | 2.500 | 2.452 |
| 54 | 1.644 | 1.155 | 1.354 | 1.322 | 1.712 | 2.534 | 2.497 | 2.500 | 2.535 | 2.486 |
| 55 | 1.663 | 1.168 | 1.372 | 1.341 | 1.730 | 2.569 | 2.527 | 2.533 | 2.570 | 2.521 |
| 56 | 1.681 | 1.181 | 1.389 | 1.360 | 1.747 | 2.604 | 2.556 | 2.565 | 2.604 | 2.554 |
| 57 | 1.698 | 1.193 | 1.407 | 1.377 | 1.763 | 2.639 | 2.584 | 2.597 | 2.637 | 2.587 |
| 58 | 1.713 | 1.205 | 1.424 | 1.395 | 1.779 | 2.672 | 2.611 | 2.628 | 2.669 | 2.620 |
| 59 | 1.728 | 1.217 | 1.440 | 1.412 | 1.793 | 2.705 | 2.637 | 2.658 | 2.701 | 2.651 |
| 60 | 1.742 | 1.229 | 1.456 | 1.429 | 1.807 | 2.737 | 2.663 | 2.687 | 2.732 | 2.682 |
| 61 | 1.755 | 1.240 | 1.472 | 1.445 | 1.820 | 2.769 | 2.688 | 2.716 | 2.762 | 2.713 |
| 62 | 1.767 | 1.250 | 1.487 | 1.461 | 1.832 | 2.799 | 2.712 | 2.744 | 2.791 | 2.743 |
| 63 | 1.778 | 1.260 | 1.501 | 1.477 | 1.843 | 2.829 | 2.735 | 2.771 | 2.820 | 2.772 |
| 64 | 1.788 | 1.270 | 1.516 | 1.492 | 1.853 | 2.858 | 2.757 | 2.798 | 2.848 | 2.800 |
| 65 | 1.797 | 1.280 | 1.529 | 1.507 | 1.863 | 2.887 | 2.778 | 2.823 | 2.875 | 2.828 |
| 66 | 1.805 | 1.289 | 1.543 | 1.521 | 1.871 | 2.915 | 2.798 | 2.848 | 2.901 | 2.855 |
| 67 | 1.813 | 1.297 | 1.556 | 1.535 | 1.879 | 2.941 | 2.818 | 2.872 | 2.926 | 2.882 |
| 68 | 1.819 | 1.306 | 1.568 | 1.548 | 1.886 | 2.968 | 2.836 | 2.896 | 2.951 | 2.908 |
| 69 | 1.824 | 1.314 | 1.580 | 1.561 | 1.891 | 2.993 | 2.854 | 2.918 | 2.974 | 2.933 |
| 70 | 1.828 | 1.321 | 1.592 | 1.573 | 1.897 | 3.017 | 2.871 | 2.940 | 2.997 | 2.957 |
| 71 | 1.831 | 1.328 | 1.603 | 1.585 | 1.901 | 3.041 | 2.886 | 2.961 | 3.019 | 2.981 |
| 72 | 1.833 | 1.335 | 1.613 | 1.597 | 1.904 | 3.064 | 2.901 | 2.982 | 3.041 | 3.004 |
| 73 | 1.834 | 1.341 | 1.623 | 1.608 | 1.906 | 3.087 | 2.915 | 3.001 | 3.061 | 3.026 |
| 74 | 1.835 | 1.347 | 1.633 | 1.619 | 1.908 | 3.108 | 2.928 | 3.020 | 3.081 | 3.048 |
| 75 | 1.834 | 1.352 | 1.642 | 1.629 | 1.909 | 3.129 | 2.941 | 3.038 | 3.100 | 3.069 |
| 76 | 1.832 | 1.357 | 1.651 | 1.638 | 1.908 | 3.148 | 2.952 | 3.055 | 3.118 | 3.089 |
| 77 | 1.829 | 1.361 | 1.659 | 1.648 | 1.907 | 3.167 | 2.962 | 3.071 | 3.135 | 3.109 |
| 78 | 1.825 | 1.365 | 1.667 | 1.656 | 1.905 | 3.186 | 2.972 | 3.087 | 3.151 | 3.128 |
| 79 | 1.821 | 1.369 | 1.674 | 1.664 | 1.902 | 3.203 | 2.980 | 3.101 | 3.167 | 3.146 |
| 80 | 1.815 | 1.372 | 1.681 | 1.672 | 1.899 | 3.220 | 2.988 | 3.115 | 3.181 | 3.163 |
|
Notes: WHR = waist-to-hip ratio; BMI = body mass index; WC = waist circumference; WC2 = waist circumference within designated BMI groupings; WHtR = waist-to-height ratio. Source: Canadian Health Measures Survey Cycles 1 to 4. |
||||||||||
As the binary aspect of binning individuals into “at-risk” categories may result in the degree of risk being lost, a continuous allostatic load score was created based on the sum of percentile values for all variables within each of the allostatic load constructs and compared with allostatic load scores generated using empirically defined risk thresholds (Figure 2). The continuous score was approximately normally distributed, even though the individual continuous scores were not normally distributed. As expected, continuous scores in the sample increased monotonically in relation to count-based scores (Figure 2). Profiles were highly similar for constructs that included WHR, WHtR, or WC; this was exemplified by the close overlap of the distribution of continuous scores for the constructs containing these measures (see Figure 2 inset). There was a notable spread of continuous allostatic load scores at each discrete allostatic load level that decreased with each count-based unit increase.
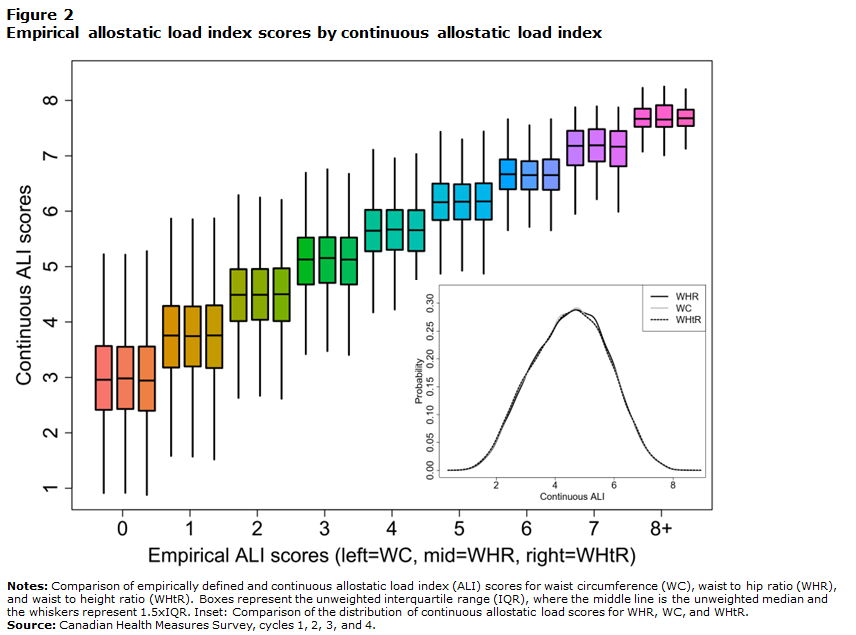
Description of Figure 2
This figure shows a comparison of empirically defined and continuous allostatic load index (ALI) scores for waist circumference (WC), waist-to-hip ratio (WHR), and waist-to-height ratio (WHtR). Boxes represent the unweighted interquartile range (IQR), where the middle line is the unweighted median and the whiskers represent 1.5×IQR. Inset: Comparison of the distribution of continuous allostatic load scores for WHR, WC, and WHtR.
The empirical ALI score goes from 0 to 8+. For each unit, three boxplots represent WC, WHR, and WHtR from left to right. All three boxplots for a given empirical score have a similar mean and distribution. The continuous ALI score goes from 1 to 8. A mean empirical score of 0 has a continuous score of 3. With each increase of the empirical ALI score, the continuous ALI score also increases. At an empirical score of 8+, the continuous ALI score reaches its maximum of 8. In the bottom-right corner, there is an inset that represents the distributions of continuous ALI for WHR, WC, and WHtR. Distributions are symmetrical, centered at 4.2 and bell-shaped. All distributions are fully overlapping.
Finally, because allostatic load scores tend to vary in relation to gradients in socioeconomic measures, relationships between educational attainment, household income, and allostatic load constructs that included WHR or each of the potential replacement variables were examined to verify whether associations were maintained. In general, regardless of the construct used or method of calculation (i.e., clinical or empirically defined thresholds, or continuous), allostatic load scores were inversely associated with education for males (all p < 0.05, except for clinical WC2, p = 0.11), and with both education and household income for females (all p < 0.05) (not shown).
Discussion
The findings of the present study indicate that the allostatic load index is robust to substitution of WHR by several other measures of obesity and to method of calculation, both in terms of the population profile and in relation to socioeconomic position, a surrogate of stressor exposure. WHtR emerged as the replacement variable that most closely followed the pattern of WHR. The newly generated index provides a harmonized approach that can be applied across all cycles of the CHMS to evaluate subclinical effects of behaviours and exposures on health.
Of the four replacement variables assessed in the present study, WHtR and WC were the most similar to WHR for maintaining “at-risk” categorization, and also in terms of percentile difference, i.e., how an individual is positioned in relation to the population as a whole. WHR, WC, and BMI have frequently been used in creating allostatic load scores: for example, in an assessment of 18 different allostatic load score formulations used with NHANES data, WHR, WC, and BMI were included in 7, 8, and 4 scores, respectively.Note 10 WHR, WHtR, and WC are all measures of central obesity; this is relevant to the allostatic load paradigm because stress—and release of the stress hormone cortisol—is associated with abdominal fat deposition.Note 20 This in turn is associated with increased risk of cardiometabolic disorders, such as hypertension, dyslipidemia, metabolic syndrome, and diabetes, and may be an independent predictor of cardiovascular disease regardless of BMI.Note 21 The World Health Organization’s expert assessment concluded that both WHR and WC were useful measures for predicting disease risk across populations, and that WC may be a more practical measure of abdominal fat because of relative ease of measurement.Note 22 Although less commonly used in allostatic load constructs, in recent years, WHtR has also been promoted as a simple and useful measure of central adiposity and predictor of cardiovascular disease.Note 9, Note 23
However, there were some notable differences in the risk profile for individual measures as a function of age within the Canadian population. This was particularly evident in males, where the prevalence of WHR and WHtR values that exceeded the clinical risk threshold increased rapidly and levelled off compared with a steadier and more uniform increase in the prevalence of at-risk values for WC and BMI. The data indicate that, at least in relation to age-related changes, WHtR followed a more similar profile to WHR than did other measures. It is worth noting that although WHtR was the replacement measure most similar to WHR across several analyses, many individuals (15% and 17% for clinical and empirically defined thresholds, respectively) shifted into or out of the risk category when assessed using one or the other measure. The implications of such shifts are unclear. While the relative importance of variable substitution on stressor–allostatic load score relationships may depend upon the extent to which the variable in question is specifically associated with the exposure or exposures of interest, the composite nature of the index may reduce impacts of substitution, as has been shown elsewhere.Note 5, Note 24, Note 25 Indeed, at the population level, the allostatic load profile as a function of age was broadly similar across measures, indicating that the various constructs continued to be sensitive to age-related changes. When constructed using sex-specific empirically defined cut-offs or continuous scores, allostatic load profiles for the population as a whole were virtually identical. The observation that the national allostatic load profile is fairly robust to changes in the composition of its component parts, whether determined through clinical or empirically defined cut-offs, supports the contention that this composite measure tracks cumulative effects associated with aging on multiple measures rather than reflecting the profile of a single measure.
Notably, use of continuous scores produced a significant range of allostatic load scores for each count-based score. This highlights a potential advantage of continuous scores, in that the variance could be informative if it relates to characteristics or exposures of interest. Results from previous studies have been mixed in terms of any advantages of continuous versus count-based scores. For example, a systematic comparison of 14 different scoring algorithms used previously to operationalize allostatic load found only marginal differences in the capacity to predict health outcomes.Note 26 Nevertheless, continuous scores, by virtue of maintaining to a greater degree the relative position of individuals within a population for each measure, may be useful in relating stressors to health outcomes. A consideration, then, is whether the composition of the allostatic load construct, or the method of calculation (count-based versus continuous), may have any import on associations with stressors or outcomes of interest. Lower socioeconomic position, as a surrogate for stressor exposure, has been frequently associated with higher allostatic load scores,Note 8 including in the Canadian population.Note 7 Significance of associations was maintained when using WHR, WHtR, or WC, indicating that, at least for associations between allostatic load scores and educational attainment or household income, the impact of variable substitution was minimal.
The present study uses a substantial dataset to establish a harmonized allostatic load index that can be applied across all cycles of the CHMS. Nevertheless, there are some limitations that apply generally to efforts to operationalize allostatic load. It remains unclear whether measures should be weighted differentially. While the present study employed an equal-weight approach that has been commonly applied elsewhere, recent efforts to identify measures that may be more or less influentialNote 27, Note 28 may provide important insight to guide future work in this area. The relative importance of measures may vary by age, sex, ethnicity, and other factors.Note 29 Accordingly, while the measures selected are consistent with those commonly used in large population surveys of allostatic load,Note 10 some may be more or less appropriate for certain populations.
Results from the present study show that WHtR may serve as a suitable replacement metabolic indicator for WHR, providing a harmonized allostatic load index that can be applied for studies across all cycles of the CHMS, as well as for comparison with other surveys that have collected similar measures. It is noteworthy that a recent study comparing the predictive capacity of various allostatic load formulations found that a construct employing five measures used in the present study—CRP, HR, HDL, HbA1c, and, notably, WHtR—predicted mortality at least as well as indexes with a greater number of measures.Note 30 Such findings suggest that the core measures employed in the present study and available across multiple surveys together provide a health-relevant measure for assessing effects of stressor exposure.
- Date modified: