
Health Reports
Sociodemographic differences in recreational screen time before and during the COVID-19 pandemic in Canada
by Stephanie Toigo, Marisol T. Betancourt, Stephanie A. Prince, Rachel C. Colley and Karen C. Roberts

DOI: https://www.doi.org/10.25318/82-003-x202400500001-eng
Abstract
Background
Over the last several years, recreational screen time has been increasing. During the COVID-19 pandemic, recreational screen time rose among Canadian youth and adults, and those who increased screen time had poorer self-reported mental health compared with those who decreased or maintained their recreational screen time levels.
Data and methods
Using data from the 2017, 2018, and 2021 Canadian Community Health Survey, the prevalence of meeting the recreational screen time recommendation from the Canadian 24-Hour Movement Guidelines was compared before and during the pandemic across sociodemographic groups. Logistic regression was used to identify sociodemographic groups that were more likely to meet the recreational screen time recommendation before and during the pandemic.
Results
The amount of time Canadians spent engaging in daily recreational screen time increased from 2018 to 2021, leading to fewer youth and adults meeting the recreational screen time recommendation during the pandemic compared with before. The prevalence of meeting the recommendation was lower during the pandemic compared with before the pandemic among almost all sociodemographic groups. Among youth, living in a rural area was associated with a greater likelihood of meeting the recommendation before and during the pandemic. Among adults, the following characteristics were all associated with a greater likelihood of meeting the recommendation during the pandemic: being female; living in a rural area or a small population centre; identifying as South Asian; being an immigrant to Canada; living in a two-parent household; being married or in a common-law relationship or widowed, separated, or divorced; working full time; and being a health care worker.
Interpretation
The prevalence of meeting the recreational screen time recommendation during the pandemic was lower overall compared with before the pandemic. Several sociodemographic groups were more likely to meet the recommendation during the pandemic. Continued surveillance of recreational screen time is necessary to monitor the indirect effects of the pandemic and to identify population subgroups that would benefit from tailored interventions in the pandemic recovery period.
Keywords
Youth, adults, older adults, screen time, COVID-19, sedentary behaviour
Authors
Stephanie Toigo, Marisol T. Betancourt, Stephanie A. Prince, and Karen C. Roberts are with the Centre for Surveillance and Applied Research at the Public Health Agency of Canada. Stephanie A. Prince is also with the University of Ottawa. Rachel C. Colley is with the Health Analysis Division at Statistics Canada.
What is already known on this subject?
- Research during the COVID-19 pandemic has shown that recreational screen time increased among both youth and adults, but most prominently among those aged 20 to 34 years.
- Behavioural changes arising from public health interventions during the pandemic (e.g., shutdowns and quarantines) may have contributed to an increase in recreational screen time.
What does this study add?
- The pandemic has had an indirect effect on sedentary behaviour among Canadians, and some groups have been more impacted than others.
- There was a significant decline in youth and adults meeting the recreational screen time recommendation during the pandemic compared with before the pandemic.
- Several sociodemographic characteristics were associated with an increased likelihood of meeting the recreational screen time recommendation during the pandemic.
Introduction
Canadians spend a significant proportion of their days engaging in sedentary behaviour.Note 1, Note 2Research has indicated that sedentary behaviour is a risk factor for many chronic conditions in adults, such as cardiovascular disease, diabetes mellitus, hypertension, obesity, some cancers, depression, and anxiety, and also contributes to all-cause mortality.Note 3, Note 4, Note 5, Note 6, Note 7 Similarly, among children and youth, higher levels of sedentary behaviour are associated with markers of adiposity and cardiometabolic risk, decreased fitness, and lower scores for self-esteem and pro-social behaviour.Note 8, Note 9 Over the last several years, self-reported data on recreational screen time have shown increasing trends across all age groups.Note 10, Note 11
According to pre-COVID-19 pandemic estimates, Canadian adults spent approximately 3.2 hours a day and youth spent 3.8 hours a day engaging in recreational screen time, both of which are higher than the recommendation outlined in the Canadian 24-Hour Movement Guidelines (24-H Guidelines).Note 2, Note 10 The 24-H Guidelines provide recommendations for children and youth and adults on how to balance physical activity, sedentary behaviour, and sleep over a 24-hour period to optimize health.Note 12, Note 13, Note 14 The 24-H Guidelines recommend that recreational screen time be limited to no more than two hours per day among children and youth aged 5 to 17 years,Note 12 and no more than three hours per day among adults aged 18 years and older.Note 13, Note 13
The pandemic posed many challenges for Canadians, including disruptions to daily life. At the height of the pandemic, many Canadians were directed to carry out their usual activities from home, which included working, schooling, exercising, and socializing. Studies conducted during the pandemic have shown that among Canadian youth and adults, recreational screen time increased, possibly attributable to behavioural changes arising from public health interventions (e.g., shutdowns and quarantines).Note 15 This increase in recreational screen time was most apparent among those aged 20 to 34 years.Note 15 Before the pandemic, 73% of children and 31% of youth met the recreational screen time recommendation.Note 2 During the pandemic, nearly 80% of parents reported increased screen time among children and youth compared with before the pandemic.Note 16 Adults who decreased or maintained recreational screen time during the pandemic were more likely to report “very good” or “excellent” physical and mental health compared with those who increased screen time.Note 15
From a population-based surveillance perspective, it is important to understand the indirect effects that the pandemic has had on sedentary behaviour. Detailed information on which sociodemographic groups experienced the greatest increase in recreational screen time during the pandemic will help support the development of targeted policies and programs for population groups that may need additional support in the pandemic recovery period.Note 17 Additionally, there is minimal published research in Canada investigating sociodemographic differences in recreational screen time recommendation adherence; therefore, this study will address this evidence gap. The objective of this study was to use nationally representative survey data to compare recreational screen time behaviours before (2018) and during (2021) the pandemic, while contrasting between sociodemographic subgroups of the Canadian population.
Data and methods
Data source
This work used the 2017, 2018, and 2021 years of the Canadian Community Health Survey (CCHS), a national cross-sectional survey that collects information related to health, health determinants, and health care utilization for the Canadian population.Note 18, Note 19 The 2018 and 2021 CCHS were used as points in time before the pandemic and during the pandemic, respectively, whereas the 2017 CCHS was used to assess the stability of recreational screen time before the pandemic. The CCHS covers the Canadian population aged 12 years and older living in the 10 provinces and three territorial capitals. People living on reserves and other Indigenous settlements in the provinces, full-time Canadian Forces members, the population residing in institutions, and children who are living in foster care were not included in the sampling frame (less than 3% of the population). Statistics Canada uses the Canada Child Benefit and the Labour Force Survey as the area frame to sample dwellings, after which a child or an adult from that dwelling is selected as the survey respondent. Data from the territories were collected on the CCHS; however, because of smaller sample sizes, Statistics Canada releases these data only after two consecutive years of collection (for example, 2021 and 2022). Therefore, since this analysis included only single years from the CCHS, territorial data were not available for this study. The CCHS response rates for 2017, 2018, and 2021 were 62.8%, 58.8%, and 24.1%, respectively.
The 2021 CCHS differed from the 2017 and 2018 CCHS in terms of survey collection method by conducting all interviews by phone. Additionally, collection periods were delayed for 2021, and fewer interviewers were available, resulting in a decrease in the response rates. However, Statistics Canada ensured that survey weights were adjusted, and extensive validation of survey estimates was conducted to minimize any potential bias or seasonality that could arise from survey non-response and delayed data collection.Note 18, Note 19
The 2017, 2018, and 2021 CCHS were selected to provide estimates for before the pandemic and during the pandemic, since these survey years had sedentary behaviour content for both youth and adults as core content for all provinces, whereas in 2019 and 2020, this was optional content with data available only for a few provinces.
Measures
Recreational screen time
To assess recreational screen time, two questions were asked to respondents: (1) “On a school or work day, how much of your free time did you spend watching television or a screen on any electronic device while sitting or lying down?” and (2) “On a day that was not a school or work day, how much of your free time did you spend watching television or a screen on any electronic device while sitting or lying down?” Response options were 2 hours or less per day, more than 2 hours but less than 4 hours, 4 hours to less than 6 hours, 6 hours to less than 8 hours, 8 hours or more per day, valid skip, don’t know, refusal, and not stated.
Adherence to the 24-H Guidelines’ recreational screen time recommendation was assessed as an average of two hours or less per day among youth (12 to 17 years) and three hours or less per day among adults (18 years and older).Note 12, Note 13, Note 14 Since the response options in the CCHS do not directly align with the recreational screen time recommendation cut-offs, the categorical responses were recoded using an approximate midpoint estimate into one hour, three hours, five hours, seven hours, or eight hours per day. Average daily recreational screen time was then calculated as a weighted average of screen time on work or school days (assumed five days per week) and non-work or school days (assumed two days per week). Previous Canadian research using national health surveys has also used midpoint estimates when response options did not directly align with the recommendation.Note 10, Note 20
Respondents who did not work at a job or business in the past 12 months or were not currently enrolled in school were not asked the question about recreational screen time behaviours on a work or school day. For these respondents, as well as those who did not respond to the work or school day question, adherence to the recreational screen time recommendation was assessed using only their response for non-work or school days. For respondents who did not respond to the question about recreational screen time on non-work or school days, their response for work or school days was used to assess the recreational screen time recommendation adherence. Respondents who did not have a valid response for either question were excluded (2018: n=188; 2021: n=147).
Henceforth, the recreational screen time recommendation will be referred to as “the recommendation.”
Sociodemographic characteristics
Sociodemographic characteristics included age group (12 to 17, 18 to 34, 35 to 64, 65 and older), place of residence (rural area, small population centre, medium population centre, large population centre), racialized group membership (yes [self-identified as Black, East or Southeast Asian, South Asian, West Asian or Arab, Latin American, or other or multiple racial groups], no [self-identified as White only]), immigrant status (immigrant to Canada, non-immigrant), Indigenous identity (yes [self-identified as First Nations, Métis, or Inuit], no [non-Indigenous]), highest level of household education (secondary school education or less, postsecondary diploma or university degree), household income adequacy (quintiles [income adequacy is the adjusted ratio of the total household income to the low-income cut-off for the size of the family and community]), living arrangement (living alone or with a spouse or partner, two-parent household, one-parent household, other [living arrangement not specified above, for example, a child living with a relative other than parents]), marital status (married or common-law; widowed, separated, or divorced; single, never married), work status (full-time [30 hours or more per week], part-time [less than 30 hours per week]), occupation (non-health out-of-home workers, desk-based or home-based workers, health care workers).
For youth, disaggregation by First Nations, Métis, and Inuit identity was not possible because of small sample sizes; therefore, one aggregated category called “First Nations, Métis, or Inuit” is presented. Occupational groups were defined using occupation industry group codes and questions related to working from home during the pandemic. Using the 2021 CCHS, occupations were grouped into three categories based on which occupational groups most frequently worked from home, did not work from home, or worked in a health care-related occupation during the pandemic.Note 21 For comparison purposes, these three categories were replicated for the 2018 data.
Statistical analyses
The proportion of Canadians adhering to the age-specific recreational screen time recommendation before (2018) and during (2021) the pandemic was estimated for both years. Chi-square tests and non-overlapping confidence intervals were used to determine whether 2018 estimates were statistically different from 2021 estimates.
Logistic regression was used to identify subgroups that were more or less likely to meet the recommendation in each year. Univariate models (unadjusted) were used to assess the association between each sociodemographic characteristic and meeting the recommendation. Multivariate models (adjusted) controlling for province were used to account for any variation in pandemic responses across provinces. Assumptions of logistic regression have been met, including independent observations, no multicollinearity among independent variables, no significant outliers, and a large sample size.
Where comparable data were available, a sensitivity analysis was conducted to determine the amount of variation in recommendation adherence in the years before the pandemic (i.e., 2017 and 2018).
SAS Enterprise Guide version 7.1 (SAS Institute Inc., Cary, North Carolina, United States) was used to carry out the analyses. Estimates were weighted using sampling weights provided by Statistics Canada to account for the complex survey design. Bootstrap weights were used to calculate coefficients of variation, standard errors, and 95% confidence intervals. Statistically significant results are identified when p-values were less than 0.05.
Results
The distribution of sociodemographic variables for the 2018 and 2021 CCHS is presented in Table 1.
| Sociodemographic characteristics | 2018 CCHS (N=50,624) | 2021 CCHS (N=44,092) | ||||
|---|---|---|---|---|---|---|
| % | 95% confidence interval |
% | 95% confidence interval |
|||
| from | to | from | to | |||
| Province | ||||||
| Newfoundland and Labrador | 1.5 | 1.4 | 1.6 | 1.4 | 1.3 | 1.5 |
| Prince Edward Island | 0.4 | 0.4 | 0.5 | 0.4 | 0.4 | 0.5 |
| Nova Scotia | 2.6 | 2.5 | 2.8 | 2.6 | 2.5 | 2.8 |
| New Brunswick | 2.1 | 1.9 | 2.2 | 2.1 | 1.9 | 2.2 |
| Quebec | 23.0 | 22.7 | 23.4 | 22.6 | 22.2 | 23.0 |
| Ontario | 39.3 | 38.9 | 39.7 | 39.4 | 38.9 | 39.9 |
| Manitoba | 3.4 | 3.2 | 3.6 | 3.4 | 3.2 | 3.5 |
| Saskatchewan | 2.9 | 2.8 | 3.1 | 2.9 | 2.7 | 3.0 |
| Alberta | 11.5 | 11.2 | 11.8 | 11.4 | 11.1 | 11.7 |
| British Columbia | 13.3 | 13.0 | 13.6 | 13.8 | 13.5 | 14.2 |
| Sex | ||||||
| Female | 50.6 | 50.2 | 51.0 | 50.5 | 50.1 | 51.0 |
| Male | 49.4 | 49.0 | 49.8 | 49.5 | 49.0 | 49.9 |
| Age, years | ||||||
| 12 to 17 | 7.2 | 6.9 | 7.4 | 7.4 | 7.1 | 7.6 |
| 18 to 34 | 26.4 | 26.0 | 26.8 | 26.0 | 25.6 | 26.4 |
| 35 to 64 | 47.1 | 46.6 | 47.5 | 45.9 | 45.4 | 46.4 |
| 65 and older | 19.4 | 19.0 | 19.7 | 20.8 | 20.4 | 21.1 |
| Place of residence | ||||||
| Rural area | 17.2 | 16.6 | 17.7 | 17.3 | 16.8 | 17.7 |
| Small population centre | 12.1 | 11.6 | 12.7 | 12.2 | 11.8 | 12.6 |
| Medium population centre | 9.5 | 9.0 | 10.0 | 9.1 | 8.8 | 9.5 |
| Large urban population centre | 61.2 | 60.6 | 61.9 | 61.4 | 60.9 | 61.9 |
| Racialized groupTable 1 Note † | ||||||
| Yes | 24.3 | 23.5 | 25.2 | 26.1 | 25.1 | 27.2 |
| No | 75.7 | 74.8 | 76.5 | 73.9 | 72.8 | 74.9 |
| Racialized group—multiple categoriesTable 1 Note † | ||||||
| Black | 3.3 | 2.9 | 3.7 | 3.5 | 3.1 | 3.9 |
| East or Southeast Asian | 8.6 | 8.0 | 9.3 | 9.8 | 9.2 | 10.4 |
| South Asian | 5.5 | 5.0 | 6.0 | 6.3 | 5.8 | 6.9 |
| West Asian or Arab | 2.5 | 2.2 | 2.9 | 3.1 | 2.7 | 3.5 |
| Latin American | 1.6 | 1.4 | 1.8 | 1.9 | 1.7 | 2.2 |
| Other or multiple racialized groups | 2.8 | 2.5 | 3.2 | 1.5 | 1.2 | 1.8 |
| Non-racialized (White only) | 75.7 | 74.8 | 76.5 | 73.9 | 72.8 | 74.9 |
| Immigrant status | ||||||
| Yes | 27.3 | 26.5 | 28.1 | 27.8 | 26.9 | 28.8 |
| No | 72.7 | 71.9 | 73.5 | 72.2 | 71.2 | 73.1 |
| Indigenous identity | ||||||
| First NationsTable 1 Note ‡ | 2.6 | 2.3 | 2.9 | 2.3 | 2.1 | 2.6 |
| Métis | 2.1 | 1.7 | 2.3 | 2.0 | 1.8 | 2.3 |
| Inuit | 0.1Note E: Use with caution | 0.0 | 0.1 | 0.1Note E: Use with caution | 0.0 | 0.1 |
| Non-Indigenous | 95.3 | 94.9 | 95.6 | 95.6 | 95.2 | 95.9 |
| Highest level of household educational attainment | ||||||
| Secondary school education or less | 19.1 | 18.5 | 19.7 | 15.5 | 14.9 | 16.1 |
| Postsecondary diploma or university degree | 80.9 | 80.3 | 81.5 | 84.5 | 83.9 | 85.1 |
| Household income adequacy quintile | ||||||
| Quintile 1 (lowest) | 20.0 | 19.4 | 20.6 | 20.0 | 19.3 | 20.6 |
| Quintile 2 | 20.0 | 19.4 | 20.6 | 20.0 | 19.2 | 20.7 |
| Quintile 3 | 19.9 | 19.3 | 20.5 | 20.0 | 19.3 | 20.7 |
| Quintile 4 | 20.2 | 19.6 | 20.8 | 20.0 | 19.3 | 20.7 |
| Quintile 5 (highest) | 19.9 | 19.3 | 20.5 | 20.0 | 19.4 | 20.7 |
| Living arrangement | ||||||
| Living alone or with a spouse or partner | 46.5 | 45.4 | 47.6 | 44.9 | 43.6 | 46.3 |
| Two-parent household | 37.2 | 36.3 | 38.1 | 38.3 | 37.3 | 39.2 |
| One-parent household | 8.6 | 8.2 | 9.0 | 8.3 | 7.9 | 8.8 |
| Other | 7.8 | 7.1 | 8.4 | 8.5 | 7.6 | 9.4 |
| Marital status | ||||||
| Married or common-law | 58.2 | 57.4 | 58.9 | 56.9 | 56.1 | 57.7 |
| Widowed, separated, or divorced | 11.7 | 11.3 | 12.2 | 11.5 | 11.0 | 12.0 |
| Single, never married | 30.1 | 29.5 | 30.7 | 31.6 | 31.0 | 32.3 |
| Work statusTable 1 Note § | ||||||
| Full-time | 83.3 | 82.6 | 84.0 | 83.5 | 82.6 | 84.4 |
| Part-time | 16.7 | 16.0 | 17.4 | 16.5 | 15.6 | 17.4 |
| Occupational group | ||||||
| Desk-based or home-based workers | 23.9 | 23.0 | 24.8 | 26.5 | 25.4 | 27.7 |
| Non-health care out-of-home workers | 62.8 | 61.8 | 63.8 | 59.5 | 58.2 | 60.8 |
| Health care workers | 13.4 | 12.7 | 14.0 | 14.0 | 13.2 | 14.8 |
E use with caution
Source: Canadian Community Health Survey, 2018 and 2021. |
||||||
Recreational screen time recommendation adherence in youth before versus during the pandemic
The absolute percentage of youth meeting the recommendation significantly decreased by 10.9 percentage points from before to during the pandemic (32.7% in 2018 versus 21.8% in 2021) (Table 2). A significant decrease in the percentage of youth meeting the recommendation in 2021 compared with 2018 was observed among those living in Nova Scotia, New Brunswick, Ontario, Saskatchewan, Alberta, and British Columbia; those living in a rural area, small population centre, and large population centre; those identifying as Black or non-racialized (White only); First Nations people, Métis, Inuit, and non-Indigenous people; those who are immigrants to Canada and non-immigrants; those living in the first, fourth, or fifth household income quintiles; those living in households with a higher education level; and those living in a two-parent household, one-parent household, or other living arrangements. Among youth, the prevalence of meeting the recommendation did not significantly change in 2021 compared with 2018 for those who identified as East or Southeast Asian, South Asian, or West Asian or Arab; those living in a household with a lower level of completed education; those in the second and third household income quintiles; and those living in a medium population centre.
| Sociodemographic characteristics | Percentage meeting recommendation before the pandemic (2018 CCHS) N= 3,736 |
Percentage meeting recommendation during the pandemic (2021 CCHS) N= 3,267 |
Percentage point difference |
||||||
|---|---|---|---|---|---|---|---|---|---|
| % | 95% confidence interval |
% | 95% confidence interval |
Percentage point |
95% confidence interval |
||||
| from | to | from | to | from | to | ||||
| Overall | 32.7 | 30.6 | 34.8 | 21.8 | 19.8 | 23.8 | -10.9Note * | -13.8 | -7.9 |
| School or work day | 40.6 | 38.3 | 43.0 | 28.9 | 26.5 | 31.3 | -11.7Note * | -15.1 | -8.4 |
| Non-school or work day | 20.8 | 19.0 | 22.6 | 12.9 | 11.2 | 14.8 | -7.9Note * | -10.4 | -5.3 |
| Province | |||||||||
| Newfoundland and Labrador | 32.3Note E: Use with caution | 23.0 | 42.7 | 22.7Note E: Use with caution | 12.4 | 36.1 | -9.6Note E: Use with caution | -24.5 | 5.4 |
| Prince Edward Island | 33.0Note E: Use with caution | 21.7 | 46.0 | 35.7Note E: Use with caution | 23.3 | 49.6 | 2.7Note E: Use with caution | -14.0 | 19.4 |
| Nova Scotia | 41.6 | 32.8 | 50.8 | 22.4Note E: Use with caution | 14.9 | 31.5 | -19.2Note E: Use with caution Note * | -31.3 | -7.1 |
| New Brunswick | 42.3 | 32.5 | 52.5 | 22.8Note E: Use with caution | 13.1 | 35.2 | -19.5Note E: Use with caution Note * | -33.8 | -5.1 |
| Quebec | 28.9 | 25.1 | 32.9 | 24.6 | 20.5 | 29.1 | -4.3 | -10.1 | 1.5 |
| Ontario | 32.0 | 28.1 | 36.1 | 17.2 | 13.7 | 21.3 | -14.8Note * | -20.2 | -9.3 |
| Manitoba | 30.1 | 22.8 | 38.2 | 22.7Note E: Use with caution | 15.8 | 30.9 | -7.4Note E: Use with caution | -17.8 | 3.0 |
| Saskatchewan | 36.0 | 27.9 | 44.7 | 23.3Note E: Use with caution | 15.7 | 32.4 | -12.7Note E: Use with caution Note * | -24.1 | -1.3 |
| Alberta | 37.0 | 31.4 | 42.9 | 28.0 | 21.9 | 34.7 | -9.0Note * | -17.6 | 0.0 |
| British Columbia | 33.5 | 27.9 | 39.4 | 23.4 | 18.9 | 28.3 | -10.1Note * | -17.7 | -2.6 |
| Sex | |||||||||
| Female | 36.9 | 33.7 | 40.2 | 22.0 | 19.3 | 25.0 | -14.8Note * | -19.2 | -10.5 |
| Male | 28.7 | 26.0 | 31.5 | 21.5 | 18.7 | 24.6 | -7.2Note * | -11.2 | -3.2 |
| Place of residence | |||||||||
| Rural area | 40.1 | 36.2 | 44.2 | 27.2 | 23.5 | 31.2 | -12.9Note * | -18.2 | -7.6 |
| Small population centre | 36.3 | 31.4 | 41.4 | 21.8 | 17.5 | 26.5 | -14.5Note * | -21.2 | -7.9 |
| Medium population centre | 29.1 | 24.0 | 34.5 | 23.1 | 17.8 | 29.1 | -6.0 | -13.6 | 1.6 |
| Large urban population centre | 30.1 | 27.0 | 33.2 | 20.0 | 17.2 | 23.0 | -10.1Note * | -14.3 | -5.8 |
| Racialized groupTable 2 Note † | |||||||||
| Yes | 27.9 | 23.6 | 32.6 | 19.8 | 16.0 | 24.2 | -8.1Note * | -14.1 | -2.1 |
| No | 34.6 | 32.1 | 37.1 | 23.2 | 20.9 | 25.7 | -11.4Note * | -14.9 | -7.8 |
| Racialized group—multiple categoriesTable 2 Note † | |||||||||
| Black | 24.2Note E: Use with caution | 15.4 | 34.8 | 10.9Note E: Use with caution | 6.0 | 17.7 | -13.3Note E: Use with caution Note * | -24.3 | -2.4 |
| East or Southeast Asian | 26.0Note E: Use with caution | 18.5 | 34.8 | 22.1Note E: Use with caution | 13.7 | 32.6 | -3.9Note E: Use with caution | -16.0 | 8.3 |
| South Asian | 33.7Note E: Use with caution | 23.5 | 45.0 | 22.7Note E: Use with caution | 14.7 | 32.4 | -11Note E: Use with caution | -23.9 | 2.0 |
| West Asian or Arab | 29.6Note E: Use with caution | 17.4 | 44.4 | 18.0Note E: Use with caution | 10.3 | 28.1 | -11.6Note E: Use with caution | -27.6 | 4.3 |
| Latin American | Note F: too unreliable to be published | Note F: too unreliable to be published | Note ...: not applicable | Note ...: not applicable | Note F: too unreliable to be published | Note ...: not applicable | Note ...: not applicable | ||
| Other or multiple racialized groups | 34.9Note E: Use with caution | 21.4 | 50.4 | Note F: too unreliable to be published | Note ...: not applicable | Note ...: not applicable | Note F: too unreliable to be published | Note ...: not applicable | Note ...: not applicable |
| Non-racialized (White only) | 34.6 | 32.1 | 37.1 | 23.2 | 20.9 | 25.7 | -11.4Note * | -14.9 | -7.8 |
| Immigrant status | |||||||||
| Yes | 28.1 | 22.1 | 34.7 | 17.9Note E: Use with caution | 12.7 | 24.2 | -10.2Note E: Use with caution Note * | -18.4 | -2.0 |
| No | 33.5 | 31.3 | 35.7 | 22.5 | 20.4 | 24.7 | -11.0Note * | -14.2 | -7.9 |
| Indigenous identity | |||||||||
| First Nations,Table 2 Note ‡ Métis, or Inuit | 31.7 | 25.3 | 38.8 | 18.0Note E: Use with caution | 11.8 | 25.6 | -13.8Note E: Use with caution Note * | -23.1 | -4.5 |
| Non-Indigenous | 33.7 | 31.3 | 36.0 | 22.9 | 20.7 | 25.2 | -10.8Note * | -14.1 | -7.4 |
| Highest level of household educational attainment | |||||||||
| Secondary school education or less | 29.1 | 24.2 | 34.5 | 21.6 | 16.6 | 27.4 | -7.5 | -14.9 | 0.0 |
| Postsecondary diploma or university degree | 33.1 | 30.7 | 35.5 | 22.1 | 19.9 | 24.4 | -11.0Note * | -14.3 | -7.7 |
| Household income adequacy quintile | |||||||||
| Quintile 1 (lowest) | 30.4 | 25.6 | 35.5 | 17.0 | 13.4 | 21.0 | -13.5Note * | -20.0 | -7.4 |
| Quintile 2 | 27.1 | 22.7 | 31.9 | 20.9 | 16.2 | 26.2 | -6.2 | -12.8 | 0.4 |
| Quintile 3 | 31.9 | 27.5 | 36.6 | 25.3 | 20.3 | 30.8 | -6.6 | -13.5 | 0.3 |
| Quintile 4 | 32.0 | 27.5 | 36.7 | 23.4 | 18.8 | 28.4 | -8.6Note * | -15.2 | -2.1 |
| Quintile 5 (highest) | 48.1 | 42.2 | 54.2 | 23.8 | 19.0 | 29.1 | -24.3Note * | -32.1 | -16.6 |
| Living arrangement | |||||||||
| Living alone or with a spouse or partner | Note F: too unreliable to be published | Note ...: not applicable | Note ...: not applicable | 31.8Note E: Use with caution | 15.1 | 52.8 | Note F: too unreliable to be published | Note ...: not applicable | Note ...: not applicable |
| Two-parent household | 35.4 | 32.9 | 38.1 | 23.5 | 21.0 | 26.0 | -11.9Note * | -15.7 | -8.3 |
| One-parent household | 23.9 | 19.9 | 28.2 | 17.0 | 13.2 | 21.3 | -6.9Note * | -12.5 | -1.2 |
| Other | 34.8 | 26.9 | 43.4 | 17.7Note E: Use with caution | 12.2 | 24.5 | -17.1Note E: Use with caution Note * | -27.0 | -7.2 |
|
... not applicable E use with caution F too unreliable to be published
Source: Canadian Community Health Survey, 2018 and 2021. |
|||||||||
Recreational screen time recommendation adherence among adults before versus during the pandemic
The percentage of adults meeting the recommendation significantly decreased by 9.2 percentage points from 71.4% in 2018 to 62.2% in 2021 (Table 3). Newfoundland and Labrador, Prince Edward Island, and Nova Scotia were the only provinces that did not exhibit a significant reduction in adherence to the recommendation during the pandemic. Almost all sociodemographic groups saw a significant decline in meeting the recommendation during the pandemic, except those who identified as West Asian or Arab, Latin American, other or multiple racialized groups, or Métis. A higher proportion of those identifying as Inuit met the recommendation during the pandemic compared with before the pandemic.
| Sociodemographic characteristics | Percentage meeting recommendation before the pandemic (2018 CCHS) N= 46,888 |
Percentage meeting recommendation during the pandemic (2021 CCHS) N= 40,825 |
Percentage point difference |
||||||
|---|---|---|---|---|---|---|---|---|---|
| % | 95% confidence interval |
% | 95% confidence interval |
Percentage point |
95% confidence interval |
||||
| from | to | from | to | from | to | ||||
| Overall | 71.4 | 70.7 | 72.1 | 62.2 | 61.3 | 63.0 | -9.2Note * | -10.3 | -8.2 |
| School or work day | 84.8 | 84.0 | 85.5 | 79.8 | 78.8 | 80.8 | -4.9Note * | -6.2 | -3.7 |
| Non-school or work day | 71.2 | 70.6 | 71.9 | 61.4 | 60.5 | 62.3 | -9.8Note * | -10.9 | -8.7 |
| Province | |||||||||
| Newfoundland and Labrador | 72.9 | 69.7 | 75.9 | 69.3 | 66.7 | 71.9 | -3.5 | -7.5 | 0.4 |
| Prince Edward Island | 72.1 | 68.4 | 75.6 | 68.9 | 65.2 | 72.4 | -3.2 | -8.1 | 1.7 |
| Nova Scotia | 68.5 | 65.7 | 71.1 | 65.3 | 62.5 | 67.9 | -3.2 | -6.9 | 0.5 |
| New Brunswick | 73.0 | 70.0 | 75.9 | 66.9 | 64.1 | 69.6 | -6.1Note * | -10.1 | -2.1 |
| Quebec | 72.6 | 71.2 | 73.9 | 62.9 | 61.1 | 64.7 | -9.7Note * | -11.9 | -7.4 |
| Ontario | 71.2 | 69.8 | 72.5 | 60.9 | 59.3 | 62.4 | -10.3Note * | -12.3 | -8.3 |
| Manitoba | 70.8 | 67.9 | 73.5 | 60.9 | 58.4 | 63.3 | -9.9Note * | -13.5 | -6.3 |
| Saskatchewan | 70.1 | 67.1 | 73.1 | 62.3 | 59.8 | 64.8 | -7.8Note * | -11.6 | -4.0 |
| Alberta | 70.0 | 68.0 | 72.0 | 61.8 | 59.7 | 64.0 | -8.2Note * | -11.0 | -5.3 |
| British Columbia | 71.8 | 70.1 | 73.5 | 63.0 | 60.7 | 65.3 | -8.8Note * | -11.5 | -6.1 |
| Sex | |||||||||
| Female | 74.1 | 73.2 | 75.0 | 64.1 | 62.9 | 65.3 | -10.0Note * | -11.4 | -8.6 |
| Male | 68.6 | 67.6 | 69.6 | 60.2 | 58.9 | 61.5 | -8.4Note * | -10.0 | -6.8 |
| Age group | |||||||||
| 18 to 34 | 63.4 | 61.7 | 65.0 | 51.6 | 49.5 | 53.6 | -11.8Note * | -14.3 | -9.3 |
| 35 to 64 | 77.9 | 76.9 | 78.8 | 70.2 | 69.0 | 71.4 | -7.7Note * | -9.1 | -6.3 |
| 65 and older | 66.6 | 65.3 | 67.8 | 57.7 | 56.4 | 59.1 | -8.9Note * | -10.7 | -7.0 |
| Place of residence | |||||||||
| Rural area | 76.0 | 74.8 | 77.2 | 68.4 | 67.0 | 69.9 | -7.6Note * | -9.4 | -5.7 |
| Small population centre | 71.7 | 70.1 | 73.3 | 64.1 | 62.2 | 65.9 | -7.6Note * | -10.1 | -5.2 |
| Medium population centre | 69.2 | 67.4 | 70.9 | 59.1 | 56.7 | 61.4 | -10.1Note * | -13.0 | -7.2 |
| Large urban population centre | 70.4 | 69.4 | 71.4 | 60.5 | 59.3 | 61.8 | -9.9Note * | -11.4 | -8.4 |
| Racialized groupTable 3 Note † | |||||||||
| Yes | 71.4 | 69.4 | 73.3 | 62.3 | 60.0 | 64.6 | -9.1Note * | -12.0 | -6.1 |
| No | 71.6 | 70.9 | 72.4 | 62.2 | 61.3 | 63.1 | -9.4Note * | -10.6 | -8.3 |
| Racialized group—multiple categoriesTable 3 Note † | |||||||||
| Black | 67.2 | 61.5 | 72.6 | 56.0 | 49.4 | 62.5 | -11.2Note * | -19.6 | -2.9 |
| East or Southeast Asian | 70.0 | 66.6 | 73.2 | 58.4 | 54.7 | 61.9 | -11.6Note * | -16.4 | -6.8 |
| South Asian | 75.6 | 71.0 | 79.8 | 69.1 | 64.1 | 73.8 | -6.5Note * | -12.9 | -0.1 |
| West Asian or Arab | 66.3 | 58.1 | 73.8 | 60.1 | 52.4 | 67.5 | -6.2 | -16.9 | 4.6 |
| Latin American | 76.2 | 68.4 | 82.8 | 69.7 | 61.6 | 77.1 | -6.4 | -16.3 | 3.4 |
| Other or multiple racialized groups | 73.8 | 68.5 | 78.6 | 68.8 | 57.6 | 78.5 | -5.0 | -16.4 | 6.4 |
| Non-racialized (White only) | 71.6 | 70.9 | 72.4 | 62.2 | 61.3 | 63.1 | -9.4Note * | -10.6 | -8.3 |
| Immigrant status | |||||||||
| Yes | 74.0 | 72.4 | 75.6 | 65.2 | 63.2 | 67.2 | -8.8Note * | -11.3 | -6.3 |
| No | 70.4 | 69.6 | 71.1 | 60.9 | 59.9 | 61.8 | -9.5Note * | -10.7 | -8.3 |
| Indigenous identity | |||||||||
| First NationsTable 3 Note ‡ | 62.3 | 56.9 | 67.5 | 53.4 | 46.9 | 59.8 | -8.9Note * | -16.8 | -0.9 |
| Métis | 66.9 | 62.0 | 71.5 | 59.7 | 53.2 | 66.1 | -7.1 | -15.0 | 0.7 |
| Inuit | 47.9Note E: Use with caution | 27.6 | 68.7 | 77.9 | 58.3 | 91.3 | 30.0Note E: Use with caution Note * | 4.4 | 55.6 |
| Non-Indigenous | 70.8 | 70.0 | 71.6 | 61.0 | 60.1 | 62.0 | -9.8Note * | -11.0 | -8.6 |
| Highest level of household educational attainment | |||||||||
| Secondary school education or less | 63.8 | 62.3 | 65.2 | 57.0 | 55.0 | 58.9 | -6.8Note * | -9.2 | -4.3 |
| Post secondary diploma or university degree | 73.5 | 72.7 | 74.3 | 63.2 | 62.2 | 64.1 | -10.4Note * | -11.6 | -9.2 |
| Household income adequacy quintile | |||||||||
| Quintile 1 (lowest) | 65.2 | 63.5 | 66.9 | 56.7 | 54.6 | 58.8 | -8.5Note * | -11.2 | -5.8 |
| Quintile 2 | 68.5 | 66.9 | 70.2 | 59.6 | 57.4 | 61.7 | -9.0Note * | -11.6 | -6.3 |
| Quintile 3 | 70.8 | 69.1 | 72.4 | 62.6 | 60.7 | 64.6 | -8.2Note * | -10.7 | -5.6 |
| Quintile 4 | 74.2 | 72.7 | 75.7 | 64.9 | 62.8 | 66.9 | -9.3Note * | -11.9 | -6.8 |
| Quintile 5 (highest) | 78.0 | 76.5 | 79.5 | 67.0 | 65.2 | 68.7 | -11.1Note * | -13.3 | -8.9 |
| Living arrangement | |||||||||
| Living alone or with a spouse or partner | 68.2 | 67.3 | 69.1 | 59.0 | 57.9 | 60.1 | -9.2Note * | -10.7 | -7.8 |
| Two-parent household | 77.0 | 75.7 | 78.2 | 67.6 | 65.9 | 69.2 | -9.4Note * | -11.4 | -7.4 |
| One-parent household | 67.8 | 64.9 | 70.6 | 56.8 | 53.1 | 60.3 | -11.0Note * | -15.5 | -6.5 |
| Other | 70.8 | 67.5 | 73.9 | 62.3 | 58.3 | 66.1 | -8.5Note * | -13.5 | -3.5 |
| Marital status | |||||||||
| Married or common-law | 76.9 | 76.0 | 77.7 | 69.4 | 68.4 | 70.5 | -7.4Note * | -8.8 | -6.1 |
| Widowed, separated, or divorced | 67.0 | 65.4 | 68.5 | 58.4 | 56.4 | 60.3 | -8.6Note * | -11.1 | -6.2 |
| Single, never married | 59.9 | 58.2 | 61.6 | 47.0 | 45.1 | 49.0 | -12.9Note * | -15.4 | -10.3 |
| Work statusTable 3 Note § | |||||||||
| Full-time | 76.5 | 75.5 | 77.5 | 68.2 | 67.0 | 69.5 | -8.3Note * | -9.8 | -6.8 |
| Part-time | 66.9 | 64.3 | 69.5 | 58.9 | 55.8 | 62.0 | -8.0Note * | -12.0 | -4.1 |
| Occupational groupTable 3 Note § | |||||||||
| Desk-based or home-based workers | 74.5 | 72.4 | 76.5 | 65.5 | 63.1 | 67.9 | -8.9Note * | -12.0 | -5.9 |
| Non-health care out-of-home workers | 74.6 | 73.4 | 75.7 | 65.5 | 64.0 | 67.1 | -9.0Note * | -11.0 | -7.1 |
| Health care workers | 78.8 | 76.2 | 81.3 | 74.7 | 71.8 | 77.3 | -4.2Note * | -8.0 | -0.3 |
E use with caution
Source: Canadian Community Health Survey, 2018 and 2021. |
|||||||||
Sociodemographic characteristics associated with meeting the recreational screen time recommendation during the pandemic
Among youth, during the pandemic, the only significant factor positively associated with meeting the recreational screen time recommendation was living in a rural area compared with an urban population centre (Table 4). Conversely, identifying as Black (versus non-racialized) and being in the lowest income quintile (versus the highest) were factors significantly associated with being less likely to meet the recommendation during the pandemic.
| Sociodemographic characteristics | Youth (aged 12 to 17 years) | Adults (aged 18 years and older) | ||||||||||
|---|---|---|---|---|---|---|---|---|---|---|---|---|
| 2018 | 2021 | 2018 | 2021 | |||||||||
| Adjusted odds ratio |
95% confidence interval |
Adjusted odds ratio |
95% confidence interval |
Adjusted odds ratio |
95% confidence interval |
Adjusted odds ratio |
95% confidence interval |
|||||
| from | to | from | to | from | to | from | to | |||||
| Sex | ||||||||||||
| Female | 1.5Note * | 1.2 | 1.9 | 1.0 | 0.8 | 1.3 | 1.3Note * | 1.2 | 1.4 | 1.2Note * | 1.1 | 1.3 |
| MaleTable 4 Note †† | 1.0 | Note ...: not applicable | Note ...: not applicable | 1.0 | Note ...: not applicable | Note ...: not applicable | 1.0 | Note ...: not applicable | Note ...: not applicable | 1.0 | Note ...: not applicable | Note ...: not applicable |
| Age, years | ||||||||||||
| 18 to 34 | Note ...: not applicable | Note ...: not applicable | Note ...: not applicable | Note ...: not applicable | Note ...: not applicable | Note ...: not applicable | 0.5Note * | 0.4 | 0.5 | 0.5Note * | 0.4 | 0.5 |
| 35 to 64Table 4 Note †† | Note ...: not applicable | Note ...: not applicable | Note ...: not applicable | Note ...: not applicable | Note ...: not applicable | Note ...: not applicable | 1.0 | Note ...: not applicable | Note ...: not applicable | 1.0 | Note ...: not applicable | Note ...: not applicable |
| 65 and older | Note ...: not applicable | Note ...: not applicable | Note ...: not applicable | Note ...: not applicable | Note ...: not applicable | Note ...: not applicable | 0.6Note * | 0.5 | 0.6 | 0.6Note * | 0.5 | 0.6 |
| Place of residence | ||||||||||||
| Rural area | 1.6Note * | 1.2 | 2.0 | 1.5Note * | 1.1 | 1.9 | 1.3Note * | 1.2 | 1.4 | 1.4Note * | 1.3 | 1.5 |
| Small population centre | 1.3Note * | 1.0 | 1.7 | 1.1 | 0.8 | 1.5 | 1.1 | 1.0 | 1.2 | 1.2Note * | 1.1 | 1.3 |
| Medium population centre | 1.0 | 0.7 | 1.3 | 1.2 | 0.8 | 1.7 | 0.9 | 0.9 | 1.0 | 0.9 | 0.8 | 1.0 |
| Large urban population centreTable 4 Note †† | 1.0 | Note ...: not applicable | Note ...: not applicable | 1.0 | Note ...: not applicable | Note ...: not applicable | 1.0 | Note ...: not applicable | Note ...: not applicable | 1.0 | Note ...: not applicable | Note ...: not applicable |
| Racialized groupTable 4 Note † | ||||||||||||
| Yes | 0.7Note * | 0.6 | 0.9 | 0.8 | 0.6 | 1.1 | 1.0 | 0.9 | 1.1 | 1.0 | 0.9 | 1.1 |
| NoTable 4 Note †† | 1.0 | Note ...: not applicable | Note ...: not applicable | 1.0 | Note ...: not applicable | Note ...: not applicable | 1.0 | Note ...: not applicable | Note ...: not applicable | 1.0 | Note ...: not applicable | Note ...: not applicable |
| Racialized group—multiple categoriesTable 4 Note † | ||||||||||||
| Black | 0.6Note E: Use with caution | 0.4 | 1.0 | 0.4Note E: Use with caution Note * | 0.2 | 0.7 | 0.8 | 0.6 | 1.0 | 0.8 | 0.6 | 1.0 |
| East or Southeast Asian | 0.7Note E: Use with caution | 0.4 | 1.0 | 0.9Note E: Use with caution | 0.5 | 1.7 | 0.9 | 0.8 | 1.1 | 0.9Note * | 0.7 | 1.0 |
| South Asian | 1.0Note E: Use with caution | 0.6 | 1.6 | 1.0Note E: Use with caution | 0.6 | 1.6 | 1.2 | 1.0 | 1.6 | 1.4Note * | 1.1 | 1.7 |
| West Asian or Arab | 0.8Note E: Use with caution | 0.4 | 1.6 | 0.7Note E: Use with caution | 0.4 | 1.3 | 0.8 | 0.5 | 1.1 | 0.9 | 0.7 | 1.3 |
| Latin American | Note F: too unreliable to be published | Note ...: not applicable | Note F: too unreliable to be published | Note ...: not applicable | Note ...: not applicable | 1.3 | 0.9 | 1.9 | 1.4 | 1.0 | 2.0 | |
| Other or multiple racialized groups | 1.0Note E: Use with caution | 0.5 | 1.9 | Note F: too unreliable to be published | Note ...: not applicable | Note ...: not applicable | 1.1 | 0.9 | 1.4 | 1.3 | 0.8 | 2.2 |
| Non-racialized (White only)Table 4 Note †† | 1.0 | Note ...: not applicable | Note ...: not applicable | 1.0 | Note ...: not applicable | Note ...: not applicable | 1.0 | Note ...: not applicable | Note ...: not applicable | 1.0 | Note ...: not applicable | Note ...: not applicable |
| Immigrant status | ||||||||||||
| Yes | 0.8 | 0.6 | 1.1 | 0.8Note E: Use with caution | 0.5 | 1.1 | 1.2Note * | 1.1 | 1.3 | 1.2Note * | 1.1 | 1.3 |
| NoTable 4 Note †† | 1.0 | Note ...: not applicable | Note ...: not applicable | 1.0 | Note ...: not applicable | Note ...: not applicable | 1.0 | Note ...: not applicable | Note ...: not applicable | 1.0 | Note ...: not applicable | Note ...: not applicable |
| Indigenous identity (youth) | ||||||||||||
| First Nations,Table 4 Note ‡ Métis, or Inuit | 0.9 | 0.7 | 1.3 | 0.7Note E: Use with caution | 0.5 | 1.2 | Note ...: not applicable | Note ...: not applicable | Note ...: not applicable | Note ...: not applicable | Note ...: not applicable | Note ...: not applicable |
| Non-IndigenousTable 4 Note †† | 1.0 | Note ...: not applicable | Note ...: not applicable | 1.0 | Note ...: not applicable | Note ...: not applicable | Note ...: not applicable | Note ...: not applicable | Note ...: not applicable | Note ...: not applicable | Note ...: not applicable | Note ...: not applicable |
| Indigenous identity (adults) | ||||||||||||
| First NationsTable 4 Note ‡ | Note ...: not applicable | Note ...: not applicable | Note ...: not applicable | Note ...: not applicable | Note ...: not applicable | Note ...: not applicable | 0.7Note * | 0.5 | 0.8 | 0.7Note * | 0.6 | 0.9 |
| Métis | Note ...: not applicable | Note ...: not applicable | Note ...: not applicable | Note ...: not applicable | Note ...: not applicable | Note ...: not applicable | 0.8 | 0.7 | 1.0 | 0.9 | 0.7 | 1.2 |
| Inuit | Note ...: not applicable | Note ...: not applicable | Note ...: not applicable | Note ...: not applicable | Note ...: not applicable | Note ...: not applicable | 0.4Note E: Use with caution Note * | 0.2 | 0.9 | 2.2 | 0.9 | 5.9 |
| Non-IndigenousTable 4 Note †† | Note ...: not applicable | Note ...: not applicable | Note ...: not applicable | Note ...: not applicable | Note ...: not applicable | Note ...: not applicable | 1.0 | Note ...: not applicable | Note ...: not applicable | 1.0 | Note ...: not applicable | Note ...: not applicable |
| Highest level of household educational attainment | ||||||||||||
| Secondary school education or less | 0.8 | 0.6 | 1.1 | 1.0 | 0.7 | 1.4 | 0.6Note * | 0.6 | 0.7 | 0.8Note * | 0.7 | 0.8 |
| Post secondary diploma or university degree†† | 1.0 | Note ...: not applicable | Note ...: not applicable | 1.0 | Note ...: not applicable | Note ...: not applicable | 1.0 | Note ...: not applicable | Note ...: not applicable | 1.0 | Note ...: not applicable | Note ...: not applicable |
| Household income adequacy quintile | ||||||||||||
| Quintile 1 (lowest) | 0.5Note * | 0.3 | 0.7 | 0.7Note * | 0.5 | 0.9 | 0.5Note * | 0.5 | 0.6 | 0.6Note * | 0.6 | 0.7 |
| Quintile 2 | 0.4Note * | 0.3 | 0.6 | 0.8 | 0.6 | 1.3 | 0.6Note * | 0.5 | 0.7 | 0.7Note * | 0.6 | 0.8 |
| Quintile 3 | 0.5Note * | 0.4 | 0.7 | 1.1 | 0.7 | 1.6 | 0.7Note * | 0.6 | 0.8 | 0.8Note * | 0.7 | 0.9 |
| Quintile 4 | 0.5Note * | 0.4 | 0.7 | 1.0 | 0.7 | 1.4 | 0.8Note * | 0.7 | 0.9 | 0.9 | 0.8 | 1.0 |
| Quintile 5 (highest)Table 4 Note †† | 1.0 | Note ...: not applicable | Note ...: not applicable | 1.0 | Note ...: not applicable | Note ...: not applicable | 1.0 | Note ...: not applicable | Note ...: not applicable | 1.0 | Note ...: not applicable | Note ...: not applicable |
| Living arrangement | ||||||||||||
| Living alone or with a spouse or partnerTable 4 Note †† | 1.0 | Note ...: not applicable | Note ...: not applicable | 1.0 | Note ...: not applicable | Note ...: not applicable | 1.0 | Note ...: not applicable | Note ...: not applicable | 1.0 | Note ...: not applicable | Note ...: not applicable |
| Two-parent household | 3.0Note * | 1.3 | 6.8 | 0.7 | 0.3 | 1.6 | 1.6Note * | 1.4 | 1.7 | 1.5Note * | 1.3 | 1.6 |
| one-parent household | 1.7 | 0.7 | 4.0 | 0.4 | 0.2 | 1.1 | 1.0 | 0.9 | 1.1 | 0.9 | 0.8 | 1.1 |
| Other | 2.9Note * | 1.2 | 7.0 | 0.5Note E: Use with caution | 0.2 | 1.2 | 1.1 | 1.0 | 1.3 | 1.1 | 1.0 | 1.4 |
| Marital status (adults) | ||||||||||||
| Married or common-law | Note ...: not applicable | Note ...: not applicable | Note ...: not applicable | Note ...: not applicable | Note ...: not applicable | Note ...: not applicable | 2.2Note * | 2.0 | 2.4 | 2.6Note * | 2.3 | 2.8 |
| Widowed, separated, or divorced | Note ...: not applicable | Note ...: not applicable | Note ...: not applicable | Note ...: not applicable | Note ...: not applicable | Note ...: not applicable | 1.4Note * | 1.2 | 1.5 | 1.6Note * | 1.4 | 1.8 |
| Single, never marriedTable 4 Note †† | Note ...: not applicable | Note ...: not applicable | Note ...: not applicable | Note ...: not applicable | Note ...: not applicable | Note ...: not applicable | 1.0 | Note ...: not applicable | Note ...: not applicable | 1.0 | Note ...: not applicable | Note ...: not applicable |
| Work status (adults)Table 4 Note § | ||||||||||||
| Full-time | Note ...: not applicable | Note ...: not applicable | Note ...: not applicable | Note ...: not applicable | Note ...: not applicable | Note ...: not applicable | 1.6Note * | 1.4 | 1.8 | 1.5Note * | 1.3 | 1.7 |
| Part-timeTable 4 Note †† | Note ...: not applicable | Note ...: not applicable | Note ...: not applicable | Note ...: not applicable | Note ...: not applicable | Note ...: not applicable | 1.0 | Note ...: not applicable | Note ...: not applicable | 1.0 | Note ...: not applicable | Note ...: not applicable |
| Occupational group (adults) | ||||||||||||
| Desk-based or home-based workersTable 4 Note †† | Note ...: not applicable | Note ...: not applicable | Note ...: not applicable | Note ...: not applicable | Note ...: not applicable | Note ...: not applicable | 1.0 | Note ...: not applicable | Note ...: not applicable | 1.0 | Note ...: not applicable | Note ...: not applicable |
| Non-health care out-of-home workers | Note ...: not applicable | Note ...: not applicable | Note ...: not applicable | Note ...: not applicable | Note ...: not applicable | Note ...: not applicable | 1.0 | 0.9 | 1.1 | 1.0 | 0.9 | 1.1 |
| Health care workers | Note ...: not applicable | Note ...: not applicable | Note ...: not applicable | Note ...: not applicable | Note ...: not applicable | Note ...: not applicable | 1.3Note * | 1.1 | 1.5 | 1.5Note * | 1.3 | 1.8 |
|
... not applicable E use with caution F too unreliable to be published
|
||||||||||||
Among adults, during the pandemic, the following characteristics were associated with a greater likelihood of meeting the recommendation: being female (versus male); living in a rural area or a small population centre (versus urban population centre); identifying as South Asian (versus non-racialized); being an immigrant to Canada (versus non-immigrant); living in a two-parent household (versus living alone); being married or in a common-law relationship, or widowed, separated, or divorced (versus single, never married); working full time (versus part time); and being a health care worker (versus desk-based or home-based worker). Conversely, being aged 18 to 34 years or 65 years and older, identifying as East or Southeast Asian, identifying as First Nations, and being in the three lowest household income quintiles were associated with a lower likelihood of recommendation adherence during the pandemic (Table 4). Overall, controlling for province in the models did not result in any significant change in the estimates among youth or adults.
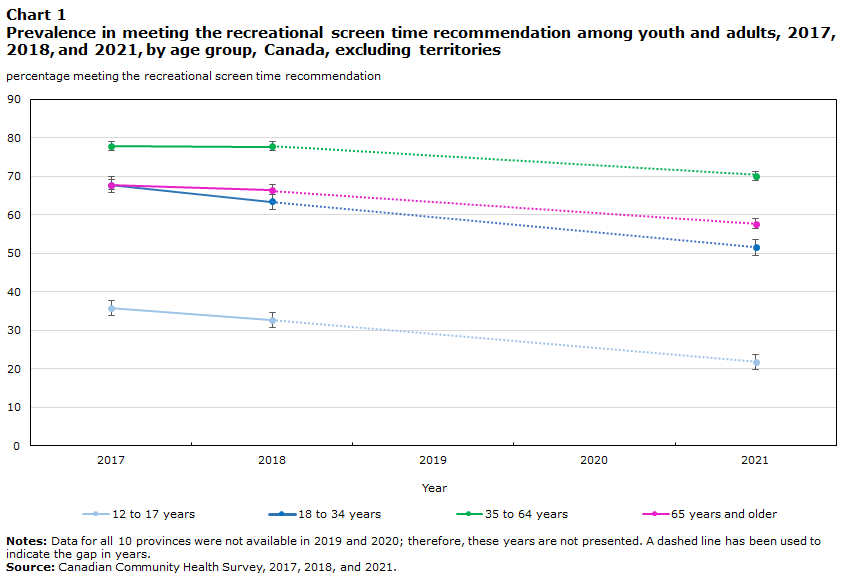
Chart 1 depicts the prevalence of meeting the recommendation in 2017, 2018, and 2021 by age group. Overall, pre-pandemic (2017 and 2018) levels of adherence to the recommendation were relatively similar within age groups. There were no significant changes from 2017 to 2018 in the prevalence of meeting the recommendation for youth and adults aged 35 to 64 years and 65 years and older. However, for adults aged 18 to 34 years, a decrease of 4.6 percentage points was observed from 2017 to 2018. Although there is a pre-pandemic decrease among those aged 18 to 34 years, the decline is less than half compared with that seen from 2018 to 2021.
Description of Chart 1
| 2017 | 2018 | 2019 | 2020 | 2021 | |||||||||||
|---|---|---|---|---|---|---|---|---|---|---|---|---|---|---|---|
| Percent | 95% confidence interval | Percent | 95% confidence interval | Percent | 95% confidence interval | Percent | 95% confidence interval | Percent | 95% confidence interval | ||||||
| lower | upper | lower | upper | lower | upper | lower | upper | lower | upper | ||||||
| 12 to 17 years | 35.8 | 33.8 | 37.9 | 32.7 | 30.6 | 34.8 | Note ..: not available for a specific reference period | Note ..: not available for a specific reference period | Note ..: not available for a specific reference period | Note ..: not available for a specific reference period | Note ..: not available for a specific reference period | Note ..: not available for a specific reference period | 21.8 | 19.8 | 23.8 |
| 18 to 34 years | 67.9 | 66.4 | 69.5 | 63.4 | 61.7 | 65.0 | Note ..: not available for a specific reference period | Note ..: not available for a specific reference period | Note ..: not available for a specific reference period | Note ..: not available for a specific reference period | Note ..: not available for a specific reference period | Note ..: not available for a specific reference period | 51.6 | 49.5 | 53.6 |
| 35 to 64 years | 78.0 | 77.2 | 78.9 | 77.9 | 76.9 | 78.8 | Note ..: not available for a specific reference period | Note ..: not available for a specific reference period | Note ..: not available for a specific reference period | Note ..: not available for a specific reference period | Note ..: not available for a specific reference period | Note ..: not available for a specific reference period | 70.2 | 69.0 | 71.4 |
| 65 years and older | 67.9 | 66.8 | 69.1 | 66.6 | 65.3 | 67.8 | Note ..: not available for a specific reference period | Note ..: not available for a specific reference period | Note ..: not available for a specific reference period | Note ..: not available for a specific reference period | Note ..: not available for a specific reference period | Note ..: not available for a specific reference period | 57.7 | 56.4 | 59.1 |
|
.. not available for a specific reference period Notes: Data for all 10 provinces were not available in 2019 and 2020; therefore, these years are not presented. A dashed line has been used to indicate the gap in years. Source: Canadian Community Health Survey, 2017, 2018, and 2021. |
|||||||||||||||
Discussion
The pandemic affected the daily lives of Canadians, with increased telework, virtual school, and a reduction in external social activities. The present study profiles adherence to the recreational screen time recommendation from the 24-H Guidelines in the 10 Canadian provinces during the second year of the pandemic and compares this with pre-pandemic levels. The results show that, overall, significantly fewer youth and adults met the recommendation in 2021 compared with 2018. In more than half of the provinces, the recommendation adherence was significantly lower in 2021 compared with 2018. The variation seen across provinces in this study may be partly attributable to the differences in public health responses (e.g., timing of school closures, curfews, distancing), as well as the provincial COVID-19 case count.Note 22 These findings are consistent with other Canadian and international research, which also observed an overall increase in screen time and sedentary behaviour during the pandemic.Note 15, Note 23, Note 24, Note 25, Note 26
These findings demonstrate that adherence to the recreational screen time recommendation during the pandemic differed across sociodemographic groups. Across both sexes and all age groups, the prevalence of meeting the recommendation was significantly lower during the pandemic, with the largest absolute decrease seen among those aged 18 to 34 years, followed by youth and adults aged 65 years and older. The decreased likelihood of meeting the recommendation among the 18- to 34-year-old group is consistent with other North American studies, which indicate that more than half of adults increased their screen time during the pandemic, with the largest increase among those aged 20 to 34 years.Note 15, Note 26, Note 27, Note 28, Note 29, Note 30, Note 31 The lower likelihood of older adults meeting the recommendation during the pandemic may be partly attributable to public health messaging encouraging older adults to limit in-person contact, since they were identified as a vulnerable population group.Note 27 Evidence from a systematic review suggested that during the pandemic, adults increased their recreational screen time by 0.72 hours per day and youth by 0.48 hours per day.Note 26 Other studies examining recreational screen time behaviours in youth also indicated an increase from 3.8 hours per day before the pandemic2 to 6.5 hours per dayNote 23, Note 28, Note 29, Note 30 during the pandemic. These increases in recreational screen time may be attributable to several factors, including spending more time at home, using technology to communicate with family and friends, and using different types of screen devices as a coping mechanism during a time filled with great uncertainty.Note 28, Note 31
The results of the present study show that during the pandemic (2021), Black youth and East or Southeast Asian adults were significantly less likely to meet the recommendation compared with the non-racialized group. Additionally, First Nations adults were significantly less likely to meet the recommendation than non-Indigenous adults before and during the pandemic. Limited research has explored ethnic and cultural differences in recreational screen time during the pandemic. Two U.S. studies during the pandemic found that Black, Hispanic, and Latina and Latino children and youth reported higher daily screen time and had a lower likelihood of meeting the recommendation compared with White youth.Note 32, Note 33 It is suggested that this finding may be attributable to a lack of structured extracurricular activities for children in racialized groups, which was further exacerbated during the pandemic.Note 33, Note 34 Several adult studies showed mixed associations with ethnicity and sedentary behaviour; however, some studies showed that those identifying as African American or Black viewed more television compared with other ethnicities.Note 35 A systematic review of North American Indigenous people found that those identifying as First Nations or American Indians, Métis, Inuit or Alaskan Natives, or Native Hawaiians had higher overall screen time compared with North American Europeans, with First Nations or American Indian people engaging in more screen time compared with other Indigenous groups.Note 36
Adults who worked full time were significantly more likely to meet the recommendation compared with those working part time both before and during the pandemic. Similarly, those who identified as health care workers were significantly more likely to meet the recommendation compared with those who worked from home. One U.S. study showed that changes in employment during the pandemic influenced screen time behaviours, with those who transitioned to working from home reporting more screen time compared with those whose employment remained the same or those who became unemployed as a result of the pandemic.Note 37 In Canada, those working in health care engaged in less recreational screen time compared with other occupational groups.Note 38 Future work will be needed to examine whether remote or in-person work affects recreational screen time.
In the present study, a significant decrease in adherence to the recommendation from 2018 to 2021 was observed across all income quintiles for adults and most quintiles for youth. People in lower quintiles were less likely to adhere to the recommendation compared with those in the highest income quintile. Before the pandemic, research showed an inverse association between family income and screen time.Note 32, Note 39, Note 40, Note 41
Other research during the pandemic has also shown a significant increase in recreational screen time across all income groups.Note 42 It is suggested that those in the lowest income quintiles may have worked jobs that were more greatly impacted by the pandemic in terms of reduced hours, increased layoffs, and additional stressors.Note 43 Lower-income earners tend to be unable to work from home, often working in the service-producing sector, agriculture, and accommodation and food services.Note 44 During the pandemic, the most pronounced wage losses and layoffs were seen among lower-income earners.Note 45 This may have contributed to greater use of screens as a coping mechanism or as a tool to access more information related to employment and financial support during the pandemic.Note 32, Note 42
The present study shows that across most sociodemographic groups recreational screen time was higher in 2021 compared with before the pandemic. Although previous surveillance work has highlighted an upward trend in recreational screen time over the last several years,Note 10 the significant declines in the proportion of Canadians meeting the screen time recommendation in 2021 may be attributable to the changes in daily behaviours because of the pandemic. Although excessive recreational screen time use is generally associated with less favourable physical and mental health, screen time may have provided important benefits during the pandemic, including as a means to maintain social connectedness.Note 46
This work emphasizes the need for creating supportive environments in the post-pandemic period to enable health-promoting behaviours that can prevent negative health outcomes, particularly within the subpopulations that experienced the greatest increases in recreational screen time. Resuming healthy lifestyle behaviours, such as increasing physical activity and sleep and decreasing sedentary time, after the pandemic will be a crucial part of pandemic recovery.
Strengths and limitations
Strengths of this study include the representative sample of the CCHS and exploration across a comprehensive list of a priori identified sociodemographic variables; however, this study also has limitations. Sedentary behaviour questions were selected by only a few provinces in 2019 and 2020, precluding the ability to generate national estimates for those years. The wording of survey questions has changed over time, limiting comparisons to years after 2017 only. The sedentary behaviour module of the CCHS does not collect data on total sedentary time; therefore, only the recreational screen time component of the sedentary behaviour recommendations could be evaluated. All CCHS data examined in this study are derived from self-reports, which may have been affected by recall and social desirability biases.Note 1, Note 47
The pandemic impacted survey collection, resulting in a reliance on telephone interviews and a change in months of survey collection. These changes should be considered when comparing data collected before the pandemic and during the pandemic. Although sampling weights, which adjust for non-response, have been applied to these analyses, it is still possible that the results may be biased by self-selection, given the survey response rate.
Further, there is potential misclassification in the study. Recreational screen time responses were recategorized using the midpoint estimates, and then a weighted average was calculated to identify adherence to the recommendation. However, this likely caused some misclassification, since some respondents who did not meet the recommendation may have been classified as meeting the recommendation.
Additionally, when respondents were missing their recreational screen time amount either on a work or school day or on a non-work or school day, their responses for the available days were used as the amount for the whole week. This may have caused some misclassification. Recreational screen time is typically higher on non-work or school days than work or school days.Note 48 Reassigning screen time amounts may have led to underestimated screen time for those who did not respond for non-work or school days and overestimated screen time for those who did not respond for work or school days. Misclassification is also possible among those who did not work at a job or attend school (e.g., retirees); however, it is less likely, since their schedules are likely less variable throughout the week.
Lastly, the variables available to derive the occupational groups were quite broad, and without further information on the respondents’ exact occupation, there is likely misclassification across the occupation categories.Note 21
Conclusion
Overall, a significant decrease in the proportion of Canadians meeting the age-specific recreational screen time recommendation was observed. This work identifies subgroups of the population (e.g., some racialized and lower-income youth and adults, as well as adults aged 18 to 34 and 65 and older) that were less likely to meet the recreational screen time recommendation during the pandemic. In the wake of the pandemic, there is a greater need for evidence-based equitable public health messaging to help Canadians adopt more active lifestyles and improve overall physical and mental health. Continued surveillance is needed to understand how recreational screen time behaviours evolve after the pandemic, and how these behaviours may impact health outcomes.
- Date modified: