
Health Reports
Exploring the use of experimental small area estimates to examine the relationship between individual-level and area-level community belonging and self-rated health
by Sarah M. Mah, Mark Brown, Rachel C. Colley, Laura C. Rosella, Grant Schellenberg and Claudia Sanmartin

DOI: https://www.doi.org/10.25318/82-003-x202400300001-eng
Abstract
Background
Small area estimation refers to statistical modelling procedures that leverage information or “borrow strength” from other sources or variables. This is done to enhance the reliability of estimates of characteristics or outcomes for areas that do not contain sufficient sample sizes to provide disaggregated estimates of adequate precision and reliability. There is growing interest in secondary research applications for small area estimates (SAEs). However, it is crucial to assess the analytic value of these estimates when used as proxies for individual-level characteristics or as distinct measures that offer insights at the area level. This study assessed novel area-level community belonging measures derived using small area estimation and examined associations with individual-level measures of community belonging and self-rated health.
Data and methods
SAEs of community belonging within census tracts produced from the 2016-2019 cycles of the Canadian Community Health Survey (CCHS) were merged with respondent data from the 2020 CCHS. Multinomial logistic regression models were run between area-level SAEs, individual-level sense of community belonging, and self-rated health on the study sample of people aged 18 years and older.
Results
Area-level community belonging was associated with individual-level community belonging, even after adjusting for individual-level sociodemographic characteristics, despite limited agreement between individual- and area-level measures. Living in a neighbourhood with low community belonging was associated with higher odds of reporting being in fair or poor health, versus being in very good or excellent health (odds ratio: 1.53; 95% confidence interval: 1.22, 1.91), even after adjusting for other factors such as individual-level sense of community belonging, which was also associated with self-rated health.
Interpretation
Area-level and individual-level sense of community belonging were independently associated with self-rated health. The novel SAEs of community belonging can be used as distinct measures of neighbourhood-level community belonging and should be understood as complementary to, rather than proxies for, individual-level measures of community belonging.
Keywords
Community belonging, subjective well-being, social capital, small area estimation, social networks, small-area analysis, neighbourhood health.
Authors
Sarah M. Mah is with the Dalla Lana School of Public Health, University of Toronto, Ontario. Mark Brown is with the Economic Analysis Division at Statistics Canada. Rachel C. Colley is with the Health Analysis Division at Statistics Canada. Laura C. Rosella is with the Dalla Lana School of Public Health, University of Toronto, Ontario. Grant Schellenberg is with the Social Analysis and Modelling Division, Analytical Studies Branch, at Statistics Canada. Claudia Sanmartin is with the Strategic Analysis, Publications and Training Division at Statistics Canada.
What is already known on this subject?
- Sense of belonging to community is associated with health and well-being outcomes in Canada.
- Community belonging is thought to be influential at the level of individuals and of areas.
- Small area estimation techniques are used to obtain reliable population estimates of characteristics or outcomes for geographic areas with insufficient sample sizes. Their analytic value as proxies or distinct area-level measures in health research has not been fully explored.
What does this study add?
- Novel small area estimates of community belonging are associated with individual-level ratings of community belonging after adjusting for sociodemographic factors, despite limited agreement between the two measures.
- Living in neighbourhoods with a weak area-level sense of community belonging is associated with less favourable self-rated health, independently of individual-level community belonging.
- Area-level measures of community belonging derived using small area estimation techniques are meaningful for health beyond independent ratings of sense of belonging to community. Such measures may serve as distinct, complementary contextual variables in future studies.
Introduction
As the importance of subjective well-being to health continues to garner increasing attention from researchers and policy makers,Note 1 community belonging—the degree to which individuals hold a sense of belonging and attachment to their local community—has emerged as a potential population health target that has been linked to several self-rated measures of health and well-being in Canada.Note 2, Note 3, Note 4 Community belonging is thought to influence health through a number of avenues, which can include psychosocial pathways, such as self-esteem and stress, social cognitive mechanisms that involve the transmission of social norms and attitudes related to health behaviours, and the availability of and access to material and social resources via social connections and social capital.Note 2, Note 5 Despite the known geographic variation of community belonging,Note 5, Note 6 comparatively less work has been done to investigate whether, and to what extent, community belonging, at the level of local neighbourhoods, affects self-rated general health. In other words, the extent to which one’s sense of belonging might reflect a “compositional” property (i.e., the sense of belonging of individuals who live in a given neighbourhood) versus a characteristic that marks a neighbourhood’s “context” (the existing resources and structures that foster belonging) or “collective social function” (the shared sociocultural norms, values, and history of residents)Note 7 has not been explored.
Previous studies indicate that related concepts such as social capital (the structural conditions and social networks enabling individuals to access material and psychosocial resources) and social cohesion (the degree of connectedness, cooperation, and strength of social relationships) may operate at both the levels of individuals and areas (i.e., neighbourhoods, communities, districts)Note 8, Note 9, Note 10 to influence behaviours,Note 11 health,Note 12, Note 13 and perceived happiness.Note 14 Among previous studies that assess individual-level and aggregate area-level measures of social capital and health outcomes, most note that associations observed with individual-level measures are more pronounced than those seen for area-level measures.Note 8, Note 15, Note 16 With few exceptions, Note 17, Note 18 most studies demonstrate more modest relationships for area-level than for individual-level social capital. Some studies that include both individual- and area-level measures of social capital in the same model demonstrate attenuated but persistent associations between area-level social capital and health-related outcomes,Note 9, Note 12, Note 19, Note 20, Note 21 while others see such associations eliminated.Note 13,Note 14, Note 16, Note 22 Additionally, some studies have found evidence of interaction between individual- and area-level social capital-related measures,Note 22, Note 23, Note 24 while others find no such evidence of interaction.Note 9, Note 12
Traditionally, small area estimation has been used to obtain reliable population estimates of characteristics or outcomes for geographic areas that do not contain sufficient sample sizes to provide disaggregated estimates of adequate precision and reliability. This is often achieved in part by using auxiliary variables, which comprise additional data or information available at the small area level of interest, such as sociodemographic characteristics from the census, administrative data, or other relevant sources. Statistics Canada recently produced small area estimates (SAEs) of sense of community belongingNote 25 for 5,656 census tracts (CTs). CTs are small, relatively stable areas with a population of 2,500 to 8,000 people. While there is an ongoing debate about whether statistically defined CT boundaries adequately represent local neighbourhood boundaries, previous work has shown that CTs can serve as effective proxies for Canadian neighbourhoodsNote 26 and have the advantages of granularity, consistency, and compatibility with Statistics Canada data. These estimates offer a potential source of ecological measures of belonging that could be used in association studies. However, the validity of using SAEs as proxies for individual-level measures and the analytic value of such area-level measures beyond individual-level ratings have not been fully explored.Note 27 Moreover, the behaviour of aggregate measures of community belonging with respect to health-related outcomes is unknown.
In this study, the performance and behaviour of the novel SAEs of community belonging for health-related outcomes were examined. First, the overall agreement and association between area-level measures of community belonging derived from respondents of the annual Canadian Community Health Survey (CCHS) from 2016 to 2019 and the individual-level measures of community belonging of respondents from the 2020 CCHS were examined to determine the usefulness of the SAE as a proxy for the individual-level measure. Analyses were then carried out to determine the usefulness of SAEs as distinct area-level measures of community belonging. Variations in self-rated health by area- and individual-level community belonging were described. Finally, models of the relationship between area-level community belonging and self-rated health were carried out, adjusting for sociodemographic characteristics and individual-level ratings of belonging.
Methods
Data and study sample
The CCHS is an annual, nationally representative, cross-sectional survey conducted by Statistics Canada that contains information related to health status, health-related behaviours, and social and demographic determinants of health for the Canadian population. A total of 42,132 respondents from the 2020 CCHS were available for analysis, representing a weighted population of 32,232,500. The study sample was survey respondents 18 years and older (N = 39,637) living in CTs. As this study only included CTs (i.e., “urban” areas), the study excluded respondents residing in Prince Edward Island and the Canadian territories. Of those 18 years and older and living in CTs (N = 21,750), 95.6% had valid responses for community belonging and for self-rated health. This rendered an analytic sample of N = 20,802, representing a weighted subpopulation of 21,957,781. Excluded from the analysis were 2,495 people younger than 18 years, 17,887 people living outside CTs, and 948 people with missing information on individual-level sense of belonging or self-rated health. Data collection began in January 2020, and was paused in March 2020 because of the COVID-19 pandemic.Note 28 Data collection resumed in September 2020 and ended in December 2020. The response rate for this survey year was 28.9%.
Variable definition
Individual-level sense of community belonging was assessed for 2020 CCHS respondents using a single-item response to the question, “How would you describe your sense of belonging to your local community? Would you say it is: very strong, somewhat strong, somewhat weak, or very weak?” Studies have demonstrated this variable to be an efficient and parsimonious measure that captures different forms of social capital,Note 29 local neighbourhood characteristics, and attachment to place.Note 6 Previous studies have established associations between sense of community belonging as measured by this variable with self-rated health outcomes.Note 2, Note 3, Note 4, Note 30
Measures of area-level sense of community belonging at the CT level were derived by pooling individual responses from four years of CCHS respondents (2016 to 2019) using the SAE component of the Generalized Estimation System developed at Statistics Canada.Note 25 Briefly, the linear Fay-Herriot model was used to link direct estimates of community belonging (the weighted mean value of sense of community belonging at the CT level) to auxiliary variables drawn from the 2016 Census of Population to produce stable and reliable estimates of area-level community belonging for CTs with small samples and CTs for which no sample data exist.Note 31 The SAEs of community belonging were then separated into terciles and appended to 2020 CCHS respondents using the dissemination area identifier provided on the file. As a further test of whether the previously specified tercile classificationsNote 25 meaningfully separate neighbourhoods of high and low area-level community belonging, sensitivity analyses were run using error reallocated “terciles.” First, confidence intervals (CIs) were calculated for each SAE using the standard errors produced by the small area estimation procedure. SAEs from the lowest tercile (first tercile) that had CIs overlapping with the range for the highest tercile (third tercile) were reallocated to the intermediate category (second tercile), and SAEs from the highest tercile (third tercile) that had CIs overlapping with the range for the lowest tercile (first tercile) were reallocated to the intermediate category (second tercile) (Appendix Table A1a and A1b).
The primary outcome of this analysis was self-rated health. Survey respondents were asked, “In general, would you say your health is: excellent, very good, good, fair, or poor?” “Excellent” and “very good” responses were collapsed into one category, as were the responses of “fair” and “poor,” which resulted in three response categories for self-rated health: very good or excellent, good, andfair or poor. The reliability and validity of the single-item measure for self-rated health have been demonstrated in population health studies.Note 32, Note 33
A number of individual-level covariates were considered from the CCHS a priori. These factors can be hypothesized to influence community belonging and health, have previously been demonstrated to bear associations with community belonging and health, and have been controlled for in such studies.Note 2, Note 3 The following variables were considered: age (continuous with a quadratic term), sex (male, female), province, marital status (never married; widowed, separated or divorced; married), educational attainment (less than secondary, secondary, postsecondary), income (quintiles), employment status (yes or no), recent immigrant status (immigrated within the last five years, yes or no), population group (non-Indigenous, not racialized; non-Indigenous, racialized; Indigenous), presence of children under 12 years in the household (yes or no), smoking status, chronic conditions (none, one, or two or more). The population group category “racialized” was used to refer to the “visible minority” concept in the CCHS. “Visible minority,” as defined by the Employment Equity Act, refers to an individual’s membership in a visible minority group, and includes people who are non-Caucasian in race or non-white in colour, excluding Indigenous peoples. For population groups, the non-racialized (White) population group was used as the reference category. The presence of chronic conditions was categorized as none, one, and two or more, based on responses to questions related to the following conditions: asthma, fibromyalgia, arthritis, high blood pressure, high blood cholesterol, chronic obstructive pulmonary disease, diabetes, heart disease, cancer, effects of a stroke, osteoporosis, Alzheimer’s disease or any other dementia, chronic fatigue syndrome, multiple chemical sensitivities, mood disorders, and anxiety disorders.
Statistical analyses
Descriptive statistics were provided to ascertain the level of agreement between individual-level measures of community belonging from 2020 CCHS respondents and area-level measures of community belonging derived from 2016 to 2019 CCHS respondents. Population-weighted and bootstrapped frequencies were used to calculate the kappa coefficient of agreement. Because the individual-level measure was a four-category variable and the area-level SAE measure was a three-category variable, a kappa measure with perfect agreement was not possible. Therefore, “agreement” was defined as the level of correspondence observed between each category within the three-category area-level measure and the immediately adjacent categories within the four-category individual measure (Appendix 2). In general, kappa values ≤ 0 indicate no agreement, 0.01 to 0.20 as none to slight, 0.21 to 0.40 as fair, 0.41 to 0.60 as moderate, 0.61 to 0.80 as substantial, and 0.81 to 1.00 as almost perfect agreement.Note 34
Multinomial logistic regression models were employed to examine, first, the association between area-level community belonging (three categories) and individual-level community belonging (four categories) as the outcome. Second, associations between area- and individual-level community belonging with self-rated health as the outcome of interest were assessed (three categories: very good or excellent, good, fair or poor). The four-category individual-level community belonging and three-category area-level community belonging variables were modelled against self-rated health in 1) separate models adjusting for age and sex, 2) separate models adjusting for all covariates, and 3) a single combined model with self-rated health, adjusting for all covariates. Additional models were performed using the area-level community belonging variable with error reallocated terciles. Models were first adjusted for sex and age then fully adjusted for age, sex, province, marital status, income, unemployment status, recent immigrant status, population group, presence of children under 12 years in the household, smoking status, and the presence of chronic conditions. The presence of an interaction between individual- and area-level community belonging was also assessed by including product terms, assessing a test of joint significance for all interaction terms, and examining marginal predictions by area- and individual-level belonging generated from the model. All results were generated using master file weights and bootstraps to account for the complex survey design. Analyses were performed using Stata 17.
Results
Table 1 provides the weighted distribution of cohort characteristics overall and stratified by area-level community belonging. Of those living in neighbourhoods with a strong sense of community belonging, a higher proportion of respondents tended to be from the middle-aged and older age groups (45 to 64 years and 65 years and older), the non-racialized (White) population group, and the wealthiest income quintile. Higher proportions of people with a very strong individual-level community belonging lived in neighbourhoods with high area-level community belonging (18.9%) than in neighbourhoods with moderate (15.4%) or low (16.3%) area-level community belonging. Conversely, the lowest proportions of people with a very weak sense of individual-level belonging lived in neighbourhoods with high area-level belonging (5.3%) than in neighbourhoods with moderate (8.4%) or low (8.7%) area-level belonging. Similar patterns were seen for area-level community belonging with error reallocated terciles (Appendix Table A1a and A1b).
| Overall | Area-level community belonging, terciles | |||||||||||
|---|---|---|---|---|---|---|---|---|---|---|---|---|
| Low | Moderate | High | ||||||||||
| Percentage | 95% confidence interval |
Percentage | 95% confidence interval |
Percentage | 95% confidence interval |
Percentage | 95% confidence interval |
|||||
| from | to | from | to | from | to | from | to | |||||
| Area-level community belonging | Note ...: not applicable | Note ...: not applicable | Note ...: not applicable | 33.9 | 32.4 | 35.5 | 34.3 | 32.5 | 36.1 | 31.8 | 30.2 | 33.4 |
| Individual-level community belonging | ||||||||||||
| Very weak | 7.5 | 6.9 | 8.2 | 8.7 | 7.7 | 9.9 | 8.4 | 7.2 | 9.6 | 5.3 | 4.5 | 6.3 |
| Somewhat weak | 25.0 | 24.1 | 26.1 | 26.2 | 24.5 | 28.0 | 24.9 | 23.2 | 26.6 | 24.0 | 22.2 | 25.9 |
| Somewhat strong | 50.6 | 49.5 | 51.7 | 48.8 | 46.8 | 50.8 | 51.4 | 49.5 | 53.3 | 51.7 | 49.7 | 53.7 |
| Very strong | 16.8 | 16.0 | 17.7 | 16.3 | 14.8 | 17.9 | 15.4 | 14.1 | 16.9 | 18.9 | 17.5 | 20.5 |
| Sex | ||||||||||||
| Female | 50.9 | 50.5 | 51.3 | 50.3 | 48.8 | 51.9 | 52.2 | 50.6 | 53.9 | 50.1 | 48.4 | 51.8 |
| Male | 49.1 | 48.7 | 49.5 | 49.7 | 48.1 | 51.2 | 47.8 | 46.1 | 49.4 | 49.9 | 48.2 | 51.6 |
| Age (years) | 47.1 | 46.9 | 47.3 | 44.6 | 44.1 | 45.2 | 47.6 | 47.0 | 48.2 | 49.3 | 48.6 | 50.0 |
| Age group | ||||||||||||
| 18 to 29 | 19.3 | 18.5 | 20.1 | 21.8 | 20.1 | 23.7 | 17.9 | 16.3 | 19.7 | 18.1 | 16.4 | 19.9 |
| 30 to 44 | 28.4 | 27.5 | 29.4 | 33.8 | 32.0 | 35.7 | 28.5 | 26.8 | 30.3 | 22.6 | 21.0 | 24.2 |
| 45 to 64 | 33.3 | 32.7 | 34.0 | 29.0 | 27.4 | 30.6 | 34.8 | 33.1 | 36.5 | 36.4 | 34.8 | 38.1 |
| 65 or older | 18.9 | 18.7 | 19.2 | 15.4 | 14.5 | 16.3 | 18.8 | 17.8 | 19.9 | 22.9 | 21.7 | 24.1 |
| Marital status | ||||||||||||
| Married or common-law | 61.9 | 60.8 | 63.1 | 57.2 | 55.1 | 59.3 | 63.0 | 60.9 | 65.0 | 65.9 | 64.0 | 67.8 |
| Widowed, separated, or divorced | 11.1 | 10.5 | 11.7 | 11.3 | 10.4 | 12.3 | 11.5 | 10.5 | 12.6 | 10.5 | 9.6 | 11.5 |
| Never married | 26.7 | 25.8 | 27.7 | 31.3 | 29.4 | 33.2 | 25.3 | 23.5 | 27.1 | 23.4 | 21.7 | 25.3 |
| Missing | 0.2 | 0.1 | 0.3 | 0.2 | 0.1 | 0.5 | 0.3 | 0.1 | 0.5 | 0.2 | 0.1 | 0.4 |
| Children under 12 years in the household | ||||||||||||
| Yes | 22.8 | 21.9 | 23.7 | 22.7 | 20.9 | 24.5 | 24.0 | 22.3 | 25.7 | 21.7 | 20.0 | 23.4 |
| No | 77.2 | 76.3 | 78.1 | 77.3 | 75.5 | 79.1 | 76.0 | 74.3 | 77.7 | 78.3 | 76.6 | 80.0 |
| Population groupTable 1 Note 1 | ||||||||||||
| Non-Indigenous, not racialized | 69.1 | 67.9 | 70.2 | 63.9 | 61.7 | 66.1 | 65.4 | 63.1 | 67.6 | 78.5 | 76.4 | 80.6 |
| Non-Indigenous, racialized | 26.1 | 25.0 | 27.3 | 30.3 | 28.1 | 32.6 | 30.2 | 28.0 | 32.5 | 17.3 | 15.4 | 19.4 |
| Indigenous | 2.5 | 2.2 | 2.9 | 3.2 | 2.7 | 3.9 | 2.2 | 1.8 | 2.8 | 2.2 | 1.7 | 2.8 |
| Missing | 2.2 | 1.9 | 2.6 | 2.5 | 1.9 | 3.3 | 2.1 | 1.6 | 2.8 | 2.0 | 1.5 | 2.7 |
| Recent immigrant (within five years) | ||||||||||||
| Yes | 3.9 | 3.4 | 4.4 | 5.5 | 4.6 | 6.7 | 4.0 | 3.2 | 5.0 | 2.0 | 1.4 | 2.8 |
| No | 93.8 | 93.2 | 94.4 | 91.7 | 90.4 | 92.9 | 94.0 | 92.9 | 95.0 | 95.9 | 94.9 | 96.7 |
| Missing | 2.3 | 1.9 | 2.7 | 2.7 | 2.1 | 3.6 | 1.9 | 1.4 | 2.7 | 2.1 | 1.6 | 2.9 |
| Income quintile | ||||||||||||
| Lowest | 21.0 | 20.0 | 22.0 | 24.3 | 22.5 | 26.1 | 22.2 | 20.6 | 24.0 | 16.1 | 14.5 | 17.8 |
| Second | 20.0 | 19.0 | 20.9 | 21.6 | 20.1 | 23.2 | 21.4 | 19.8 | 23.1 | 16.6 | 15.0 | 18.4 |
| Third | 19.8 | 18.9 | 20.7 | 20.2 | 18.7 | 21.8 | 20.4 | 18.8 | 22.0 | 18.7 | 17.2 | 20.3 |
| Fourth | 19.3 | 18.4 | 20.2 | 17.0 | 15.6 | 18.4 | 20.1 | 18.5 | 21.9 | 21.0 | 19.4 | 22.6 |
| Highest | 19.9 | 19.0 | 20.9 | 16.9 | 15.4 | 18.6 | 15.9 | 14.4 | 17.4 | 27.6 | 25.7 | 29.5 |
| Employed | ||||||||||||
| Yes | 69.8 | 68.8 | 70.7 | 70.5 | 68.8 | 72.1 | 69.8 | 68.0 | 71.4 | 69.0 | 67.1 | 70.8 |
| No | 29.3 | 28.3 | 30.3 | 28.3 | 26.7 | 29.9 | 29.2 | 27.6 | 30.9 | 30.4 | 28.6 | 32.3 |
| Missing | 0.9 | 0.7 | 1.2 | 1.2 | 0.8 | 1.9 | 1.0 | 0.6 | 1.6 | 0.6 | 0.4 | 0.9 |
| Smoking status | ||||||||||||
| Current or former daily smoker | 29.3 | 28.4 | 30.3 | 28.7 | 27.0 | 30.5 | 29.7 | 28.1 | 31.5 | 29.5 | 27.8 | 31.3 |
| Current or former occasional smoker | 7.7 | 7.1 | 8.4 | 9.1 | 8.0 | 10.3 | 6.9 | 6.0 | 8.0 | 7.2 | 6.2 | 8.4 |
| Non-smoker | 62.8 | 61.8 | 63.9 | 62.1 | 60.2 | 63.9 | 63.2 | 61.4 | 65.1 | 63.2 | 61.3 | 65.1 |
| Missing | 0.1 | 0.0 | 0.2 | 0.1 | 0.1 | 0.3 | 0.1 | 0.0 | 0.3 | 0.0 | 0.0 | 0.1 |
| Number of chronic conditionsTable 1 Note 2 | ||||||||||||
| None | 49.5 | 48.4 | 50.6 | 51.5 | 49.4 | 53.6 | 50.4 | 48.5 | 52.4 | 46.3 | 44.4 | 48.3 |
| One | 23.0 | 22.1 | 24.0 | 22.0 | 20.4 | 23.7 | 22.2 | 20.6 | 23.9 | 24.9 | 23.3 | 26.6 |
| Two or more | 27.5 | 26.6 | 28.5 | 26.5 | 25.0 | 28.1 | 27.3 | 25.7 | 29.1 | 28.8 | 27.1 | 30.4 |
| Province | ||||||||||||
| British Columbia | 14.4 | 14.1 | 14.7 | 17.6 | 16.1 | 19.3 | 11.0 | 9.4 | 12.7 | 14.7 | 13.0 | 16.6 |
| Alberta | 12.0 | 11.7 | 12.2 | 20.5 | 18.9 | 22.3 | 8.6 | 7.2 | 10.3 | 6.4 | 5.3 | 7.7 |
| Saskatchewan | 2.2 | 2.1 | 2.3 | 4.2 | 3.8 | 4.7 | 1.4 | 1.0 | 1.9 | 0.8 | 0.5 | 1.2 |
| Manitoba | 2.8 | 2.8 | 2.9 | 3.2 | 2.7 | 3.8 | 2.9 | 2.4 | 3.5 | 2.4 | 1.9 | 2.9 |
| Ontario | 42.6 | 42.2 | 43.0 | 34.1 | 31.7 | 36.5 | 46.1 | 43.6 | 48.7 | 48.0 | 45.4 | 50.6 |
| Quebec | 22.2 | 21.9 | 22.6 | 16.7 | 14.9 | 18.7 | 26.9 | 24.8 | 29.2 | 23.0 | 20.8 | 25.4 |
| New Brunswick | 1.4 | 1.3 | 1.5 | 1.1 | 0.8 | 1.5 | 1.1 | 0.8 | 1.5 | 2.1 | 1.8 | 2.5 |
| Nova Scotia | 1.5 | 1.4 | 1.6 | 1.6 | 1.2 | 2.0 | 1.2 | 0.9 | 1.6 | 1.7 | 1.3 | 2.2 |
| Newfoundland and Labrador | 0.8 | 0.8 | 0.9 | 0.9 | 0.7 | 1.2 | 0.8 | 0.6 | 1.1 | 0.8 | 0.6 | 1.1 |
... not applicable
|
||||||||||||
Agreement between individual- and area-level community belonging measures was low. The expected agreement between the two measures was 58.4%, and the observed agreement was slightly higher at 60.4%. The computed kappa score of 0.05 indicates no to slightagreement.
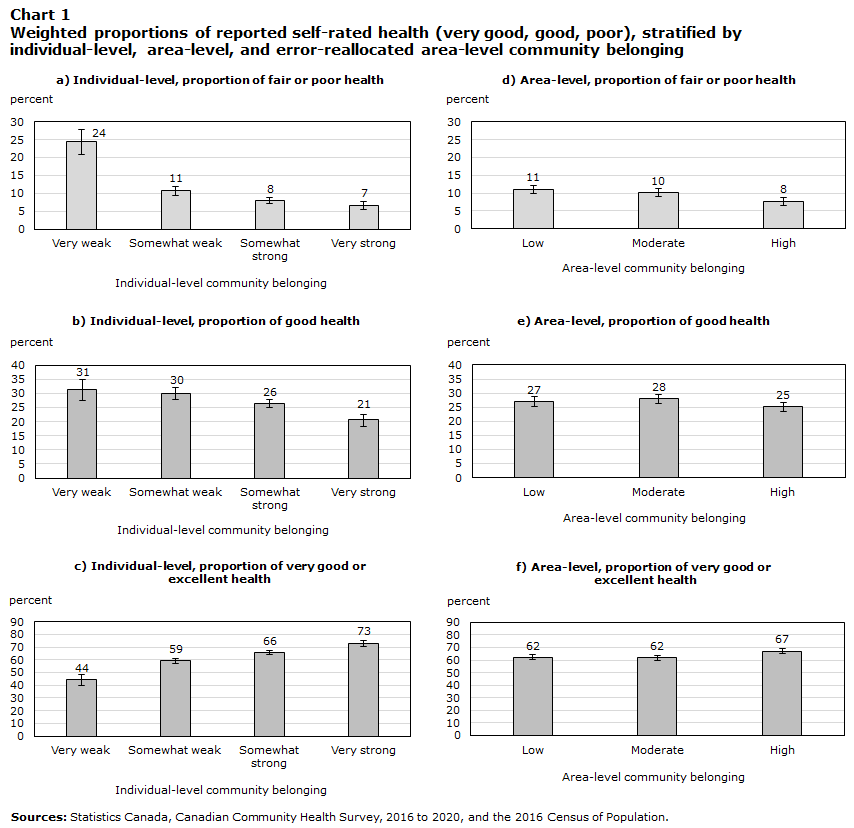
Self-rated health differed by area-level community belonging but varied more strongly by individual-level sense of belonging (Chart 1). The proportion of those reporting very good or excellent self-rated health was high among those living in neighbourhoods with strong area-level community belonging (67%), but even higher among those reporting very strong individual-level community belonging (73%). In contrast, the proportion of those reporting fair or poor self-rated health was high among those living in neighbourhoods with low community belonging (11%), and even higher among those reporting very weak individual-level community belonging (24%). Similar proportions of those reporting very good or excellent, good, and fair or poor health were seen across categories of the main variable for area-level community belonging and the error reallocated variable (Appendix Table A1a and A1b).
Description of Chart 1
| percent | 95% confidence interval | ||
|---|---|---|---|
| lower | upper | ||
| Individual-level | |||
| a) Individual-level, proportion of fair or poor health | |||
| Very weak | 24 | 3.67 | 3.33 |
| Somewhat weak | 11 | 1.34 | 1.21 |
| Somewhat strong | 8 | 0.88 | 0.80 |
| Very strong | 7 | 1.24 | 1.06 |
| b) Individual-level, proportion of good health | |||
| Very weak | 31 | 3.82 | 3.59 |
| Somewhat weak | 30 | 2.15 | 2.07 |
| Somewhat strong | 26 | 1.40 | 1.36 |
| Very strong | 21 | 2.22 | 2.06 |
| c) Individual-level, proportion of very good or excellent health | |||
| Very weak | 44 | 4.19 | 4.11 |
| Somewhat weak | 59 | 2.20 | 2.24 |
| Somewhat strong | 66 | 1.52 | 1.55 |
| Very strong | 73 | 2.29 | 2.41 |
| Area-level | |||
| d) Area-level, proportion of fair or poor health | |||
| Poor | 11 | 1.14 | 1.05 |
| Moderate | 10 | 1.08 | 0.99 |
| Very good or excellent | 8 | 1.15 | 1.01 |
| e) Area-level, proportion of good health | |||
| Poor | 27 | 1.85 | 1.77 |
| Moderate | 28 | 1.71 | 1.65 |
| Very good or excellent | 25 | 1.67 | 1.60 |
| f) Area-level, proportion of very good or excellent health | |||
| Poor | 62 | 1.96 | 2.00 |
| Moderate | 62 | 1.80 | 1.83 |
| Very good or excellent | 67 | 1.78 | 1.83 |
| Sources: Statistics Canada, Canadian Community Health Survey, 2016 to 2020, and the 2016 Census of Population. | |||
The multinomial logistic regression models indicated an association between living in neighbourhoods with low area-level community belonging and reporting very weak individual-level community belonging (Table 2). After adjusting for all individual-level covariates, the odds of reporting a very weak versus a very strong sense of individual-level community belonging was 1.89 times higher (95% CI: 1.44, 2.47) for those living in neighbourhoods with moderate community belonging and 1.75 times higher (95% CI: 1.32, 2.31) for those living in neighbourhoods with low community belonging, compared with those living in neighbourhoods with high community belonging. The odds of reporting an intermediate sense of community belonging, compared with a very strong sense of individual-level community belonging, were generally higher for those living in neighbourhoods with moderate and low community belonging. However, these estimates were imprecisely estimated and hence inconclusive when compared with those living in neighbourhoods with high community belonging. When the area-level variable with error reallocated terciles was employed (Appendix Table A1a and A1b), estimates were strengthened for the odds of reporting a very weak versus a very strong sense of individual-level community belonging for those living in neighbourhoods with low community belonging (odds ratio [OR]: 2.59; 95% CI: 1.56, 4.31), compared with those living in neighbourhoods with high community belonging, after adjusting for all individual-level covariates. Estimates were also strengthened for those living in neighbourhoods with moderate community belonging compared with those in neighbourhoods with high community belonging (OR: 2.42; 95% CI: 1.53, 3.85). The odds of reporting a somewhat weak versus a very strong sense of individual-level community belonging was also conclusively higher for those living in neighbourhoods with moderate and weak community belonging.
| Individual-level community belongingTable 2 Note 1 |
Adjusted for age and sex | Adjusted for all covariatesTable 2 Note 2 | ||||
|---|---|---|---|---|---|---|
| Adjusted odds ratios |
95% confidence interval | Adjusted odds ratios |
95% confidence interval | |||
| from | to | from | to | |||
| Somewhat strong | ||||||
| Area-level community belonging | ||||||
| High | 1.00 | Note ...: not applicable | Note ...: not applicable | 1.00 | Note ...: not applicable | Note ...: not applicable |
| Moderate | 1.19Note * | 1.02 | 1.40 | 1.23Note * | 1.04 | 1.44 |
| Low | 1.03 | 0.88 | 1.21 | 1.10 | 0.93 | 1.30 |
| Somewhat weak | ||||||
| Area-level community belonging | ||||||
| High | 1.00 | Note ...: not applicable | Note ...: not applicable | 1.00 | Note ...: not applicable | Note ...: not applicable |
| Moderate | 1.23Note * | 1.01 | 1.50 | 1.27Note * | 1.04 | 1.56 |
| Low | 1.15 | 0.96 | 1.40 | 1.21 | 0.99 | 1.48 |
| Very weak | ||||||
| Area-level community belonging | ||||||
| High | 1.00 | Note ...: not applicable | Note ...: not applicable | 1.00 | Note ...: not applicable | Note ...: not applicable |
| Moderate | 1.88Note ** | 1.45 | 2.44 | 1.89Note ** | 1.44 | 2.47 |
| Low | 1.75Note ** | 1.36 | 2.26 | 1.75Note ** | 1.32 | 2.31 |
... not applicable
|
||||||
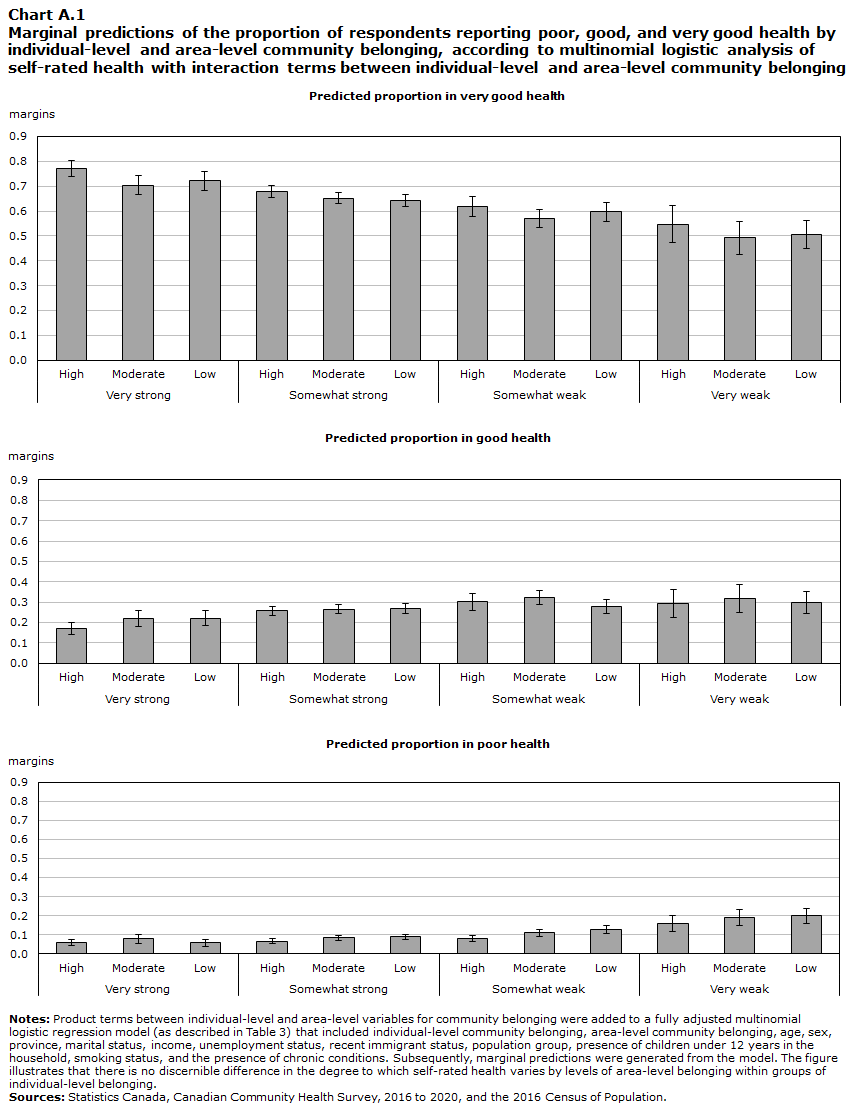
Table 3 summarizes the results of multinomial logistic models when individual-level and area-level community belonging are modelled in 1) separate models adjusting for age and sex, 2) separate models adjusting for all covariates, and 3) a single combined model with self-rated health, adjusting for all covariates. When modelled separately and adjusting for individual-level factors, those living in neighbourhoods with low area-level community belonging exhibited 1.6 times the odds (95% CI:1.28, 2.00) of reporting the poorest levels of self-rated health compared with those living in neighbourhoods with high area-level community belonging, while those reporting very weak individual-level community belonging exhibited 6.18 times the odds (95% CI: 4.51, 8.47) of reporting the poorest levels of self-rated health compared with those reporting very strong individual-level community belonging. Combined models that included both area-level and individual-level community belonging indicate that the independent association between low area-level community belonging and poor self-rated health is attenuated but persistent (OR:1.53; 95% CI: 1.22, 1.91) when comparing those living in neighbourhoods with low area-level community belonging to those living in neighbourhoods with high area-level community belonging. Incrementally lower levels of individual-level community belonging also remained strongly associated with fair or poor and good self-rated health in comparison to very good or excellent self-rated health. For combined models, those reporting very weak individual-level community belonging exhibited 5.98 times the odds (95% CI: 4.36, 8.21) of reporting the poorest levels of self-rated health, compared to those reporting very strong individual-level belonging. The positive associations between individual-level community belonging and health remained conclusive when comparing good versus very good or excellent health. Positive associations between area-level community belonging and health when comparing good versus very good or excellent health were in the same direction as those found when comparing fair or poor versus very good or excellent health. However, these were imprecisely estimated and therefore inconclusive. Sensitivity analyses performed using the area-level community belonging variable with error reallocated terciles exhibited similar direction in the effect estimates to the main analysis but were imprecisely estimated and therefore inconclusive (Appendix Table A1a and A1b). Models that included interaction terms between area- and individual-level community belonging yielded no strong evidence of interaction between individual- and area-level community belonging observed for models of self-rated health, as indicated by a joint test of significance of all interaction terms (P = 0.4924) and marginal predictions generated from the model (Chart A1).
| Self-reported healthTable 3 Note 1 | Separate models, age and sex adjusted |
Separate models, adjustedTable 3 Note 2 | Combined model, adjustedTable 3 Note 2 | ||||||
|---|---|---|---|---|---|---|---|---|---|
| Adjusted odds ratios |
95% confidence interval |
Adjusted odds ratios |
95% confidence interval |
Adjusted odds ratios |
95% confidence interval |
||||
| from | to | from | to | from | to | ||||
| Good | |||||||||
| Individual-level community belonging | |||||||||
| Very strong | 1.00 | Note ...: not applicable | Note ...: not applicable | 1.00 | Note ...: not applicable | Note ...: not applicable | 1.00 | Note ...: not applicable | Note ...: not applicable |
| Somewhat strong | 1.52Note ** | 1.32 | 1.77 | 1.52Note ** | 1.31 | 1.77 | 1.51Note ** | 1.30 | 1.76 |
| Somewhat weak | 2.02Note ** | 1.71 | 2.40 | 2.00Note ** | 1.68 | 2.39 | 1.99Note ** | 1.67 | 2.38 |
| Very weak | 2.86Note ** | 2.26 | 3.61 | 2.56Note ** | 2.02 | 3.24 | 2.51Note ** | 1.98 | 3.18 |
| Area-level community belonging | |||||||||
| High | 1.00 | Note ...: not applicable | Note ...: not applicable | 1.00 | Note ...: not applicable | Note ...: not applicable | 1.00 | Note ...: not applicable | Note ...: not applicable |
| Moderate | 1.25Note ** | 1.11 | 1.41 | 1.22Note ** | 1.07 | 1.39 | 1.19Note ** | 1.04 | 1.35 |
| Low | 1.25Note ** | 1.09 | 1.42 | 1.15Note * | 1.00 | 1.33 | 1.13 | 0.98 | 1.30 |
| Fair or poor | |||||||||
| Individual-level community belonging | |||||||||
| Very strong | 1.00 | Note ...: not applicable | Note ...: not applicable | 1.00 | Note ...: not applicable | Note ...: not applicable | 1.00 | Note ...: not applicable | Note ...: not applicable |
| Somewhat strong | 1.55Note ** | 1.23 | 1.94 | 1.51Note ** | 1.18 | 1.93 | 1.50Note ** | 1.17 | 1.92 |
| Somewhat weak | 2.62Note ** | 2.06 | 3.33 | 2.46Note ** | 1.90 | 3.19 | 2.44Note ** | 1.87 | 3.16 |
| Very weak | 8.30Note ** | 6.16 | 11.18 | 6.18Note ** | 4.51 | 8.47 | 5.98Note ** | 4.36 | 8.21 |
| Area-level community belonging | |||||||||
| High | 1.00 | Note ...: not applicable | Note ...: not applicable | 1.00 | Note ...: not applicable | Note ...: not applicable | 1.00 | Note ...: not applicable | Note ...: not applicable |
| Moderate | 1.55Note ** | 1.27 | 1.88 | 1.54Note ** | 1.24 | 1.91 | 1.47Note ** | 1.19 | 1.83 |
| Low | 1.85Note ** | 1.52 | 2.25 | 1.60Note ** | 1.28 | 2.00 | 1.53Note ** | 1.22 | 1.91 |
... not applicable
|
|||||||||
Discussion
This study is a first assessment of whether novel SAEs of community belonging might be useful for health-related research. The limited agreement between area-level and individual-level community belonging, and the independent association between area-level community belonging and self-rated health, suggest that the area-level measures are independently meaningful, as opposed to being a simple proxy for individual-level measures of belongingAlthough agreement between area-level and individual-level measures of community belonging was limited—a pattern that echoes the discordance between area-level and individual-level measures seen for other characteristics such as socioeconomic statusNote 35—this study also showed that area-level community belonging was associated with more favourable self-rated health even after adjusting for individual-level community belonging and other factors. This would lend support to a collective, contextual explanation for the relationship between community belonging and self-rated health:Note 7 Regardless of how individuals perceive their connection to their community, the collective sense of belonging within their neighbourhood matters to self-rated health. Sensitivity analyses that employed the area-level community belonging measure with error reallocated terciles rendered stronger contrasts between the highest and the lowest community belonging neighbourhoods for models of individual-level community belonging and rendered weaker inconclusive associations with self-rated health—likely a result of smaller sample sizes in the highest and lowest terciles (Appendix Table A1a and A1b). However, estimates were similar in direction to the main analysis.
As seen previously with social capital, the relationship between community belonging and self-rated health was more modest for area-level belonging than for individual-level belonging. Regarding the potential interaction between area-level community belonging and individual-level community belonging, the idea that robust community belonging at the neighbourhood level might have a greater positive effect on the health of individuals who already have a strong sense of belonging to their community was investigated.Note 23 Conversely, it has been suggested that strong community-wide belonging could be detrimental to those with a weaker sense of community belonging—the notion that the positive social and material benefits derived from ecological social capital and health applies primarily to “in-group” members and are not necessarily extended to “out-group” members.Note 36 However, there was no evidence of an interaction between area-level and individual-level measures; hence, there was no evidence of a differential benefit or disadvantage derived from area-level community belonging between individuals with a weak individual sense of belonging and those with a strong individual sense of belonging.
The weaker and less consistent relationship between health and area-level social capital in the literature may be because of measurement error and differences in the geographic scale used across studies, as others have pointed out.Note 8, Note 12 Geographic units can range from small administrative areasNote 8 to statesNote 37 and entire countries.Note 22 One strength of the present study is the use of CTs - a small geographic unit that is more homogeneous and representative of respondents’ local neighbourhoods. Another possible explanation for the lack of consistency across studies of area-level social capital and health is the differences in, and the ongoing refinement of how, social capital is defined, measured, and conceptualized as a complex multidimensional construct.Note 38, Note 39, Note 40 Like social capital, community belonging is a multidimensional concept that encompasses social ties and trust with one’s community, how attached or “rooted” people are to their community, and the physical and social characteristics of the neighbourhood itself.Note 6 A single measure of community belonging that focuses, for example, only on individual social ties to a community may underestimate the ways and the extent to which people are connected to a community. This, in turn, can underestimate associations between community belonging and health. Moreover, the effect of community belonging on health is likely to depend on the specific health outcome being examined.
Limitations
Although the secondary research use of these SAEs as area-level variables of community belonging is promising, researchers conducting such analyses with SAEs should be aware of some limitations. The first is their limited utility as proxies for individual-level community belonging, as previously mentioned. This study suggests that SAEs for community belonging should be interpreted and used as independent measures of neighbourhood community belonging. They can also potentially serve as complementary area-level measures to individual-level measures.
Second, a log-linear smoothing model was used to reduce the instability of area-level estimates in cases where the CT sample size was small.Note 25 This smoothing procedure could reduce true differences between neighbourhoods and have the overall effect of attenuating the strength of the associations observed. Moreover, the SAEs were produced with measurement error. There is no established approach for incorporating observation-level variance estimates into models for independent variables. Two measures were taken to address these limitations and determine whether dividing neighbourhoods into terciles meaningfully distinguishes neighbourhoods of high, moderate, and low collective sense of community belonging. First, the use of terciles, rather than the continuous score, addresses the lack of precision of the SAEs by grouping similar values together, thereby reducing the potential influence of minor variations in measurement. Second, in view of this and the narrow range of estimates (Appendix Table A1a and A1b), an additional three-category classification in which terciles were reallocated based on the CIs derived from each variance estimate was employed to further differentiate the SAE values of the highest tercile from those of the lowest tercile. These sensitivity analyses rendered imprecise effect estimates, but they were in the same direction as those in the primary analysis. This showed that the original tercile-based classificationNote 25 of the area-level measure is sufficient and meaningful for delineating neighbourhoods by community belonging.
A third and final limitation involves the temporal period of the survey years under study and the cross-sectional nature of this analysis. Low response rates for the 2020 CCHS heighten the risk of selection bias,Note 41 and the COVID-19 pandemic may have also differentially affected neighbourhoods and individuals of varying levels of community belonging and different characteristics.Note 42 While these aspects warrant caution when generalizing the findings of this study, the challenges posed by the 2020 CCHS are somewhat mitigated by the application of survey weights that account for non-response. Although community belonging and self-rated health in 2020 may exhibit variations when compared with other years, there are no compelling grounds to anticipate substantive alterations in the association between community belonging and health. The cross-sectional design of this study also precludes causal inferences from being made between community belonging and health and, furthermore, does not permit the determination of the extent to which reverse causality underlies the relationship between community belonging and health. Individuals with good self-rated health may be more likely to be able to participate in the community and build social contacts, while those with poor health may face barriers to participation and relationship building within their community. However, the area-level measure of community belonging is derived from data collected from 2016 to 2019, which precede individual-level self-rated health in 2020. While these aspects are limitations for the current study, future research efforts may leverage this phenomenon to assess longitudinal changes in community belonging for individuals and neighbourhoods to identify potential policy areas to mitigate the effects of future shock events.Note 43
Conclusion
This study suggests that the novel SAEs of community belonging can be understood and used appropriately as independent measures of neighbourhood-level community belonging. A sense of belonging necessitates a community to which one can belong and is likely to operate, at least partly, independently of an individual’s sense of belonging. Researchers who intend to use area-level measures of community belonging as substitutes for individual-level measures in studies where such measures are missing or absent should do so with caution because agreement between the individual-level and area-level measures is limited. As the quantity, quality, and detail of environmental and survey data advances, ongoing research to identify neighbourhood determinants of community belonging6 and other aspects of social capital will be necessary to inform policy efforts for improving the quality of life and well-being of Canadians.
Appendix 1
| Area-level community belonging , terciles |
Area-level community belonging , error re-allocated tercilesNote * |
|||||
|---|---|---|---|---|---|---|
| low | moderate | high | low | moderate | high | |
| Small area estimates descriptive statistics. | ||||||
| Number of Census tracts | 1,886 | 1,885 | 1,885 | 1,101 | 4,111 | 444 |
| Sense of community belonging score | ||||||
| Mean | 2.76 | 2.82 | 2.85 | 2.74 | 2.82 | 2.90 |
| Standard deviation | 0.04 | 0.01 | 0.05 | 0.03 | 0.01 | 0.07 |
| Minimum | 2.67 | 2.80 | 2.82 | 2.67 | 2.69 | 2.85 |
| Maximum | 2.80 | 2.82 | 3.39 | 2.78 | 2.85 | 3.39 |
| Minimum lower 95% Confidence interval | 2.49 | 2.76 | 2.78 | 2.56 | 2.49 | 2.80 |
| Maximum upper 95% Confidence interval | 2.98 | 2.87 | 3.78 | 2.82 | 2.98 | 3.78 |
| Canadian Community Health Survey respondents | ||||||
| Percent of total population (%) | 33.9 | 34.3 | 31.8 | 20.7 | 72.9 | 6.3 |
| Individual-level sense of community belonging | ||||||
| Very strong (%) | 16.3 | 15.4 | 18.9 | 15.3 | 17.0 | 20.5 |
| Somewhat strong (%) | 48.8 | 51.4 | 51.7 | 49.4 | 50.6 | 55.2 |
| Somewhat weak (%) | 26.2 | 24.9 | 24.0 | 27.3 | 24.7 | 21.0 |
| Very weak (%) | 8.7 | 8.4 | 5.3 | 8.0 | 7.7 | 3.4 |
| Self-rated health (logit-derived) | ||||||
| Very good/excellent (%) | 62.1 | 61.8 | 67.2 | 63.7 | 63.2 | 68.4 |
| Good (%) | 26.9 | 28.0 | 25.1 | 26.5 | 27.1 | 23.2 |
| Fair/poor (%) | 11.0 | 10.2 | 7.7 | 9.7 | 9.8 | 8.3 |
Sources: Statistics Canada, Canadian Community Health Survey 2016 to 2020, Canadian Census 2016. |
||||||
| Area-level community belonging , terciles |
Area-level community belonging , error re-allocated tercilesNote * |
|||||
|---|---|---|---|---|---|---|
| Adjusted odds ratios |
95% confidence interval |
Adjusted odds ratios |
95% confidence interval |
|||
| from | to | from | to | |||
| Individual-level community belongingAppendix Table A1b Note † | ||||||
| Somewhat strong | ||||||
| Area-level community belonging | ||||||
| High | 1.00 | Note ...: not applicable | Note ...: not applicable | 1.00 | Note ...: not applicable | Note ...: not applicable |
| Moderate | 1.23 | 1.04 | 1.44 | 1.07 | 0.84 | 1.37 |
| Low | 1.10 | 0.93 | 1.30 | 1.16 | 0.88 | 1.53 |
| Somewhat weak | ||||||
| Area-level community belonging | ||||||
| High | 1.00 | Note ...: not applicable | Note ...: not applicable | 1.00 | Note ...: not applicable | Note ...: not applicable |
| Moderate | 1.27 | 1.04 | 1.56 | 1.38 | 1.02 | 1.86 |
| Low | 1.21 | 0.99 | 1.48 | 1.56 | 1.11 | 2.20 |
| Very weak | ||||||
| Area-level community belonging | ||||||
| High | 1.00 | Note ...: not applicable | Note ...: not applicable | 1.00 | Note ...: not applicable | Note ...: not applicable |
| Moderate | 1.89 | 1.44 | 2.47 | 2.42 | 1.53 | 3.85 |
| Low | 1.75 | 1.32 | 2.31 | 2.59 | 1.56 | 4.31 |
| Self-rated healthAppendix Table A1b Note ‡ | ||||||
| Good | ||||||
| Area-level community belonging | ||||||
| High | 1.00 | Note ...: not applicable | Note ...: not applicable | 1.00 | Note ...: not applicable | Note ...: not applicable |
| Moderate | 1.19 | 1.04 | 1.35 | 1.26 | 0.99 | 1.59 |
| Low | 1.13 | 0.98 | 1.3 | 1.24 | 0.96 | 1.61 |
| Fair/poor | ||||||
| Area-level community belonging | ||||||
| High | 1.00 | Note ...: not applicable | Note ...: not applicable | 1.00 | Note ...: not applicable | Note ...: not applicable |
| Moderate | 1.47 | 1.19 | 1.83 | 1.28 | 0.95 | 1.75 |
| Low | 1.53 | 1.22 | 1.91 | 1.35 | 0.95 | 1.92 |
... not applicable
|
||||||
Description of Chart A1
| Individual-level and area-level community belonging | Margin | 95% confidence interval | |
|---|---|---|---|
| from | to | ||
| Predicted proportion in very good health | |||
| Very strong | |||
| High | 0.771 | 0.740 | 0.801 |
| Moderate | 0.704 | 0.665 | 0.743 |
| Low | 0.721 | 0.683 | 0.760 |
| Somewhat strong | |||
| High | 0.678 | 0.654 | 0.702 |
| Moderate | 0.652 | 0.628 | 0.676 |
| Low | 0.643 | 0.618 | 0.668 |
| Somewhat weak | |||
| High | 0.619 | 0.577 | 0.660 |
| Moderate | 0.569 | 0.532 | 0.605 |
| Low | 0.597 | 0.559 | 0.634 |
| Very weak | |||
| High | 0.547 | 0.473 | 0.621 |
| Moderate | 0.492 | 0.424 | 0.559 |
| Low | 0.504 | 0.448 | 0.561 |
| Predicted proportion in good health | |||
| Very strong | |||
| High | 0.169 | 0.141 | 0.198 |
| Moderate | 0.219 | 0.182 | 0.257 |
| Low | 0.222 | 0.185 | 0.259 |
| Somewhat strong | |||
| High | 0.257 | 0.233 | 0.280 |
| Moderate | 0.266 | 0.243 | 0.288 |
| Low | 0.269 | 0.244 | 0.294 |
| Somewhat weak | |||
| High | 0.302 | 0.260 | 0.344 |
| Moderate | 0.323 | 0.287 | 0.359 |
| Low | 0.279 | 0.243 | 0.314 |
| Very weak | |||
| High | 0.294 | 0.225 | 0.363 |
| Moderate | 0.318 | 0.250 | 0.385 |
| Low | 0.298 | 0.243 | 0.353 |
| Predicted proportion in poor health | |||
| Very strong | |||
| High | 0.060 | 0.044 | 0.076 |
| Moderate | 0.077 | 0.055 | 0.099 |
| Low | 0.057 | 0.038 | 0.076 |
| Somewhat strong | |||
| High | 0.065 | 0.052 | 0.079 |
| Moderate | 0.082 | 0.069 | 0.095 |
| Low | 0.088 | 0.075 | 0.101 |
| Somewhat weak | |||
| High | 0.079 | 0.061 | 0.096 |
| Moderate | 0.108 | 0.089 | 0.127 |
| Low | 0.125 | 0.104 | 0.146 |
| Very weak | |||
| High | 0.159 | 0.115 | 0.203 |
| Moderate | 0.191 | 0.149 | 0.233 |
| Low | 0.198 | 0.161 | 0.235 |
|
Notes: Product terms between individual-level and area-level variables for community belonging were added to a fully adjusted multinomial logistic regression model (as described in Table 3) that included individual-level community belonging, area-level community belonging, age, sex, province, marital status, income, unemployment status, recent immigrant status, population group, presence of children under 12 years in the household, smoking status, and the presence of chronic conditions. Subsequently, marginal predictions were generated from the model. The figure illustrates that there is no discernible difference in the degree to which self-rated health varies by levels of area-level belonging within groups of individual-level belonging. Sources: Statistics Canada, Canadian Community Health Survey, 2016 to 2020, and the 2016 Census of Population. |
|||
Appendix 2
Method, calculations, and contingency for Kappa measures of agreement
Cohen’s Kappa Statistic was calculated as follows: Weighted frequencies were organized into a 3 X 4 contingency table as modeled below. Diagonal cells a, d, e, h, I, l were considered agreements between the two measures, cells b, c, f, g, j, k were considered non-agreement. Percentage of agreement observed was calculated by summing the values in agreement (a, d, e, h, i, l) and dividing by the overall total (N).
| Individual-level community belonging | Area-level community belonging | |||
|---|---|---|---|---|
| high | moderate | low | Total | |
| Strong | a | b | c | (a+b+c) |
| Somewhat strong | d | e | f | (d+e+f) |
| Somewhat weak | g | h | i | (g+h+i) |
| Weak | j | k | l | (j+k+l) |
| Total | (a+d+g+j) | (b+e+h+k) | (c+f+i+l) | N |
| Source: Authors tabulations. | ||||
Expected frequencies for these cells were calculated by multiplying row totals with column totals and dividing by the overall total (N), as shown below. Percentage of agreement expected by chance was then calculated by dividing the sum of expected frequencies by the overall total (N).
| Individual-level community belongins |
Area-level community belonging | |||
|---|---|---|---|---|
| high | moderate | low | Total | |
| Strong | (a+d+g+i)(a+b+c)/N | ... | ... | (a+b+c) |
| Somewhat strong | (a+d+g+i)(d+e+f)/N | (b+e+h+k)(d+e+f)/N | ... | (d+e+f) |
| Somewhat weak | ... | (b+e+h+k)(g+h+i)/N | (c+f+i+l)(g+h+i)/N | (g+h+i) |
| Weak | ... | ... | (c+f+i+l)(j+k+l)/N | (j+k+l) |
| Total | (a+d+g+j) | (b+e+h+k) | (c+f+i+l) | N |
| … not applicable Source: Authors tabulations. |
||||
Kappa was then calculated as follows:
- Date modified: