
Health Reports
The ongoing impact of the COVID-19 pandemic on physical activity and screen time among Canadian adults

DOI: https://www.doi.org/10.25318/82-003-x202301000002-eng
Abstract
Background
Canadian and international research has shown that the COVID-19 pandemic led to changes in health behaviours, including participation in physical activity and screen time.
Methods
The Canadian Community Health Survey asks Canadian adults (aged 18 to 64 years) and older adults (aged 65 and older) to report the time they spend active by domain: recreation, transportation, and household and/or occupation. Survey respondents are also asked to report their screen time on days they worked and days they did not work. The present analysis compares the physical activity from four cross-sectional samples collected during 2018 (n=50,093), January to mid-March 2020 (n=13,933), September to December 2020 (n=25,661) and January 2021 to February 2022 (n=45,742). Screen time is compared between 2018 and 2021. Sub-annual analyses examine how physical activity and screen time varied within and between years.
Results
The percentage of 18- to 64-year-old women meeting the physical activity recommendation did not change from 2018 (54.3%) to 2021 (55.1%), while a slight decrease was observed among men (63.0% in 2018 to 59.8% in 2021). The percentage of adults aged 65 years and older meeting the recommendation increased from 2018 to 2021 among both men (40.7% to 43.8%) and women (33.4% to 36.9%). Total physical activity decreased by 17.5 minutes per week among 18- to 64-year-old men and increased by 8.4 minutes per week among 18- to 64-year-old women. Men and women aged 65 and older increased their total physical activity by about 30 minutes per week from 2018 to 2021. The percentage of 18- to 64-year-old adults in the lowest screen time category decreased from 53.9% in 2018 to 45.0% in 2021 on work days and from 37.8% in 2018 to 28.0% in 2021 on non-work days. The percentage of adults aged 65 and older in the lowest screen time category decreased from 49.4% in 2018 to 37.8% in 2021 on work days and from 29.4% in 2018 to 21.5% in 2021 on non-work days.
Interpretation
Physical activity among men aged 18 to 64 years decreased from 2018 to 2021, while women of this age group maintained their physical activity. Older adults increased their physical activity from 2018 to 2021. Many Canadian adults shifted from the lowest screen time category (two hours or less per day) to the highest screen time category (four hours or more per day) during the 2020 and 2021 pandemic years. It is unknown whether the short-term impact of the COVID-19 pandemic on physical activity and screen time will persist over time. Ongoing surveillance of the longer-term impacts of the pandemic on the health behaviours of Canadians is important.
Keywords
movement, exercise, sport, remote work, television
Authors
Rachel C. Colley is with the Health Analysis Division at Statistics Canada. Travis J. Saunders is with the University of Prince Edward Island.
What is already known on this subject?
- Opportunities for organized physical activity decreased during the 2020 and 2021 COVID-19 pandemic years because of public health restrictions implemented to reduce virus transmission.
- A previous analysis of Canadian Community Health Survey data revealed relative stability in physical activity among Canadian adults from the fall of 2018 to the fall of 2020.
- Canadian adults who reported exercising outdoors and minimizing screen time were more likely to report better general health and mental health.
What does this study add?
- Women aged 18 to 64 years maintained their physical activity from 2018 and through the 2020 and 2021 pandemic years, while a slight decline was observed during this time among 18- to 64 year-old men.
- Older Canadians increased their physical activity during the 2020 and 2021 pandemic years by an average of 30 minutes per week.
- Many Canadian adults shifted from the lowest screen time category (two hours or less per day) to the highest screen time category (four hours or more per day) during the 2020 and 2021 pandemic years.
Introduction
Lockdowns and closures because of the COVID-19 pandemic reduced opportunities for many forms of organized sport and recreation.Note 1 In addition, stay-at-home orders caused a shift to remote work and led to an increased reliance on screens. Few data sources tracked health behaviours both before and during the COVID-19 pandemic. A previous analysis reported that physical activity decreased among youth but remained stable among Canadian adults and increased slightly among older adults from the fall of 2018 to the fall of 2020.Note 2, Note 3 A study using data from the Canadian Perspectives Survey Series (CPSS) reported that outdoor exercise increased among adults aged 25 and older across three time points from March 29, 2020, to July 26, 2020.Note 4 Another survey using CPSS data reported that 60% of adults aged 25 and older reported increasing their screen time,Note 5 a finding similar to a small study of Canadian women that reported increased recreational screen time during the 2020 and 2021 pandemic years.Note 6 A U.S.-based study compared physical activity and sedentary behaviour between the fall of 2019 and fall of 2020 and reported a similar stability in these behaviours among American adults.Note 7 Adults with young children at home were identified as more likely to decrease their physical activity and increase their screen time during the 2020 and 2021 pandemic years in Canada4 and the United States.Note 7
It is important to track ongoing trends in physical activity and screen time among Canadians to determine whether lifestyle habits have rebounded to pre-pandemic levels, worsened, or improved. Physical activity is an important health determinant, and those who maintained their level of physical activity and avoided increases in screen time during the 2020 and 2021 pandemic years reported better mental health outcomes.Note 8, Note 9 The Canadian Community Health Survey (CCHS) is an annual cross-sectional survey that collects information on health status, health care use and health determinants for the Canadian population. Information about physical activity was collected from CCHS participants during the fall of 2020 and 2021 (i.e., during the pandemic) using the same questionnaire modules used with participants in 2018 and early 2020 (before the pandemic). This continuity in questionnaire content facilitates a comparison between two periods before the pandemic and two periods during the pandemic. An examination of the dataset focusing on youth highlighted important differences in the activity trajectories of boys and girls during the pandemic.Note 10 The purpose of this study is to compare screen time and physical activity before and during the 2020 and 2021 pandemic years among Canadian adults and older adults.
Methods
Data source
The present analysis includes self-reported CCHS data on physical activity and screen time data for Canadian adults aged 18 and older. Annual data for 2018 (n=50,093) and 2021 (n=45,742) are compared (Table 1). Data are also presented by collection period (figures 1 to 5). Collection periods are approximately three months long and are each representative of the Canadian population. The CCHS covers the population aged 12 years and older living in the 10 provinces and 3 territories. Excluded from the survey’s coverage are people living on reserves and other Indigenous settlements in the provinces, full-time members of the Canadian Forces, the institutionalized population, and people living in the Quebec health regions of Région du Nunavik and Région des Terres-Cries-de-la-Baie-James. These exclusions represent less than 3% of the Canadian population. Annual data files exclude data from the territories as two years of data are required to obtain data representative of this region. The pandemic had major impacts on data collection operations for the 2020 CCHS. Important analytical and data quality implications related to the 2020 data are described elsewhere.Note 2, Note 11 Given the unusual nature of 2020, the data preceding the pandemic (January to mid-March, n=13,933) are presented separately from the data during the pandemic (August to December, n=25,661) (tables 1 and 2). Physical activity and screen time data were not collected in 2019 in a full sample and therefore data from 2019 are not included in the present analysis. Screen time data were only collected on a national sample in 2018 and 2021.
| 2018 | 2020 | 2021 | ||||||||||
|---|---|---|---|---|---|---|---|---|---|---|---|---|
| January to December | January to March | September to December | January to December | |||||||||
| Before the pandemic | During the 2020 and 2021 pandemic years | |||||||||||
| % or mean |
95% confidence interval |
% or mean |
95% confidence interval |
% or mean |
95% confidence interval |
% or mean |
95% confidence interval |
|||||
| from | to | from | to | from | to | from | to | |||||
| Adults aged 18 and older | ||||||||||||
| Percentage meeting physical activity recommendation (%) | ||||||||||||
| Both sexes | 54.1 | 53.3 | 54.8 | 52.7 | 51.1 | 54.2 | 53.2 | 52.0 | 54.4 | 53.6 | 52.8 | 54.4 |
| Men | 58.6 | 57.4 | 59.7 | 56.8 | 54.5 | 59.0 | 56.2Table 1 Note ‡ | 54.3 | 58.0 | 56.4Table 1 Note ‡ | 55.3 | 57.6 |
| Women | 49.7 | 48.6 | 50.7 | 48.7 | 46.6 | 50.7 | 50.4 | 48.8 | 52.0 | 50.8 | 49.6 | 51.9 |
| Total physical activity (minutes per day) | ||||||||||||
| Both sexes | 41.2 | 40.5 | 42.0 | 38.2Table 1 Note †† | 36.9 | 39.6 | 41.0 | 39.8 | 42.1 | 41.5 | 40.7 | 42.4 |
| Men | 47.7 | 46.5 | 48.9 | 44.1Table 1 Note ‡ | 42.0 | 46.1 | 46.7 | 44.8 | 48.6 | 46.4 | 45.1 | 47.7 |
| Women | 35.0 | 34.1 | 35.8 | 32.6Table 1 Note ‡ | 30.9 | 34.3 | 35.4 | 34.0 | 36.7 | 36.8Table 1 Note ‡ | 35.7 | 37.9 |
| Recreational physical activity (minutes per day) | ||||||||||||
| Both sexes | 13.7 | 13.4 | 14.1 | 13.5 | 12.8 | 14.1 | 14.0 | 13.4 | 14.6 | 15.3Table 1 Note †† | 14.9 | 15.8 |
| Men | 15.6 | 15.0 | 16.1 | 15.1 | 14.1 | 16.1 | 15.3 | 14.4 | 16.3 | 16.7Table 1 Note ‡ | 16.0 | 17.3 |
| Women | 12.0 | 11.5 | 12.4 | 11.9 | 11.0 | 12.8 | 12.8 | 12.0 | 13.6 | 14.0Table 1 Note †† | 13.4 | 14.6 |
| Active transportation (minutes per day) | ||||||||||||
| Both sexes | 12.9 | 12.5 | 13.3 | 13.0 | 12.3 | 13.7 | 12.5 | 12.0 | 13.1 | 11.7Table 1 Note †† | 11.3 | 12.1 |
| Men | 13.8 | 13.2 | 14.4 | 14.5 | 13.5 | 15.6 | 13.7 | 12.8 | 14.6 | 12.4Table 1 Note ‡ | 11.8 | 12.9 |
| Women | 12.0 | 11.6 | 12.5 | 11.4 | 10.6 | 12.3 | 11.4 | 10.7 | 12.2 | 11.1Table 1 Note ‡ | 10.6 | 11.7 |
| Occupational/household physical activity (minutes per day) | ||||||||||||
| Both sexes | 14.9 | 14.4 | 15.3 | 12.0Table 1 Note †† | 11.2 | 12.8 | 14.6 | 13.8 | 15.3 | 14.7 | 14.2 | 15.2 |
| Men | 18.6 | 17.9 | 19.4 | 14.7Table 1 Note †† | 13.3 | 16.0 | 17.9 | 16.6 | 19.3 | 17.6 | 16.9 | 18.4 |
| Women | 11.2 | 10.7 | 11.7 | 9.4Table 1 Note ‡ | 8.5 | 10.4 | 11.3 | 10.5 | 12.1 | 11.8 | 11.2 | 12.4 |
| Adults aged 18 to 64 years | ||||||||||||
| Percentage meeting physical activity recommendation (%) | ||||||||||||
| Both sexes | 58.7 | 57.7 | 59.6 | 56.5 | 54.6 | 58.4 | 57.0 | 55.5 | 58.5 | 57.5 | 56.5 | 58.4 |
| Men | 63.0 | 61.6 | 64.3 | 60.2 | 57.5 | 62.8 | 59.2Table 1 Note ‡ | 56.9 | 61.3 | 59.8Table 1 Note ‡ | 58.4 | 61.3 |
| Women | 54.3 | 53.1 | 55.6 | 52.9 | 50.2 | 55.5 | 54.9 | 52.8 | 56.9 | 55.1 | 53.6 | 56.5 |
| Total physical activity (minutes per day) | ||||||||||||
| Both sexes | 45.2 | 44.3 | 46.1 | 41.6Table 1 Note †† | 39.9 | 43.3 | 44.0 | 42.7 | 45.4 | 44.6 | 43.5 | 45.6 |
| Men | 51.9 | 50.5 | 53.3 | 47.6Table 1 Note ‡ | 45.1 | 50.1 | 49.8 | 47.5 | 52.1 | 49.4Table 1 Note ‡ | 47.8 | 51.1 |
| Women | 38.5 | 37.4 | 39.5 | 35.6Table 1 Note ‡ | 33.4 | 37.7 | 38.3 | 36.6 | 40.0 | 39.7 | 38.3 | 41.0 |
| Recreational physical activity (minutes per day) | ||||||||||||
| Both sexes | 15.0 | 14.6 | 15.4 | 15.0 | 14.1 | 15.8 | 15.4 | 14.7 | 16.2 | 16.5Table 1 Note †† | 16.0 | 17.1 |
| Men | 16.7 | 16.1 | 17.3 | 16.4 | 15.2 | 17.7 | 16.5 | 15.3 | 17.6 | 17.7 | 16.8 | 18.5 |
| Women | 13.3 | 12.8 | 13.8 | 13.5 | 12.4 | 14.6 | 14.4Table 1 Note ‡ | 13.4 | 15.4 | 15.4Table 1 Note †† | 14.7 | 16.1 |
| Active transportation (minutes per day) | ||||||||||||
| Both sexes | 13.8 | 13.4 | 14.3 | 13.3 | 12.5 | 14.2 | 12.9Table 1 Note ‡ | 12.2 | 13.7 | 12.3Table 1 Note †† | 11.8 | 12.7 |
| Men | 14.7 | 14.0 | 15.4 | 14.9 | 13.6 | 16.2 | 14.1 | 13.0 | 15.2 | 12.8Table 1 Note †† | 12.1 | 13.5 |
| Women | 13.0 | 12.4 | 13.5 | 11.7Table 1 Note ‡ | 10.7 | 12.8 | 11.8Table 1 Note ‡ | 10.8 | 12.7 | 11.7Table 1 Note ‡ | 11.0 | 12.4 |
| Occupational/household physical activity (minutes per day) | ||||||||||||
| Both sexes | 16.6 | 16.0 | 17.2 | 13.5Table 1 Note †† | 12.6 | 14.5 | 15.9 | 14.9 | 16.8 | 16.0 | 15.4 | 16.6 |
| Men | 20.8 | 19.8 | 21.7 | 16.5Table 1 Note †† | 14.9 | 18.1 | 19.4 | 17.8 | 21.1 | 19.2 | 18.3 | 20.2 |
| Women | 12.4 | 11.8 | 13.0 | 10.6Table 1 Note ‡ | 9.4 | 11.7 | 12.3 | 11.3 | 13.2 | 12.7 | 11.9 | 13.5 |
| Adults aged 65 and older | ||||||||||||
| Percentage meeting physical activity recommendation (%) | ||||||||||||
| Both sexes | 36.8 | 35.6 | 38.0 | 38.9 | 36.8 | 41.0 | 39.9Table 1 Note ‡ | 38.5 | 41.4 | 40.1Table 1 Note †† | 38.9 | 41.3 |
| Men | 40.7 | 38.9 | 42.5 | 43.8 | 40.6 | 47.1 | 44.9Table 1 Note ‡ | 42.7 | 47.0 | 43.8Table 1 Note ‡ | 42.1 | 45.6 |
| Women | 33.4 | 31.8 | 35.0 | 34.6 | 32.0 | 37.2 | 35.6 | 33.7 | 37.6 | 36.9Table 1 Note ‡ | 35.3 | 38.5 |
| Total physical activity (minutes per day) | ||||||||||||
| Both sexes | 26.4 | 25.3 | 27.5 | 26.2 | 24.6 | 27.7 | 30.2Table 1 Note †† | 28.8 | 31.5 | 31.1Table 1 Note †† | 30.0 | 32.1 |
| Men | 30.7 | 28.8 | 32.5 | 30.3 | 27.9 | 32.7 | 35.2Table 1 Note ‡ | 33.0 | 37.4 | 35.2Table 1 Note †† | 33.6 | 36.9 |
| Women | 22.7 | 21.5 | 24.0 | 22.6 | 20.7 | 24.5 | 25.8Table 1 Note ‡ | 24.1 | 27.4 | 27.5Table 1 Note †† | 26.0 | 28.9 |
| Recreational physical activity (minutes per day) | ||||||||||||
| Both sexes | 9.0 | 8.4 | 9.6 | 8.2 | 7.4 | 9.0 | 9.2 | 8.5 | 9.8 | 11.1Table 1 Note †† | 10.5 | 11.7 |
| Men | 11.0 | 9.9 | 12.1 | 10.0 | 8.7 | 11.3 | 11.1 | 10.0 | 12.3 | 13.0Table 1 Note ‡ | 12.0 | 14.0 |
| Women | 7.3 | 6.7 | 7.8 | 6.6 | 5.5 | 7.6 | 7.4 | 6.7 | 8.2 | 9.5Table 1 Note †† | 8.7 | 10.2 |
| Active transportation (minutes per day) | ||||||||||||
| Both sexes | 9.3 | 8.7 | 9.9 | 11.7Table 1 Note †† | 10.7 | 12.6 | 11.1Table 1 Note †† | 10.3 | 11.9 | 10.0 | 9.4 | 10.5 |
| Men | 10.0 | 9.1 | 10.9 | 13.0Table 1 Note †† | 11.5 | 14.5 | 12.1Table 1 Note ‡ | 10.8 | 13.4 | 10.7 | 9.8 | 11.5 |
| Women | 8.7 | 8.0 | 9.4 | 10.5Table 1 Note ‡ | 9.3 | 11.7 | 10.3Table 1 Note ‡ | 9.3 | 11.3 | 9.4 | 8.6 | 10.1 |
| Occupational/household physical activity (minutes per day) | ||||||||||||
| Both sexes | 8.4 | 7.8 | 8.9 | 6.5Table 1 Note †† | 5.7 | 7.3 | 10.1Table 1 Note †† | 9.4 | 10.8 | 10.2 | 9.6 | 10.8 |
| Men | 9.9 | 9.1 | 10.8 | 7.4Table 1 Note †† | 6.3 | 8.6 | 12.2Table 1 Note ‡ | 11.0 | 13.4 | 11.8 | 10.9 | 12.7 |
| Women | 7.0 | 6.2 | 7.8 | 5.7 | 4.7 | 6.7 | 8.2Table 1 Note ‡ | 7.4 | 9.1 | 8.8 | 8.0 | 9.6 |
|
||||||||||||
Physical activity and screen time questions
CCHS respondents were asked to provide estimates of time spent in the past seven days engaged in transportation, as well as recreational and occupational or household physical activity. Values greater than two hours per day of any domain were flagged as outliers and recoded to two hours. Adults were classified as meeting the physical activity recommendation if their weekly sum of moderate-to-vigorous physical activity (including all domains of physical activity) was equal to or greater than 150 minutes.Note 12, Note 13 Respondents were asked to estimate their average daily screen time (two hours or less per day, more than two to less than four hours per day, four to less than six hours per day, six to less than eight hours per day, and eight hours or more per day) for days that they worked and days they did not work. Screen time categories were recoded to two hours or less per day, more than two to less than four hours per day, and four hours or more per day. None of the screen time categories align with the screen time recommendation in the Canadian 24-Hour Movement Guidelines for Adults (three hours or less per day); therefore, adherence to this benchmark was not assessed in the present analysis.
Statistical analysis
Descriptive statistics were used to produce means of minutes of physical activity and weighted percentages of the proportion meeting the physical activity recommendation (150 minutes per week of moderate-to-vigorous physical activity) in the Canadian 24-Hour Movement Guidelines. Variance of the estimates was examined using 95% confidence intervals with bootstrap weights applied. Survey weights were applied to the data to address non-response bias and to ensure the results are representative of the Canadian population. Analyses were conducted using SAS (Version 9.4), and differences between the three periods were tested using contrast statements within the PROC DESCRIPT procedure in SAS-callable SUDAAN (Version 11.0.3).
Results
The percentage of 18- to 64-year-old women meeting the physical activity recommendation did not change appreciably across all time points: 2018 (54.3%), 2020 before the pandemic (52.9%), 2020 during the pandemic (54.9%) and 2021 (55.1%) (Table 1). The percentage of 18- to 64-year-old men meeting the recommendation remained stable from 2018 (63.0%) to pre-pandemic 2020 (60.2%), after which it decreased in the fall of 2020 (59.2%) and in 2021 (59.8%).
When examined overall, total physical activity did not change appreciably from 2018 (41.2 minutes per day) to 2021 (41.5 minutes per day) (Table 1). While total physical activity decreased by 17.5 minutes per week among 18- to 64-year-old men, total physical activity increased by 8.4 minutes per week among 18- to 64-year-old women. Men and women aged 65 and older increased their total physical activity by about 30 minutes per week from 2018 to 2021. Regardless of age group and sex, recreational physical activity increased from 2018 to 2021 (on average, 11.2 minutes per week). Among younger adults, active transportation did not change from 2018 to 2020; however, it was slightly lower in 2021 compared with 2018 (by 10.5 minutes per week). Among older adults, active transportation increased from 2018 to 2020 and then decreased in 2021 to a level consistent with 2018. Household and occupational physical activity remained stable from 2018 to 2021 among younger adults but increased among older adults (by 12.6 minutes per week).
When examined by collection period, the pattern of how total physical activity varies across the seasons was similar in 2018 and in 2021, with the highest percentage meeting the physical activity recommendation observed during the summer months and the lowest observed for January to February or March for both years (Figure 1). Total physical activity was similar in the summer of 2021 (Gamma wave) compared with the summer of 2018, except for older women, whose physical activity was higher in the summer of 2021 (34.1 minutes per day, on average) compared with the summer of 2018 (26.4 minutes per day, on average) (Figure 2). Total physical activity was higher in the fall of 2020 and the fall of 2021 (Delta wave) compared with the fall of 2018. The most recent data available show that total physical activity in the winter months was higher in late 2021 to early 2022 (Omicron wave) compared with the winter collection period (January to March) of 2018.
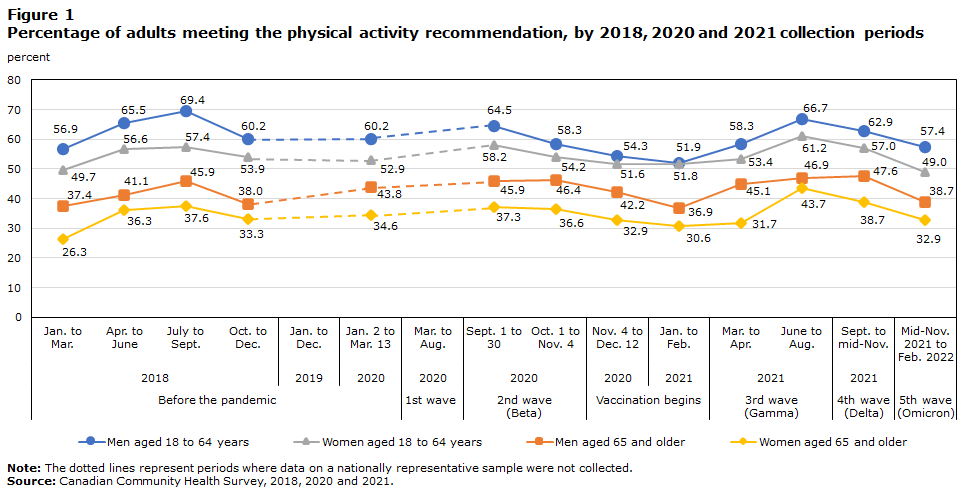
Description of Figure 1
| Adults aged 18 to 64 | Adults aged 65 and older | |||
|---|---|---|---|---|
| Men | Women | Men | Women | |
| percent | ||||
| Before the pandemic | ||||
| 2018 | ||||
| Jan. to Mar. | 56.9 | 49.7 | 37.4 | 26.3 |
| Apr. to June | 65.5 | 56.6 | 41.1 | 36.3 |
| July to Sept. | 69.4 | 57.4 | 45.9 | 37.6 |
| Oct. to Dec. | 60.2 | 53.9 | 38.0 | 33.3 |
| 2019 | ||||
| Jan. to Dec. | Note ...: not applicable | Note ...: not applicable | Note ...: not applicable | Note ...: not applicable |
| 2020 | ||||
| Jan. 2 to Mar. 13 | 60.2 | 52.9 | 43.8 | 34.6 |
| 1st wave | ||||
| 2020 | ||||
| Mar. to Aug. | Note ...: not applicable | Note ...: not applicable | Note ...: not applicable | Note ...: not applicable |
| 2nd wave (Beta) | ||||
| Sept. 1 to 30 | 64.5 | 58.2 | 45.9 | 37.3 |
| Oct. 1 to Nov. 4 | 58.3 | 54.2 | 46.4 | 36.6 |
| Vaccination begins | ||||
| Nov. 4 to Dec. 12 | 54.3 | 51.6 | 42.2 | 32.9 |
| 2021 | ||||
| Jan. to Feb. | 51.9 | 51.8 | 36.9 | 30.6 |
| 3rd wave (Gamma) | ||||
| Mar. to Apr. | 58.3 | 53.4 | 45.1 | 31.7 |
| June to Aug. | 66.7 | 61.2 | 46.9 | 43.7 |
| 4th wave (Delta) | ||||
| Sept. to mid-Nov. | 62.9 | 57.0 | 47.6 | 38.7 |
| 5th wave (Omicron) | ||||
| Mid-Nov. 2021 to Feb. 2022 | 57.4 | 49.0 | 38.7 | 32.9 |
|
... not applicable Note: The dotted lines represent periods where data on a nationally representative sample were not collected. Source: Canadian Community Health Survey, 2018, 2020 and 2021. |
||||

Description of Figure 2
| Adults aged 18 to 64 | Adults aged 65 and older | |||
|---|---|---|---|---|
| Men | Women | Men | Women | |
| average daily minutes of physical activity | ||||
| Before the pandemic | ||||
| 2018 | ||||
| Jan. to Mar. | 44.4 | 32.2 | 24.8 | 17.2 |
| Apr. to June | 54.9 | 40.5 | 31.8 | 25.5 |
| July to Sept. | 60.8 | 44.3 | 38.3 | 26.4 |
| Oct. to Dec. | 47.6 | 37.1 | 27.3 | 21.6 |
| 2019 | ||||
| Jan. to Dec. | Note ...: not applicable | Note ...: not applicable | Note ...: not applicable | Note ...: not applicable |
| 2020 | ||||
| Jan. to Mar. | 47.6 | 35.6 | 30.3 | 22.6 |
| 1st and 2nd waves | ||||
| 2020 | ||||
| Apr. to June | Note ...: not applicable | Note ...: not applicable | Note ...: not applicable | Note ...: not applicable |
| Sept. 1 to 30 | 55.7 | 42.7 | 38.9 | 28.1 |
| Oct. 1 to Nov. 4 | 49.5 | 37.9 | 36.9 | 26.5 |
| Vaccination begins | ||||
| Nov. 5 to Dec. 12 | 43.8 | 33.7 | 29.2 | 22.5 |
| 2021 | ||||
| Jan. to Feb. | 40.9 | 33.3 | 28.3 | 22.4 |
| 3rd wave (Gamma) | ||||
| Mar. to Apr. | 46.3 | 39.7 | 35.0 | 24.1 |
| June to Aug. | 57.4 | 45.7 | 39.8 | 34.1 |
| 4th wave (Delta) | ||||
| Sept. to mid-Nov. | 53.0 | 41.7 | 40.4 | 27.5 |
| 5th wave (Omicron) | ||||
| Mid-Nov. 2021 to Feb. 2022 | 47.2 | 35.1 | 27.1 | 22.9 |
|
... not applicable Note: The dotted lines represent periods where data on a nationally representative sample were not collected. Source: Canadian Community Health Survey, 2018, 2020 and 2021. |
||||
The annual variation in recreational physical activity is depicted in Figure 3 and indicates levels are higher in the spring and summer compared with the fall and winter. Levels of recreational physical activity were high in September 2020 but dropped in the winter months to levels similar to the winter of 2018. The pattern of recreational physical activity in 2021 is similar to that of 2018, and the latest estimates from winter 2021/2022 (Omicron wave) are similar to the winter estimates of 2018. Active transportation was lowest in the winter months, regardless of the year (Figure 4). Occupational and household activity tended to be relatively stable across the seasons, with a slight increase in the summer months (Figure 5). The summer increase was more pronounced among 18- to 64-year-old men compared with women and older adults.

Description of Figure 3
| Adults aged 18 to 64 | Adults aged 65 and older | |||
|---|---|---|---|---|
| Men | Women | Men | Women | |
| average daily minutes of physical activity | ||||
| Before the pandemic | ||||
| 2018 | ||||
| Jan. to Mar. | 16.2 | 12.6 | 9.4 | 5.2 |
| Apr. to June | 17.6 | 14.0 | 10.4 | 7.4 |
| July to Sept. | 17.8 | 14.8 | 13.3 | 9.2 |
| Oct. to Dec. | 15.3 | 11.8 | 10.8 | 7.1 |
| 2019 | ||||
| Jan. to Dec. | Note ...: not applicable | Note ...: not applicable | Note ...: not applicable | Note ...: not applicable |
| 2020 | ||||
| Jan. to Mar. | 16.4 | 13.5 | 10.0 | 6.6 |
| 1st and 2nd waves | ||||
| 2020 | ||||
| Apr. to June | Note ...: not applicable | Note ...: not applicable | Note ...: not applicable | Note ...: not applicable |
| Sept. 1 to 30 | 20.3 | 16.4 | 11.5 | 7.7 |
| Oct. 1 to Nov. 4 | 16.0 | 13.7 | 11.1 | 8.1 |
| Vaccination begins | ||||
| Nov. 5 to Dec. 12 | 12.9 | 12.8 | 10.7 | 6.5 |
| 2021 | ||||
| Jan. to Feb. | 14.7 | 15.8 | 14.3 | 9.8 |
| 3rd wave (Gamma) | ||||
| Mar. to Apr. | 18.5 | 16.1 | 14.5 | 9.2 |
| June to Aug. | 19.9 | 16.0 | 12.4 | 11.0 |
| 4th wave (Delta) | ||||
| Sept. to mid-Nov. | 17.1 | 15.2 | 14.5 | 8.8 |
| 5th wave (Omicron) | ||||
| Mid-Nov. 2021 to Feb. 2022 | 17.3 | 13.6 | 9.5 | 7.4 |
|
... not applicable Note: The dotted lines represent periods where data on a nationally representative sample were not collected. Source: Canadian Community Health Survey, 2018, 2020 and 2021. |
||||

Description of Figure 4
| Adults aged 18 to 64 | Adults aged 65 and older | |||
|---|---|---|---|---|
| Men | Women | Men | Women | |
| average daily minutes of physical activity | ||||
| Before the pandemic | ||||
| 2018 | ||||
| Jan. to Mar. | 12.4 | 9.5 | 8.6 | 6.8 |
| Apr. to June | 17.3 | 13.7 | 11.9 | 10.9 |
| July to Sept. | 16.5 | 12.6 | 11.2 | 8.3 |
| Oct. to Dec. | 12.7 | 12.4 | 8.1 | 8.9 |
| 2019 | ||||
| Jan. to Dec. | Note ...: not applicable | Note ...: not applicable | Note ...: not applicable | Note ...: not applicable |
| 2020 | ||||
| Jan. to Mar. | 14.9 | 11.4 | 13.0 | 10.5 |
| 1st and 2nd waves | ||||
| 2020 | ||||
| Apr. to June | Note ...: not applicable | Note ...: not applicable | Note ...: not applicable | Note ...: not applicable |
| Sept. 1 to 30 | 15.4 | 12.8 | 13.8 | 10.8 |
| Oct. 1 to Nov. 4 | 13.6 | 10.9 | 12.4 | 10.5 |
| Vaccination begins | ||||
| Nov. 5 to Dec. 12 | 13.2 | 10.4 | 9.8 | 9.6 |
| 2021 | ||||
| Jan. to Feb. | 9.6 | 7.8 | 6.7 | 6.9 |
| 3rd wave (Gamma) | ||||
| Mar. to Apr. | 10.7 | 9.8 | 9.1 | 7.9 |
| June to Aug. | 14.8 | 13.5 | 12.7 | 11.3 |
| 4th wave (Delta) | ||||
| Sept. to mid-Nov. | 15.5 | 12.8 | 12.8 | 9.9 |
| 5th wave (Omicron) | ||||
| Mid-Nov. 2021 to Feb. 2022 | 12.9 | 10.4 | 9.4 | 8.9 |
|
... not applicable Note: The dotted lines represent periods where data on a nationally representative sample were not collected. Source: Canadian Community Health Survey, 2018, 2020 and 2021. |
||||

Description of Figure 5
| Adults aged 18 to 64 | Adults aged 65 and older | |||
|---|---|---|---|---|
| Men | Women | Men | Women | |
| average daily minutes of physical activity | ||||
| Before the pandemic | ||||
| 2018 | ||||
| Jan. to Mar. | 16.3 | 9.6 | 7.2 | 5.3 |
| Apr. to June | 20.4 | 12.3 | 9.6 | 7.5 |
| July to Sept. | 26.8 | 15.9 | 14.1 | 9.3 |
| Oct. to Dec. | 19.8 | 12.0 | 8.6 | 5.8 |
| 2019 | ||||
| Jan. to Dec. | Note ...: not applicable | Note ...: not applicable | Note ...: not applicable | Note ...: not applicable |
| 2020 | ||||
| Jan. to Mar. | 16.5 | 10.6 | 7.4 | 5.7 |
| 1st and 2nd waves | ||||
| 2020 | ||||
| Apr. to June | Note ...: not applicable | Note ...: not applicable | Note ...: not applicable | Note ...: not applicable |
| Sept. 1 to 30 | 20.4 | 13.2 | 13.9 | 9.9 |
| Oct. 1 to Nov. 4 | 20.1 | 13.3 | 13.7 | 8.3 |
| Vaccination begins | ||||
| Nov. 5 to Dec. 12 | 17.9 | 10.4 | 8.9 | 6.4 |
| 2021 | ||||
| Jan. to Feb. | 16.7 | 9.4 | 7.3 | 5.8 |
| 3rd wave (Gamma) | ||||
| Mar. to Apr. | 17.4 | 13.2 | 11.6 | 7.0 |
| June to Aug. | 22.8 | 15.7 | 15.0 | 12.1 |
| 4th wave (Delta) | ||||
| Sept. to mid-Nov. | 20.8 | 12.9 | 13.4 | 9.0 |
| 5th wave (Omicron) | ||||
| Mid-Nov. 2021 to Feb. 2022 | 17.2 | 11.0 | 8.3 | 6.8 |
|
... not applicable Note: The dotted lines represent periods where data on a nationally representative sample were not collected. Source: Canadian Community Health Survey, 2018, 2020 and 2021. |
||||
Overall, there was a shift from 2018 to 2021 from the lowest screen time category (two hours or less per day) to the middle (more than two to less than four hours per day) or highest (four hours or more per day) screen time categories on both work days and non-work days. Among 18- to 64-year-old men and women and men aged 65 and older, the drop in the percentage within the lowest screen time category shifted to the middle and upper categories for work days; however, for non-work days, the shift was almost completely from the lowest to the highest screen time category (Table 2, Figure 6). Among women aged 65 and older, the decrease in the lowest screen time category observed from 2018 to 2021 shifted almost completely to the highest category on both work and non-work days (Table 2, Figure 6b).
| 2018 | 2021 | Difference between 2021 and 2018 (percentage points) |
|||||
|---|---|---|---|---|---|---|---|
| Before the pandemic | During the pandemic | ||||||
| % | 95% confidence interval | % | 95% confidence interval |
||||
| from | to | from | to | ||||
| Adults aged 18 to 64 years | |||||||
| Work days | |||||||
| Both sexes | |||||||
| Two hours or less per day | 53.9 | 52.9 | 55.0 | 45.0Table 2 Note †† | 43.9 | 46.2 | -8.9 |
| More than two to less than four hours per day | 31.0 | 30.0 | 32.0 | 35.0Table 2 Note †† | 33.9 | 36.2 | 4.0 |
| Four hours or more per day | 15.1 | 14.3 | 15.9 | 20.0Table 2 Note †† | 19.0 | 20.9 | 4.9 |
| Men | |||||||
| Two hours or less per day | 50.7 | 49.3 | 52.1 | 42.9Table 2 Note †† | 41.3 | 44.6 | -7.8 |
| More than two to less than four hours per day | 32.7 | 31.4 | 34.1 | 35.7Table 2 Note ‡ | 34.1 | 37.3 | 2.9 |
| Four hours or more per day | 16.5 | 15.5 | 17.7 | 21.4Table 2 Note †† | 20.0 | 22.9 | 4.8 |
| Women | |||||||
| Two hours or less per day | 57.6 | 56.2 | 59.0 | 47.3Table 2 Note †† | 45.7 | 49.0 | -10.3 |
| More than two to less than four hours per day | 29.0 | 27.8 | 30.3 | 34.3Table 2 Note †† | 32.8 | 35.9 | 5.3 |
| Four hours or more per day | 13.4 | 12.5 | 14.4 | 18.4Table 2 Note †† | 17.1 | 19.7 | 5.0 |
| Non-work days | |||||||
| Both sexes | |||||||
| Two hours or less per day | 37.8 | 36.9 | 38.7 | 28.0Table 2 Note †† | 27.1 | 29.0 | -9.8 |
| More than two to less than four hours per day | 34.9 | 34.1 | 35.8 | 34.9 | 34.0 | 35.9 | 0.0 |
| Four hours or more per day | 27.3 | 26.5 | 28.1 | 37.0Table 2 Note †† | 36.0 | 38.1 | 9.8 |
| Men | |||||||
| Two hours or less per day | 35.5 | 34.2 | 36.7 | 26.2Table 2 Note †† | 24.9 | 27.6 | -9.3 |
| More than two to less than four hours per day | 34.5 | 33.3 | 35.8 | 33.3 | 31.9 | 34.8 | -1.2 |
| Four hours or more per day | 30.0 | 28.9 | 31.1 | 40.5Table 2 Note †† | 39.0 | 42.1 | 10.5 |
| Women | |||||||
| Two hours or less per day | 40.1 | 38.9 | 41.4 | 29.8Table 2 Note †† | 28.5 | 31.2 | -10.3 |
| More than two to less than four hours per day | 35.3 | 34.1 | 36.5 | 36.6 | 35.2 | 37.9 | 1.3 |
| Four hours or more per day | 24.6 | 23.6 | 25.6 | 33.6Table 2 Note †† | 32.3 | 34.9 | 9.0 |
| Work days | |||||||
| Both sexes | |||||||
| Two hours or less per day | 49.4 | 45.9 | 52.9 | 37.8Table 2 Note †† | 34.5 | 41.2 | -11.6 |
| More than two to less than four hours per day | 36.0 | 32.8 | 39.3 | 40.2 | 37.1 | 43.5 | 4.2 |
| Four hours or more per day | 14.5 | 12.6 | 16.7 | 21.9Table 2 Note †† | 19.4 | 24.8 | 7.4 |
| Men | |||||||
| Two hours or less per day | 49.0 | 44.5 | 53.6 | 37.8Table 2 Note †† | 33.5 | 42.2 | -11.2 |
| More than two to less than four hours per day | 35.7 | 31.4 | 40.2 | 42.5Table 2 Note ‡ | 38.3 | 46.9 | 6.8 |
| Four hours or more per day | 15.3 | 12.8 | 18.1 | 19.7Table 2 Note ‡ | 16.5 | 23.3 | 4.4 |
| Women | |||||||
| Two hours or less per day | 50.1 | 44.2 | 55.9 | 37.9Table 2 Note ‡ | 33.1 | 42.9 | -12.2 |
| More than two to less than four hours per day | 36.5 | 31.5 | 41.9 | 37.1 | 32.5 | 42.0 | 0.6 |
| Four hours or more per day | 13.4 | 10.4 | 17.2 | 25.0Table 2 Note †† | 20.8 | 29.8 | 11.6 |
| Non-work days | |||||||
| Both sexes | |||||||
| Two hours or less per day | 29.4 | 28.2 | 30.6 | 21.5Table 2 Note †† | 20.5 | 22.6 | -7.9 |
| More than two to less than four hours per day | 38.0 | 36.8 | 39.2 | 36.8 | 35.6 | 37.9 | -1.2 |
| Four hours or more per day | 32.6 | 31.5 | 33.8 | 41.7Table 2 Note †† | 40.5 | 43.0 | 9.1 |
| Men | |||||||
| Two hours or less per day | 27.3 | 25.7 | 29.0 | 21.1Table 2 Note †† | 19.6 | 22.7 | -6.2 |
| More than two to less than four hours per day | 39.1 | 37.2 | 40.9 | 38.3 | 36.6 | 40.0 | -0.8 |
| Four hours or more per day | 33.7 | 31.9 | 35.4 | 40.6Table 2 Note †† | 38.8 | 42.5 | 7.0 |
| Women | |||||||
| Two hours or less per day | 31.2 | 29.6 | 32.9 | 21.9Table 2 Note †† | 20.5 | 23.4 | -9.3 |
| More than two to less than four hours per day | 37.0 | 35.4 | 38.7 | 35.4 | 33.9 | 37.0 | -1.6 |
| Four hours or more per day | 31.8 | 30.2 | 33.4 | 42.7Table 2 Note †† | 41.0 | 44.4 | 10.9 |
|
|||||||

Description of Figure 6
| Two hours or less per day | More than two to less than four hours per day | Four hours or more per day | |
|---|---|---|---|
| percent | |||
| 18 to 64 years | |||
| Men | |||
| Work days | |||
| 2018 | 50.7 | 32.7 | 16.5 |
| 2021 | 42.9 | 35.7 | 21.4 |
| Non-work days | |||
| 2018 | 35.5 | 34.5 | 30.0 |
| 2021 | 26.2 | 33.3 | 40.5 |
| Women | |||
| Work days | |||
| 2018 | 57.6 | 29.0 | 13.4 |
| 2021 | 47.3 | 34.3 | 18.4 |
| Non-work days | |||
| 2018 | 40.1 | 35.3 | 24.6 |
| 2021 | 29.8 | 36.6 | 33.6 |
| 65 years and older | |||
| Men | |||
| Work days | |||
| 2018 | 49.0 | 35.7 | 15.3 |
| 2021 | 37.8 | 42.5 | 19.7 |
| Non-work days | |||
| 2018 | 27.3 | 39.1 | 33.7 |
| 2021 | 21.1 | 38.3 | 40.6 |
| Women | |||
| Work days | |||
| 2018 | 50.1 | 36.5 | 13.4 |
| 2021 | 37.9 | 37.1 | 25.0 |
| Non-work days | |||
| 2018 | 31.2 | 37.0 | 31.8 |
| 2021 | 21.9 | 35.4 | 42.7 |
| Source: Canadian Community Health Survey, 2018, 2020 and 2021. | |||
Discussion
The present study leverages high-quality and large-scale population surveillance data from the CCHS to provide information about how the pandemic affected the physical activity and screen time habits of Canadian adults and older adults. Overall, the analysis indicates that Canadian adults maintained their physical activity and older adults increased their physical activity by about 30 minutes per week. Adults of all ages increased their screen time during the 2020 and 2021 pandemic years, with many shifting from the lowest category of screen usage (two hours or less per day) to the highest category (four hours or more per day). These findings provide a longer follow-up to a previous study reporting on physical activity in the fall of 2018 and the fall of 2020.2 The relative stability in physical activity among Canadian adults contrasts with the marked decrease observed during the 2020 and 2021 pandemic years among Canadian youth.Note 2, Note 10
The findings of this study and that conducted among youth suggest that adults may have been better able to adapt their physical activity routines despite pandemic restrictions. A large proportion of youth physical activity is accumulated at school, in organized sports and in active transportation—three domains that were restricted at various stages of the pandemic. Adult participants in a small study based in Calgary reported that despite challenges in modifying their daily routines and incorporating physical activity, many adapted and even experienced increased feelings of well-being.Note 14 Many adults engage in home-based exercise, and this was not affected during the pandemic. In fact, an increase in discretionary free time because of lockdown measures and remote working arrangements may have contributed to newfound time availability to engage in home-based exercise for some. Data from the Retail Commodity Survey suggest there was increased spending on home exercise equipment in the fall of 2020 compared with the fall of 2018,Note 3 and results from the CPSS indicate that women reported increased spending on home exercise equipment during the 2020 and 2021 pandemic years.Note 15 Further, the availability of home exercise equipment was a key predictor of exercise during the 2020 and 2021 pandemic years among Canadian adults.Note 16
Active transportation decreased among 18- to 64-year-olds possibly because of remote work arrangements. A slight increase in active transportation was observed among older adults and may have been the result of an increased desire to spend time outdoors. During the pandemic, public health authorities recommended outdoor exercise;Note 17 however, physical distancing rules may have made it difficult to adhere to this advice for those living in dense urban settings. A question remaining beyond this analysis is whether urban or rural status and access to safe outdoor walking spaces were associated with increased active transportation during the 2020 and 2021 pandemic years. A qualitative study conducted in 2020 found three key factors to help support physical activity during a pandemic: adaptations in use of outdoor space, importance of connectivity and destinations, and navigating interactions with people outdoors.Note 18 Parks and pathways were noted as especially important to support outdoor physical activity. Continued investment in infrastructure that promotes both outdoor exercise and active transportation may be useful to preserve and promote physical activity in future pandemics.
An important limitation of the screen time data collected during the 2020 and 2021 pandemic years in the CCHS is the lack of detail about the type of screen time. Presumably, much of the increase in screen time observed from 2018 to the 2020 and 2021 pandemic years is because of a shift to remote work, homeschooling, and physical distancing. A key question as Canadians move beyond the pandemic is whether this shift in the distribution of adults from the lowest screen time category to the highest will persist or whether the distribution will return to pre-pandemic levels. Another limitation of the screen time data collected in this study is that the response categories do not allow for direct assessment of adherence to the screen time recommendation (3 hours or less per day of recreational screen time) in the Canadian 24-Hour Movement Guidelines. Among adults aged 65 and older, a beneficial increase in physical activity was observed alongside a deleterious increase in screen time. This finding is important as previous research has shown that meeting more recommendations in the Canadian 24-Hour Movement Guidelines (i.e., meeting the physical activity recommendation and the screen time recommendation) is associated with a reduced risk of mortality and improved health.Note 19, Note 20
It is worth highlighting that the increase in physical activity seen among adults aged 65 and older in the current study (30 minutes per week, or roughly 17% higher than the baseline) is likely to be clinically meaningful. An increase of this size in a public health intervention would be viewed favourably. Further investigation of the reasons for this increase among adults aged 65 and older, as well as ways to sustain and build upon it, are warranted. While the present study provides a high-level overview of how physical activity and screen time changed from 2018 to early 2022, questions remain about how these trends varied across Canada and among various sociodemographic groups. This disaggregation will be important given that public health restrictions varied considerably across Canada, and various subpopulations were disproportionately affected by the pandemic. For example, among adults, self-reported moderate-to-vigorous physical activity from March to May 2020 was negatively associated with age and positively associated with income, education, employment, dog ownership, and access to home physical activity equipment and programming.16 Similar to their peers, Canadians with disabilities reported fewer opportunities for physical activity in the spring of 2020 because of school closures and the cancellation of sports.Note 21 This was exacerbated by a lack of in-person physiotherapy services and specialized home-based exercise equipment,Note 22 which further reduced opportunities for physical activity among some persons with disabilities.Note 21 The cancellation of disease-specific programs, such as cardiac and pulmonary rehabilitation, also greatly limited access for individuals with lung and heart disease, with more than 40% of Canadian cardiac rehabilitation programs cancelled and half of employees redeployed in the first two months of the pandemic.Note 23 It is unclear whether activity trajectories differed for the above groups compared with the general findings presented in this paper.
Ongoing surveillance of physical activity and screen time will be important as more data become available. More detailed analysis to better understand how these behaviours varied among various subpopulations and in different regions of Canada is important. Physical activity is positively associated with health; therefore, the apparent maintenance of this behaviour during the pandemic among younger adults and the substantive increase among older adults may be a silver lining in what has been a very challenging time for Canadians.
- Date modified: