
Health Reports
Validating the Children’s Intrinsic Needs Satisfaction Scale in the 2019 Canadian Health Survey on Children
and Youth
by Colin A. Capaldi and Laura L. Ooi

DOI: https://www.doi.org/10.25318/82-003-x202300800002-eng
Abstract
Background
The Public Health Agency of Canada monitors the psychological and social well-being of Canadian youth using the Children’s Intrinsic Needs Satisfaction Scale (CINSS). Validation analyses of the CINSS have been conducted, but not in the 2019 Canadian Health Survey on Children and Youth (CHSCY), a more recent and representative national survey with a different sampling frame, collection method and other measured outcomes. This study tested the validity of the CINSS in the 2019 CHSCY.
Data and methods
Data were collected in all provinces and territories from February 11 to August 2, 2019. The CINSS was administered to respondents aged 12 to 17 years and was designed to assess relatedness, autonomy and competence at home, at school and with friends. Descriptive statistics for CINSS items and subscales were obtained. Confirmatory factor analysis (CFA) was conducted to test how well a correlated traits correlated uniqueness (CTCU) model fit the CINSS data. Associations with mental health and other psychosocial variables were examined.
Results
In general, items within the CINSS were correlated in expected ways, and support was found for a CTCU model in the CFA. While response distributions on the CINSS items were skewed, the CINSS subscales had acceptable internal consistency and were associated with self-rated mental health, happiness, life satisfaction, perceived stress, bullying victimization and behaviour problems in line with expectations.
Interpretation
This study supports the validity of the CINSS. Inclusion of the CINSS in future youth health surveys would allow for continued public health surveillance of the psychological and social well-being of youth in Canada.
Keywords
youth, positive mental health, well-being, self-determination theory, competence, relatedness, autonomy
Authors
Colin A. Capaldi (colin.capaldi@phac-aspc.gc.ca) and Laura L. Ooi are with the Public Health Agency of Canada.
What is already known on this subject?
- The Children’s Intrinsic Needs Satisfaction Scale (CINSS) is used to assess the degree to which the relatedness, autonomy and competence needs of children and youth are satisfied.
- The psychometric properties of the CINSS have been documented previously with data from the 2014/2015 Canadian Student Tobacco, Alcohol and Drugs Survey.
- Validation of the CINSS in the 2019 Canadian Health Survey on Children and Youth (CHSCY) is needed, as the survey included a more representative sample of the Canadian youth population and different data collection methods than previous work.
What does this study add?
- Evidence supporting the factorial structure, convergent and divergent validity, and reliability of the CINSS was found using data from the 2019 CHSCY.
- The inclusion of the CINSS in future surveys of youth population health would allow for continued public health surveillance of the psychological and social well-being of youth in Canada.
Introduction
Adolescence represents a period of considerable physical, cognitive, social and emotional maturation.Note 1 Although this time of rapid development may be associated with increased vulnerability to mental health difficulties,Note 2 it also presents opportunities to acquire capabilities and establish patterns that can contribute to well-being (also referred to as “positive mental health”) across the lifespan.Note 3 As such, assessing well-being during adolescence is important to obtain a comprehensive understanding of youth mental health.Note 4 In addition, the surveillance of positive mental health among youth at the population level is critical to informing meaningful mental health promotion activities. In line with this, the Public Health Agency of Canada (PHAC) monitors the positive mental health of Canadian youth (aged 12 to 17 years) in the Positive Mental Health Surveillance Indicator Framework (PMHSIF).Note 5 For accurate surveillance and effective public health interventions, it is essential that developmentally appropriate and valid measures of positive mental health are used.
The Children’s Intrinsic Needs Satisfaction Scale (CINSS)Note 6 measures two aspects of positive mental health among youth in Canada in the PMHSIF: psychological well-being and social well-being.Note 5, Note 7 The CINSS was developed based on self-determination theory,Note 8, Note 9 which views innate psychological needs as “psychological nutrients that are essential for ongoing psychological growth, integrity, and well-being.”Note 8 Specifically, the CINSS was designed to measure the degree to which relatedness (i.e., the need to feel like one is cared about and connected to others), autonomy (i.e., the need to feel like one has volition and choice) and competence (i.e., the need to feel like one is efficacious) needs are satisfied in three different contexts: at home, at school and with friends.Note 6, Note 10
Validation analyses of the CINSS in a large sample of youth (i.e., students in grades 6 to 12) in Canada have been conducted previously using data from the 2014/2015 Canadian Student Tobacco, Alcohol and Drugs Survey (CSTADS).Note 11 Support was found for the factorial validity of the CINSS. Furthermore, the CINSS subscales had adequate internal consistency and were associated with other psychosocial variables in a theoretically and empirically expected manner (e.g., youth who reported being bullied, bullying others or having other behaviour problems had lower relatedness, autonomy and competence scores).Note 8, Note 9, Note 10, Note 12, Note 13, Note 14 Based on these results, the authors concluded that the “CINSS scale is a promising measure of positive mental health in children and youth for national surveillance purposes” in Canada.Note 11
The CINSS was more recently included in the 2019 Canadian Health Survey on Children and Youth (CHSCY).Note 15 However, there are notable differences in the populations sampled and mode of survey administration within the 2014/2015 CSTADS and the 2019 CHSCY. While the total number of youth who participated in the 2014/2015 CSTADS was greater than the 2019 CHSCY, a broader and more representative sample of Canadian youth was obtained in the 2019 CHSCY. For instance, the 2014/2015 CSTADS did not include youth living in the territories, but the 2019 CHSCY did. The survey frame for the 2019 CHSCY was based on the Canada Child Benefit, while the 2014/2015 CSTADS sampled public, Catholic and private schools with students in grades 6 to 12 (or grades 6 to secondary V in Quebec) in the 10 provinces. Moreover, the data collection methods differed, with youth completing the 2014/2015 CSTADS using a paper questionnaire in class at school versus youth completing the 2019 CHSCY using an electronic questionnaire or by being interviewed over the telephone. This is a noteworthy difference, as the mode of survey administration may impact responses. Paper-and-pencil methods have been found to lead to more socially desirable responses on highly sensitive topics (e.g., hard drug use) than computerized methods, though not for less sensitive topics.Note 16, Note 17 Given these differences, validation of the CINSS in the 2019 CHSCY is warranted.
Furthermore, in addition to including measures of bullying victimization and behaviour problems (as in the 2014/2015 CSTADS),Note 11 the 2019 CHSCY contained other established measures of positive mental health (i.e., self-rated mental health, happiness and life satisfaction)Note 5, Note 7 and ill-being (i.e., perceived stress)18 that the CINSS could be compared with. The inclusion of these measures in the 2019 CHSCY provides a novel opportunity to evaluate the validity of the CINSS, as one would expect the CINSS subscales to be positively associated with other indicators of adaptive functioning (e.g., positive mental health) and negatively associated with indicators of maladaptive functioning (e.g., stress).Note 8, Note 9, Note 10, Note 13
Accordingly, the purpose of the current study was to examine the psychometric properties of the CINSS in the 2019 CHSCY. Specific objectives included assessing (1) the factorial validity of the CINSS, (2) the convergent and divergent validity of the CINSS items and subscales, and (3) the internal consistency of the CINSS subscales. This could help guide decisions on whether (and how) the CINSS is analyzed for surveillance and research purposes using data from the 2019 CHSCY, and whether the CINSS is included in subsequent health surveys of youth in Canada.
Data and methods
Data
Data from the 2019 CHSCY, which were collected from February 11 to August 2, 2019, were used for this project.Note 15 The target population for the 2019 CHSCY was children and youth aged 1 to 17 years in every province and territory in Canada; the Canada Child Benefit was used to create the survey frame. The 2019 CHSCY excluded children and youth who were institutionalized, living in foster homes, or living on First Nations reserves or settlements. Of the children and youth aged 1 to 17 years in Canada, approximately 98% in the provinces and 96% in the territories were included in the survey frame. Only data from youth were used for this project because the CINSS was administered only to individuals aged 12 to 17 years (see Table 1 for sociodemographic characteristics). The overall response rate for youth aged 12 to 17 in the 2019 CHSCY was 41.3%, with 13,602 of the 32,951 in-scope youth responding. Data from the 11,077 youth who had data sharing agreements with PHAC were analyzed in this study. Around three-quarters (77.1%) of these youth respondents completed the 2019 CHSCY through an electronic questionnaire, and around one-quarter (22.9%) were interviewed over the telephone.
| Characteristics | % | 95% confidence interval |
|
|---|---|---|---|
| from | to | ||
| Sex | |||
| Male | 51.3 | 51.2 | 51.4 |
| Female | 48.7 | 48.6 | 48.8 |
| Age (years) | |||
| 12 | 18.2 | 17.3 | 19.1 |
| 13 | 16.6 | 15.7 | 17.6 |
| 14 | 16.3 | 15.3 | 17.2 |
| 15 | 17.3 | 16.3 | 18.3 |
| 16 | 16.7 | 15.7 | 17.6 |
| 17 | 14.9 | 14.0 | 15.8 |
| Racialized populationTable 1 Note 1 | |||
| No | 70.7 | 69.6 | 71.8 |
| Yes | 29.3 | 28.2 | 30.4 |
| Place of residence | |||
| Population centre | 81.8 | 80.9 | 82.7 |
| Rural area | 18.2 | 17.3 | 19.1 |
| Province or territory | |||
| Newfoundland and Labrador | 1.3 | 1.3 | 1.3 |
| Prince Edward Island | 0.4 | 0.4 | 0.4 |
| Nova Scotia | 2.4 | 2.4 | 2.4 |
| New Brunswick | 2.0 | 2.0 | 2.0 |
| Quebec | 21.1 | 21.1 | 21.1 |
| Ontario | 40.2 | 40.2 | 40.2 |
| Manitoba | 3.8 | 3.8 | 3.8 |
| Saskatchewan | 3.3 | 3.3 | 3.3 |
| Alberta | 12.5 | 12.5 | 12.5 |
| British Columbia | 12.6 | 12.6 | 12.6 |
| Yukon | 0.1 | 0.1 | 0.1 |
| Northwest Territories | 0.1 | 0.1 | 0.1 |
| Nunavut | 0.2 | 0.2 | 0.2 |
| median, dollars | from | to | |
| Household income | 94,891 | 91,430 | 98,352 |
Source: 2019 Canadian Health Survey on Children and Youth. |
|||
Measures
The CINSS asked respondents to indicate how well 18 statements described their feelings and ideas in the past week, with the following response options: “1: Really false for me,” “2: Sort of false for me,” “3: Sort of true for me” and “4: Really true for me.” Six of the statements constituted the relatedness subscale, six constituted the autonomy subscale and six constituted the competence subscale. Mean scores on each of the subscales can be calculated by averaging responses on the relevant six statements. Within each of the three subscales, two questions ask about home and parents, two ask about school and teachers, and two ask about friends (see Table 2 for the exact wording of all CINSS items).
| Item and variable name | Average response to item or subscale | Response options | |||||||||||||
|---|---|---|---|---|---|---|---|---|---|---|---|---|---|---|---|
| 1 | 2 | 3 | 4 | ||||||||||||
| Really false for me | Sort of false for me | Sort of true for me | Really true for me | ||||||||||||
| Mean | 95% confidence interval |
% | 95% confidence interval |
% | 95% confidence interval |
% | 95% confidence interval |
% | 95% confidence interval |
||||||
| from | to | from | to | from | to | from | to | from | to | ||||||
| Relatedness | |||||||||||||||
| My teachers like me and care about me - RS1 | 3.4 | 3.3 | 3.4 | 2.3 | 1.9 | 2.7 | 9.2 | 8.4 | 9.9 | 39.1 | 37.9 | 40.3 | 49.4 | 48.2 | 50.7 |
| I like to spend time with my parents - RH1 | 3.4 | 3.4 | 3.5 | 2.4 | 2.0 | 2.8 | 8.2 | 7.5 | 8.9 | 32.9 | 31.7 | 34.1 | 56.5 | 55.3 | 57.8 |
| My parents like me and care about me - RH2 | 3.9 | 3.8 | 3.9 | 0.6Table 2 Note C | 0.4 | 0.8 | 1.4 | 1.1 | 1.7 | 10.1 | 9.4 | 10.9 | 87.8 | 87.0 | 88.6 |
| I like to be with my teachers - RS2 | 2.8 | 2.8 | 2.9 | 8.9 | 8.2 | 9.7 | 23.2 | 22.2 | 24.3 | 43.5 | 42.2 | 44.8 | 24.3 | 23.2 | 25.4 |
| My friends like me and care about me - RP1 | 3.6 | 3.6 | 3.6 | 1.1 | 0.8 | 1.3 | 4.2 | 3.6 | 4.7 | 26.6 | 25.5 | 27.7 | 68.2 | 67.0 | 69.4 |
| I like to spend time with my friends - RP2 | 3.7 | 3.7 | 3.8 | 0.8 | 0.6 | 1.0 | 2.5 | 2.1 | 2.9 | 17.9 | 16.9 | 18.9 | 78.8 | 77.8 | 79.9 |
| Overall relatedness | 3.5 | 3.5 | 3.5 | Note ...: not applicable | Note ...: not applicable | Note ...: not applicable | Note ...: not applicable | Note ...: not applicable | Note ...: not applicable | Note ...: not applicable | Note ...: not applicable | Note ...: not applicable | Note ...: not applicable | Note ...: not applicable | Note ...: not applicable |
| Autonomy | |||||||||||||||
| I feel free to express myself at home - AH1 | 3.5 | 3.5 | 3.5 | 3.0 | 2.5 | 3.4 | 7.6 | 7.0 | 8.2 | 25.1 | 24.1 | 26.2 | 64.3 | 63.1 | 65.5 |
| I feel free to express myself with my friends - AP1 | 3.6 | 3.5 | 3.6 | 1.9 | 1.6 | 2.2 | 5.7 | 5.1 | 6.3 | 26.7 | 25.6 | 27.8 | 65.7 | 64.5 | 67.0 |
| I feel I have a choice about when and how to do my school work - AS1 | 3.3 | 3.3 | 3.3 | 4.6 | 4.1 | 5.1 | 11.4 | 10.6 | 12.2 | 32.5 | 31.4 | 33.7 | 51.4 | 50.2 | 52.7 |
| I feel I have a choice about which activities to do with my friends - AP2 | 3.5 | 3.5 | 3.5 | 1.7 | 1.4 | 2.0 | 6.1 | 5.5 | 6.6 | 32.4 | 31.2 | 33.6 | 59.8 | 58.6 | 61.1 |
| I feel free to express myself at school - AS2 | 3.1 | 3.1 | 3.2 | 6.0 | 5.5 | 6.6 | 14.5 | 13.7 | 15.4 | 39.1 | 37.9 | 40.3 | 40.3 | 39.1 | 41.5 |
| I feel like I have a choice about when and how to do my household chores - AH2 | 3.0 | 3.0 | 3.0 | 7.5 | 6.9 | 8.2 | 19.0 | 18.0 | 20.0 | 40.1 | 38.8 | 41.3 | 33.4 | 32.2 | 34.6 |
| Overall autonomy | 3.3 | 3.3 | 3.3 | Note ...: not applicable | Note ...: not applicable | Note ...: not applicable | Note ...: not applicable | Note ...: not applicable | Note ...: not applicable | Note ...: not applicable | Note ...: not applicable | Note ...: not applicable | Note ...: not applicable | Note ...: not applicable | Note ...: not applicable |
| Competence | |||||||||||||||
| I feel I do things well at school - CS1 | 3.3 | 3.3 | 3.3 | 2.5 | 2.1 | 2.9 | 9.2 | 8.5 | 9.9 | 42.8 | 41.5 | 44.0 | 45.6 | 44.3 | 46.8 |
| I feel my teachers think I am good at things - CS2 | 3.3 | 3.3 | 3.3 | 2.9 | 2.5 | 3.4 | 10.1 | 9.3 | 10.9 | 40.9 | 39.7 | 42.2 | 46.1 | 44.8 | 47.4 |
| I feel I do things well at home - CH1 | 3.3 | 3.3 | 3.3 | 2.3 | 1.9 | 2.7 | 9.5 | 8.7 | 10.2 | 41.3 | 40.0 | 42.6 | 46.9 | 45.6 | 48.2 |
| I feel my parents think that I am good at things - CH2 | 3.6 | 3.5 | 3.6 | 1.5 | 1.2 | 1.9 | 5.9 | 5.2 | 6.6 | 26.9 | 25.8 | 28.1 | 65.6 | 64.4 | 66.9 |
| I feel I do things well when I am with my friends - CP1 | 3.5 | 3.4 | 3.5 | 1.6 | 1.3 | 1.9 | 6.3 | 5.7 | 6.9 | 36.2 | 34.9 | 37.4 | 55.9 | 54.7 | 57.2 |
| I feel my friends think I am good at things - CP2 | 3.5 | 3.5 | 3.5 | 1.3 | 1.0 | 1.6 | 5.5 | 4.9 | 6.1 | 36.9 | 35.6 | 38.1 | 56.3 | 55.1 | 57.6 |
| Overall competence | 3.4 | 3.4 | 3.4 | Note ...: not applicable | Note ...: not applicable | Note ...: not applicable | Note ...: not applicable | Note ...: not applicable | Note ...: not applicable | Note ...: not applicable | Note ...: not applicable | Note ...: not applicable | Note ...: not applicable | Note ...: not applicable | Note ...: not applicable |
... not applicable
Source: 2019 Canadian Health Survey on Children and Youth. |
|||||||||||||||
Consistent with previous validation analyses of the CINSS,Note 11 associations with measures of bullying victimization and behaviour problems were examined in the current investigation. Specifically, 10 questions from the 2019 CHSCY asked about different types of bullying victimization (e.g., being made fun of, being threatened with harm, someone posting hurtful information on the Internet; see Table 3 for exact wording). Similar to the coding in previous validation analyses,Note 11 responses to the bullying variables were dichotomized into experiencing the bullying at least monthly (i.e., “Monthly,” “Weekly” or “Daily”) versus less often (i.e., “A few times a year” or “Never”). For behaviour problems, two questions were included that asked youth to self-report how frequently they lost their temper in the past 12 months and how frequently they yelled, swore or called their parents names in the past 12 months. Responses to these questions were dichotomized into the behaviour problem occurring at least sometimes (i.e., “Sometimes,” “Often” or “Most of the time”) versus less often (i.e., “Rarely” or “Never”).
| Prevalence | CINSS subscale | ||||||||||||||||||||
|---|---|---|---|---|---|---|---|---|---|---|---|---|---|---|---|---|---|---|---|---|---|
| Relatedness | Autonomy | Competence | |||||||||||||||||||
| % | 95% confidence interval |
Mean | 95% confidence interval |
Adjusted | Mean | 95% confidence interval |
Adjusted | Mean | 95% confidence interval | Adjusted | |||||||||||
| b | 95% confidence interval |
b | 95% confidence interval |
b | 95% confidence interval |
||||||||||||||||
| from | to | from | to | from | to | from | to | from | to | from | to | from | to | ||||||||
| Bullying victimization variables | |||||||||||||||||||||
| Someone made fun of you, called you names or insulted you |
|||||||||||||||||||||
| Monthly, weekly or daily | 22.1 | 21.1 | 23.1 | 3.3 | 3.3 | 3.3 | -0.23 | -0.25 | -0.20 | 3.1 | 3.1 | 3.1 | -0.31 | -0.34 | -0.27 | 3.2 | 3.2 | 3.2 | -0.28 | -0.32 | -0.25 |
| A few times a year or neverTable 3 Note † | 77.9 | 76.9 | 78.9 | 3.5 | 3.5 | 3.5 | Note ...: not applicable | Note ...: not applicable | Note ...: not applicable | 3.4 | 3.4 | 3.4 | Note ...: not applicable | Note ...: not applicable | Note ...: not applicable | 3.5 | 3.5 | 3.5 | Note ...: not applicable | Note ...: not applicable | Note ...: not applicable |
| Someone spread rumours about you | |||||||||||||||||||||
| Monthly, weekly or daily | 8.6 | 8.0 | 9.3 | 3.2 | 3.2 | 3.3 | -0.29 | -0.34 | -0.25 | 3.0 | 2.9 | 3.0 | -0.39 | -0.44 | -0.34 | 3.1 | 3.0 | 3.1 | -0.35 | -0.40 | -0.30 |
| A few times a year or neverTable 3 Note † | 91.4 | 90.7 | 92.0 | 3.5 | 3.5 | 3.5 | Note ...: not applicable | Note ...: not applicable | Note ...: not applicable | 3.4 | 3.4 | 3.4 | Note ...: not applicable | Note ...: not applicable | Note ...: not applicable | 3.4 | 3.4 | 3.5 | Note ...: not applicable | Note ...: not applicable | Note ...: not applicable |
| Someone threatened you with harm | |||||||||||||||||||||
| Monthly, weekly or daily | 4.6 | 4.1 | 5.1 | 3.1 | 3.0 | 3.2 | -0.39 | -0.45 | -0.32 | 2.9 | 2.8 | 3.0 | -0.48 | -0.55 | -0.40 | 3.0 | 2.9 | 3.0 | -0.46 | -0.53 | -0.39 |
| A few times a year or neverTable 3 Note † | 95.4 | 94.9 | 95.9 | 3.5 | 3.5 | 3.5 | Note ...: not applicable | Note ...: not applicable | Note ...: not applicable | 3.4 | 3.3 | 3.4 | Note ...: not applicable | Note ...: not applicable | Note ...: not applicable | 3.4 | 3.4 | 3.4 | Note ...: not applicable | Note ...: not applicable | Note ...: not applicable |
| Someone pushed you, shoved you, tripped you or spit on you |
|||||||||||||||||||||
| Monthly, weekly or daily | 6.4 | 5.8 | 7.0 | 3.2 | 3.2 | 3.3 | -0.29 | -0.34 | -0.24 | 3.0 | 3.0 | 3.1 | -0.36 | -0.42 | -0.29 | 3.1 | 3.1 | 3.2 | -0.34 | -0.40 | -0.28 |
| A few times a year or neverTable 3 Note † | 93.6 | 93.0 | 94.2 | 3.5 | 3.5 | 3.5 | Note ...: not applicable | Note ...: not applicable | Note ...: not applicable | 3.4 | 3.3 | 3.4 | Note ...: not applicable | Note ...: not applicable | Note ...: not applicable | 3.4 | 3.4 | 3.4 | Note ...: not applicable | Note ...: not applicable | Note ...: not applicable |
| Someone tried to make you do things you did not want to do |
|||||||||||||||||||||
| Monthly, weekly or daily | 4.7 | 4.2 | 5.1 | 3.1 | 3.1 | 3.2 | -0.35 | -0.40 | -0.29 | 2.9 | 2.8 | 3.0 | -0.46 | -0.52 | -0.39 | 3.1 | 3.0 | 3.1 | -0.37 | -0.43 | -0.31 |
| A few times a year or neverTable 3 Note † | 95.3 | 94.9 | 95.8 | 3.5 | 3.5 | 3.5 | Note ...: not applicable | Note ...: not applicable | Note ...: not applicable | 3.4 | 3.3 | 3.4 | Note ...: not applicable | Note ...: not applicable | Note ...: not applicable | 3.4 | 3.4 | 3.4 | Note ...: not applicable | Note ...: not applicable | Note ...: not applicable |
| Someone excluded you from activities on purpose |
|||||||||||||||||||||
| Monthly, weekly or daily | 9.8 | 9.1 | 10.5 | 3.2 | 3.1 | 3.2 | -0.35 | -0.39 | -0.31 | 2.9 | 2.9 | 3.0 | -0.47 | -0.52 | -0.42 | 3.1 | 3.0 | 3.1 | -0.39 | -0.44 | -0.34 |
| A few times a year or neverTable 3 Note † | 90.2 | 89.5 | 90.9 | 3.5 | 3.5 | 3.5 | Note ...: not applicable | Note ...: not applicable | Note ...: not applicable | 3.4 | 3.4 | 3.4 | Note ...: not applicable | Note ...: not applicable | Note ...: not applicable | 3.4 | 3.4 | 3.5 | Note ...: not applicable | Note ...: not applicable | Note ...: not applicable |
| Someone destroyed your property on purpose |
|||||||||||||||||||||
| Monthly, weekly or daily | 2.5 | 2.1 | 2.9 | 3.2 | 3.1 | 3.2 | -0.35 | -0.44 | -0.25 | 2.9 | 2.8 | 3.0 | -0.47 | -0.57 | -0.36 | 3.0 | 2.9 | 3.1 | -0.43 | -0.53 | -0.33 |
| A few times a year or neverTable 3 Note † | 97.5 | 97.1 | 97.9 | 3.5 | 3.5 | 3.5 | Note ...: not applicable | Note ...: not applicable | Note ...: not applicable | 3.3 | 3.3 | 3.4 | Note ...: not applicable | Note ...: not applicable | Note ...: not applicable | 3.4 | 3.4 | 3.4 | Note ...: not applicable | Note ...: not applicable | Note ...: not applicable |
| Someone posted hurtful information about you on the Internet |
|||||||||||||||||||||
| Monthly, weekly or daily | 1.8 | 1.4 | 2.1 | 3.1 | 3.0 | 3.2 | -0.38 | -0.49 | -0.26 | 2.8 | 2.7 | 3.0 | -0.49 | -0.62 | -0.37 | 2.9 | 2.8 | 3.1 | -0.48 | -0.60 | -0.35 |
| A few times a year or neverTable 3 Note † | 98.2 | 97.9 | 98.6 | 3.5 | 3.5 | 3.5 | Note ...: not applicable | Note ...: not applicable | Note ...: not applicable | 3.3 | 3.3 | 3.4 | Note ...: not applicable | Note ...: not applicable | Note ...: not applicable | 3.4 | 3.4 | 3.4 | Note ...: not applicable | Note ...: not applicable | Note ...: not applicable |
| Someone threatened or insulted you through email, instant messaging, text messaging or an online game |
|||||||||||||||||||||
| Monthly, weekly or daily | 4.7 | 4.2 | 5.2 | 3.2 | 3.1 | 3.3 | -0.26 | -0.33 | -0.20 | 3.0 | 2.9 | 3.1 | -0.36 | -0.43 | -0.29 | 3.1 | 3.0 | 3.1 | -0.35 | -0.42 | -0.27 |
| A few times a year or neverTable 3 Note † | 95.3 | 94.8 | 95.8 | 3.5 | 3.5 | 3.5 | Note ...: not applicable | Note ...: not applicable | Note ...: not applicable | 3.4 | 3.3 | 3.4 | Note ...: not applicable | Note ...: not applicable | Note ...: not applicable | 3.4 | 3.4 | 3.4 | Note ...: not applicable | Note ...: not applicable | Note ...: not applicable |
| Someone purposefully excluded you from an online community |
|||||||||||||||||||||
| Monthly, weekly or daily | 3.6 | 3.2 | 4.1 | 3.1 | 3.1 | 3.2 | -0.36 | -0.43 | -0.29 | 2.9 | 2.8 | 3.0 | -0.47 | -0.55 | -0.39 | 3.0 | 2.9 | 3.1 | -0.44 | -0.51 | -0.36 |
| A few times a year or neverTable 3 Note † | 96.4 | 95.9 | 96.8 | 3.5 | 3.5 | 3.5 | Note ...: not applicable | Note ...: not applicable | Note ...: not applicable | 3.4 | 3.3 | 3.4 | Note ...: not applicable | Note ...: not applicable | Note ...: not applicable | 3.4 | 3.4 | 3.4 | Note ...: not applicable | Note ...: not applicable | Note ...: not applicable |
| You lost your temper | |||||||||||||||||||||
| Sometimes, often or most of the time | 52.8 | 51.6 | 54.1 | 3.4 | 3.4 | 3.4 | -0.17 | -0.19 | -0.15 | 3.3 | 3.2 | 3.3 | -0.18 | -0.21 | -0.15 | 3.3 | 3.3 | 3.3 | -0.20 | -0.23 | -0.18 |
| Rarely or neverTable 3 Note † | 47.2 | 45.9 | 48.4 | 3.6 | 3.5 | 3.6 | Note ...: not applicable | Note ...: not applicable | Note ...: not applicable | 3.4 | 3.4 | 3.4 | Note ...: not applicable | Note ...: not applicable | Note ...: not applicable | 3.5 | 3.5 | 3.5 | Note ...: not applicable | Note ...: not applicable | Note ...: not applicable |
| You yelled at your parents, swore at them or called them names |
|||||||||||||||||||||
| Sometimes, often or most of the time | 18.3 | 17.4 | 19.3 | 3.3 | 3.2 | 3.3 | -0.24 | -0.27 | -0.21 | 3.1 | 3.1 | 3.2 | -0.25 | -0.28 | -0.21 | 3.2 | 3.1 | 3.2 | -0.28 | -0.31 | -0.24 |
| Rarely or neverTable 3 Note † | 81.7 | 80.7 | 82.6 | 3.5 | 3.5 | 3.5 | Note ...: not applicable | Note ...: not applicable | Note ...: not applicable | 3.4 | 3.4 | 3.4 | Note ...: not applicable | Note ...: not applicable | Note ...: not applicable | 3.5 | 3.4 | 3.5 | Note ...: not applicable | Note ...: not applicable | Note ...: not applicable |
|
... not applicable † reference category Notes: b = unstandardized regression coefficient. CINSS = Children’s Intrinsic Needs Satisfaction Scale. Adjusted analyses included sex, age, racialized population, place of residence and household income tertile as covariates. Analyses involving the CINSS excluded respondents with missing data on any of the CINSS items or covariates, with sample sizes ranging from 10,901 to 10,947 in those analyses because of missing data on the bullying victimization and behaviour problem variables. Results are weighted. The reported regression coefficients are all statistically significant (p < 0.001). Source: 2019 Canadian Health Survey on Children and Youth. |
|||||||||||||||||||||
Other measures of mental health were also analyzed to examine convergent validity. Self-rated mental health was measured by asking youth, “In general, how is your mental health?” Response options were “Excellent,” “Very good,” “Good,” “Fair” and “Poor.” In line with the PMHSIF,Note 5, Note 7 youth who responded “Excellent” or “Very good” were coded as having high self-rated mental health. Happiness was measured by asking youth, “How would you usually describe yourself?” Response options were “Happy and interested in life,” “Somewhat happy,” “Somewhat unhappy,” “Unhappy with little interest in life,” and “So unhappy that life is not worthwhile.” In line with the PMHSIF,Note 5, Note 7 youth who responded “Happy and interested in life” were coded as having a high level of happiness. Life satisfaction was measured by asking youth, “Using a scale of 0 to 10, where 0 means ‘very dissatisfied’ and 10 means ‘very satisfied,’ how do you feel about your life as a whole right now?” In line with one of the indicator measures of life satisfaction in the PMHSIF,Note 5, Note 7 it was treated as a numerical variable and not dichotomized. Finally, perceived stress was measured by asking youth, “Thinking about the amount of stress in your life, how would you describe most of your days?” Response options were “Not at all stressful,” “Not very stressful,” “A bit stressful,” “Quite a bit stressful” and “Extremely stressful.” In line with the Suicide Surveillance Indicator Framework,Note 18 youth who responded “Quite a bit stressful” or “Extremely stressful” were coded as having a high level of stress.
Analysis
A multitrait multimethod confirmatory factor analysis (CFA) was conducted to examine the factorial validity of the CINSS. This type of analysis is appropriate because the CINSS measures multiple “traits” or constructs (i.e., relatedness, autonomy and competence) using multiple “methods” or contexts (i.e., home, school and friends). A correlated traits correlated uniqueness (CTCU)Note 19 model was tested, which included three factors for the items that were designed to measure competence, relatedness or autonomy. Correlations between the competence, relatedness and autonomy factors were modelled (this is the “correlated traits” part of the CTCU model). Correlations were also modelled between residuals of CINSS items that asked about the same context (this is the “correlated uniqueness” part of the CTCU model). Support for this model has been reported in previous research.Note 11 Given the strong correlations between factors, a secondary CFA was also conducted to test a simpler model that replaced the relatedness, autonomy and competence factors with just one factor to represent basic psychological need satisfaction. Mplus Version 8.3 was used to conduct the CFA in the current project. Weights were used in the CFA for results to be representative of the target population. The cut-off criteria from Hu and BentlerNote 20 were used to determine whether the model fit was adequate.
In addition, descriptive statistics for each of the CINSS items and subscales were calculated, and correlations between CINSS items were examined. Bivariate (unadjusted) linear regression analyses were conducted to examine how the different bullying victimization experiences, behaviour problems and mental health variables were individually associated with each of the CINSS subscales. Multiple (adjusted) linear regression analyses were also conducted that statistically controlled for sex (male, female), age, racialized population (yes, no), place of residence (population centre, rural area) and household income tertile (low, middle, high). Correlations and regression coefficients with p-values < 0.05 were interpreted as statistically significant. These analyses were conducted in SAS Enterprise Guide Version 7.1 (SAS Institute, Cary, North Carolina, United States). Estimates were weighted to obtain representative results for the target population. These weights include adjustments for those who did not respond or who did not agree to share their data. Bootstrap weights were used for variance estimation, except in correlational analyses, as this option was not available. The sampling and bootstrap weights were developed by Statistics Canada.
Results
Descriptive statistics for the CINSS items are reported in Table 2. As observed in other data,Note 11 mean responses on the items and subscales of the CINSS were fairly high in the 2019 CHSCY. Indeed, mean responses were above the midpoint of the four-point scale for all CINSS items and subscales, indicating that the statements in the CINSS were rated by youth as “sort of true for me” (3) or “really true for me” (4) most often. Specifically, the percentage of youth reporting “really true for me” ranged from 24.3% to 87.8% across CINSS items, the percentage reporting “sort of true for me” ranged from 10.1% to 43.5%, the percentage reporting “sort of false for me” ranged from 1.4% to 23.2% and the percentage reporting “really false for me” ranged from 0.6%C (interpret the estimate with caution as the coefficient of variation is between 15 and 25) to 8.9%. The only item that had a mean score below 3.0 was “I like to be with my teachers,” and this might be attributable to a difference in the wording of the item, compared with the two corresponding relatedness items (i.e., “I like to spend time with my parents” and “I like to spend time with my friends” [emphasis added]). Male and female youth did not significantly differ on the autonomy subscale (Mdifference < 0.01, p = 0.97) or the competence subscale (Mdifference = 0.01, p = 0.51). Like previous research, however,Note 11 there was a statistically significant sex difference on the relatedness subscale, with females tending to score slightly higher than males (Mdifference = 0.04, p = 0.002).
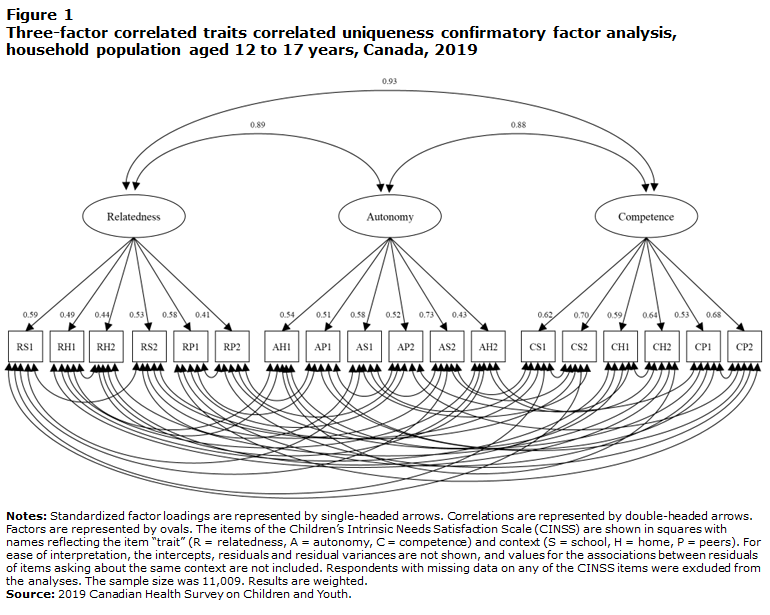
In general, support for the three-factor CTCU model was found in the CFA. The comparative fit index (CFI) was 0.969, which meets the cut-off of the CFI being 0.95 or higher.Note 20 The standardized root mean square residual (SRMR) was 0.029, which meets the cut-off of the SRMR being less than 0.08.Note 20 The root mean square error of approximation (RMSEA) was 0.031, which also meets the cut-off of the RMSEA being less than 0.06.Note 20 The Tucker-Lewis index (TLI) was 0.945, which was just below the cut-off of the TLI being 0.95 or higher.Note 20 All 18 CINSS items loaded significantly and positively onto their expected factor of relatedness, autonomy or competence, with standardized factor loadings from 0.41 to 0.73 (see Figure 1). The associations between residuals for items asking about home and parents were all significant and positive, as were the associations between residuals for items that asked about friends. By contrast, 7 of 15 associations between residuals for items asking about school were significant and positive, with the remainder either negatively or non-significantly associated. The three factors of relatedness, autonomy and competence were all strongly associated with one another (rs ≥ 0.88).
Description of Figure 1
The title of the figure is “Three-factor correlated traits correlated uniqueness confirmatory factor analysis, household population aged 12 to 17 years, Canada, 2019.”
The figure models the main results of the three-factor correlated traits correlated uniqueness confirmatory factor analysis.
There are three ovals near the top of the figure, which represent the three factors. Relatedness is written in the oval on the left, autonomy is written in the oval in the middle and competence is written in the oval on the right.
There are three double-headed arrows above the ovals, which represent the correlations between the factors. The double-headed arrow between the relatedness oval and the competence oval specifies a correlation of 0.93, the double-headed arrow between the relatedness oval and the autonomy oval specifies a correlation of 0.89, and the double-headed arrow between the autonomy oval and the competence oval specifies a correlation of 0.88.
Below the ovals, there are 18 squares presented side by side. The squares represent each item of the Children’s Intrinsic Needs Satisfaction Scale. Each of the squares is labelled based on what the item was originally intended to measure, in terms of the “trait” (R = relatedness, A = autonomy, C = competence) and context (S = school, H = home, P = peers). From left to right, the squares are labelled RS1, RH1, RH2, RS2, RP1, RP2, AH1, AP1, AS1, AP2, AS2, AH2, CS1, CS2, CH1, CH2, CP1 and CP2.
Six single-headed arrows from the relatedness oval to the six leftmost squares are shown, representing the standardized factor loadings of the items intended to measure relatedness. The standardized factor loadings are 0.59 for RS1, 0.49 for RH1, 0.44 for RH2, 0.53 for RS2, 0.58 for RP1 and 0.41 for RP2.
Six single-headed arrows from the autonomy oval to the six middlemost squares are shown, representing the standardized factor loadings of the items intended to measure autonomy. The standardized factor loadings are 0.54 for AH1, 0.51 for AP1, 0.58 for AS1, 0.52 for AP2, 0.73 for AS2 and 0.43 for AH2.
Six single-headed arrows from the competence oval to the six rightmost squares are shown, representing the standardized factor loadings of the items intended to measure competence. The standardized factor loadings are 0.62 for CS1, 0.70 for CS2, 0.59 for CH1, 0.64 for CH2, 0.53 for CP1 and 0.68 for CP2.
Below the squares are 45 double-headed arrows that represent the associations between residuals of items that ask about the same context. Fifteen double-headed arrows show the modelled associations between residuals of items that ask about school, including RS1, RS2, AS1, AS2, CS1 and CS2. Fifteen double-headed arrows show the modelled associations between residuals of items that ask about home, including RH1, RH2, AH1, AH2, CH1 and CH2. Fifteen double-headed arrows show the modelled associations between residuals of items that ask about peers, including RP1, RP2, AP1, AP2, CP1 and CP2.
The notes and source for the figure read as follows:
Notes: Standardized factor loadings are represented by single-headed arrows. Correlations are represented by double-headed arrows. Factors are represented by ovals. The items of the Children’s Intrinsic Needs Satisfaction Scale (CINSS) are shown in squares with names reflecting the item “trait” (R = relatedness, A = autonomy, C = competence) and context (S = school, H = home, P = peers). For ease of interpretation, the intercepts, residuals and residual variances are not shown, and values for the associations between residuals of items asking about the same context are not included. Respondents with missing data on any of the CINSS items were excluded from the analyses. The sample size was 11,009. Results are weighted.
Source: 2019 Canadian Health Survey on Children and Youth.
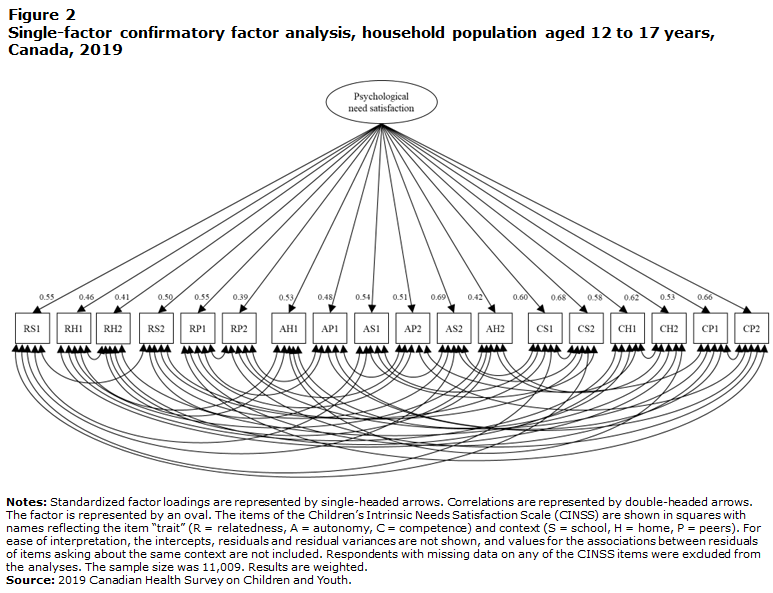
The secondary CFA that tested the simpler model with just one factor of overall psychological need satisfaction also met most of the cut-off criteria (CFI = 0.958, SRMR = 0.032, RMSEA = 0.035), except for one (TLI = 0.928). The CINSS items all loaded significantly and positively onto the psychological need satisfaction factor, with standardized factor loadings ranging from 0.39 to 0.69 (see Figure 2). However, the Bayesian information criterion was larger in the single-factor model than the three-factor model (351,874.82 versus 351,049.28), as was the Akaike information criterion (351,151.48 versus 350,304.02), suggesting that the three-factor model is better fitting.Note 21, Note 22
Description of Figure 2
The title of the figure is “Single-factor confirmatory factor analysis, household population aged 12 to 17 years, Canada, 2019.”
The figure models the main results of the single-factor confirmatory factor analysis.
There is one oval at the top of the figure, which represents the one factor. Psychological need satisfaction is written in the oval.
Below the oval, there are 18 squares presented side by side. The squares represent each item of the Children’s Intrinsic Needs Satisfaction Scale. Each of the squares is labelled based on what the item was originally intended to measure, in terms of the “trait” (R = relatedness, A = autonomy, C = competence) and context (S = school, H = home, P = peers). From left to right, the squares are labelled RS1, RH1, RH2, RS2, RP1, RP2, AH1, AP1, AS1, AP2, AS2, AH2, CS1, CS2, CH1, CH2, CP1 and CP2.
Eighteen single-headed arrows from the psychological need satisfaction oval to each of the squares are shown, representing the standardized factor loadings. The standardized factor loadings are 0.55 for RS1, 0.46 for RH1, 0.41 for RH2, 0.50 for RS2, 0.55 for RP1, 0.39 for RP2, 0.53 for AH1, 0.48 for AP1, 0.54 for AS1, 0.51 for AP2, 0.69 for AS2, 0.42 for AH2, 0.60 for CS1, 0.68 for CS2, 0.58 for CH1, 0.62 for CH2, 0.53 for CP1 and 0.66 for CP2.
Below the squares are 45 double-headed arrows that represent the associations between residuals of items that ask about the same context. Fifteen double-headed arrows show the modelled associations between residuals of items that ask about school, including RS1, RS2, AS1, AS2, CS1 and CS2. Fifteen double-headed arrows show the modelled associations between residuals of items that ask about home, including RH1, RH2, AH1, AH2, CH1 and CH2. Fifteen double-headed arrows show the modelled associations between residuals of items that ask about peers, including RP1, RP2, AP1, AP2, CP1 and CP2.
The notes and source for the figure read as follows:
Notes: Standardized factor loadings are represented by single-headed arrows. Correlations are represented by double-headed arrows. The factor is represented by an oval. The items of the Children’s Intrinsic Needs Satisfaction Scale (CINSS) are shown in squares with names reflecting the item “trait” (R = relatedness, A = autonomy, C = competence) and context (S = school, H = home, P = peers). For ease of interpretation, the intercepts, residuals and residual variances are not shown, and values for the associations between residuals of items asking about the same context are not included. Respondents with missing data on any of the CINSS items were excluded from the analyses. The sample size was 11,009. Results are weighted.
Source: 2019 Canadian Health Survey on Children and Youth.
Correlations between CINSS items are reported in Appendix Tables 1-A, 1-B, 1-C and 1-D and organized according to whether the items measure the same or different “trait” (i.e., relatedness, autonomy or competence) in the same or different context (i.e., school, home or friends). All items in the CINSS were significantly and positively associated. The correlations between items measuring the same trait in the same context tended to be the strongest (average r = 0.48; rs ranging from 0.29 to 0.60; see Appendix Table 1-A). The correlations between items measuring different traits in different contexts tended to be the weakest (average r = 0.28; rs ranging from 0.12 to 0.48; see Appendix Table 1-D). The strength of correlations between items measuring different traits in the same context (average r = 0.43; rs ranging from 0.22 to 0.61; see Appendix Table 1-C) and items measuring the same trait in different contexts (average r = 0.32; rs ranging from 0.17 to 0.49; see Appendix Table 1-B) tended to fall in between.
Associations between the CINSS subscales and bullying victimization and behaviour problems are presented in Table 3. The interpretation of results was the same for the unadjusted and adjusted regression analyses, so the former was not reported in Table 3. Across all 10 bullying victimization variables, youth who reported being bullied at least monthly scored significantly lower on all three of the CINSS subscales, compared with those who reported being bullied less often or never. Similarly, youth who reported losing their temper or yelling and swearing at their parents at least sometimes had significantly lower relatedness, autonomy and competence scores, compared with those who reported rarely or never having these behaviour problems. In the unadjusted analyses, the bullying victimization experiences explained between 1.3% and 7.0% of the variance in the CINSS subscales, while the behaviour problems explained between 2.9% and 4.7%.
Associations between the CINSS subscales and other mental health variables in the 2019 CHSCY are reported in Table 4 and Table 5. The interpretation of results was the same for the unadjusted and adjusted regression analyses, so the former was not reported in Table 4 and Table 5. Youth who reported high self-rated mental health and happiness, and lower perceived stress, scored significantly higher on the relatedness, autonomy and competence subscales of the CINSS. Furthermore, significant positive correlations were found between life satisfaction and each of the CINSS subscales (rs = 0.48 to 0.52). Nevertheless, the correlations between the CINSS subscales were even stronger (rs ≥ 0.68). In the unadjusted analyses, the other mental health variables explained between 5.7% and 26.5% of the variance in the CINSS subscales.
Cronbach’s alphas were 0.72 for the relatedness subscale, 0.73 for the autonomy subscale and 0.81 for the competence subscale, which is in a similar range as that observed previously and could be considered adequate.Note 6, Note 11
| Prevalence | CINSS subscale | ||||||||||||||||||||
|---|---|---|---|---|---|---|---|---|---|---|---|---|---|---|---|---|---|---|---|---|---|
| Relatedness | Autonomy | Competence | |||||||||||||||||||
| % | 95% confidence interval |
Mean | 95% confidence interval |
Adjusted | Mean | 95% confidence interval |
Adjusted | Mean | 95% confidence interval |
Adjusted | |||||||||||
| b | 95% confidence interval |
b | 95% confidence interval |
b | 95% confidence interval |
||||||||||||||||
| from | to | from | to | from | to | from | to | from | to | from | to | from | to | ||||||||
| Self-rated mental health | |||||||||||||||||||||
| Excellent or very good | 66.2 | 65.1 | 67.3 | 3.6 | 3.6 | 3.6 | 0.29 | 0.27 | 0.32 | 3.5 | 3.5 | 3.5 | 0.40 | 0.37 | 0.43 | 3.5 | 3.5 | 3.6 | 0.39 | 0.36 | 0.42 |
| Good, fair or poorTable 4 Note † | 33.8 | 32.7 | 34.9 | 3.3 | 3.3 | 3.3 | Note ...: not applicable | Note ...: not applicable | Note ...: not applicable | 3.1 | 3.1 | 3.1 | Note ...: not applicable | Note ...: not applicable | Note ...: not applicable | 3.1 | 3.1 | 3.2 | Note ...: not applicable | Note ...: not applicable | Note ...: not applicable |
| Happiness | |||||||||||||||||||||
| Happy and interested in life | 64.3 | 63.1 | 65.5 | 3.6 | 3.6 | 3.6 | 0.38 | 0.36 | 0.40 | 3.5 | 3.5 | 3.5 | 0.45 | 0.42 | 0.48 | 3.6 | 3.6 | 3.6 | 0.46 | 0.43 | 0.48 |
| Somewhat happy, somewhat unhappy, unhappy with little interest in life or so unhappy that life is not worthwhileTable 4 Note † |
35.7 | 34.5 | 36.9 | 3.2 | 3.2 | 3.2 | Note ...: not applicable | Note ...: not applicable | Note ...: not applicable | 3.1 | 3.0 | 3.1 | Note ...: not applicable | Note ...: not applicable | Note ...: not applicable | 3.1 | 3.1 | 3.1 | Note ...: not applicable | Note ...: not applicable | Note ...: not applicable |
| Stress | |||||||||||||||||||||
| Not at all, not very or a bit stressfulTable 4 Note † |
79.5 | 78.5 | 80.5 | 3.5 | 3.5 | 3.5 | Note ...: not applicable | Note ...: not applicable | Note ...: not applicable | 3.4 | 3.4 | 3.4 | Note ...: not applicable | Note ...: not applicable | Note ...: not applicable | 3.5 | 3.5 | 3.5 | Note ...: not applicable | Note ...: not applicable | Note ...: not applicable |
| Quite a bit or extremely stressful |
20.5 | 19.5 | 21.5 | 3.3 | 3.2 | 3.3 | -0.26 | -0.29 | -0.22 | 3.1 | 3.0 | 3.1 | -0.35 | -0.39 | -0.31 | 3.1 | 3.1 | 3.2 | -0.33 | -0.37 | -0.29 |
|
... not applicable † reference category Notes: b = unstandardized regression coefficient. CINSS = Children’s Intrinsic Needs Satisfaction Scale. Adjusted analyses included sex, age, racialized population, place of residence and household income tertile as covariates. Analyses involving the CINSS excluded respondents with missing data on any of the CINSS items or covariates, with sample sizes ranging from 10,933 to 10,951 in those analyses because of missing data on the other mental health variables. Results are weighted. The reported regression coefficients are all statistically significant (p < 0.001). Source: 2019 Canadian Health Survey on Children and Youth. |
|||||||||||||||||||||
| Average response | CINSS subscale | |||||||||||||||||
|---|---|---|---|---|---|---|---|---|---|---|---|---|---|---|---|---|---|---|
| Relatedness | Autonomy | Competence | ||||||||||||||||
| Mean | 95% confidence interval |
Pearson correlation coefficient |
p-value | Adjusted | Pearson correlation coefficient |
p-value | Adjusted | Pearson correlation coefficient |
p-value | Adjusted | ||||||||
| b | 95% confidence interval |
b | 95% confidence interval |
b | 95% confidence interval |
|||||||||||||
| from | to | from | to | from | to | from | to | |||||||||||
| Life satisfaction |
8.0 | 8.0 | 8.1 | 0.48 | < 0.001 | 0.1 | 0.11 | 0.13 | 0.49 | < 0.001 | 0.15 | 0.15 | 0.16 | 0.51 | < 0.001 | 0.15 | 0.14 | 0.16 |
|
Notes: b = unstandardized regression coefficient. CINSS = Children’s Intrinsic Needs Satisfaction Scale. Adjusted analyses included sex, age, racialized population, place of residence and household income tertile as covariates. Analyses involving the CINSS excluded respondents with missing data on any of the CINSS items, covariates or life satisfaction, resulting in a sample size of 10,953. Results are weighted. The reported regression coefficients are all statistically significant (p < 0.001). Source: 2019 Canadian Health Survey on Children and Youth. |
||||||||||||||||||
Discussion
Adolescence is an important time of development. It is essential that valid tools be used to monitor the psychological and social functioning of Canadians during this period of life. The current validation analyses provide further support for the CINSS being an appropriate measure of psychological and social well-being among youth in Canada.
Overall, support was found for the factorial validity of the CINSS. A CTCU model with relatedness, autonomy and competence as the correlated “traits” and associations between items assessing the same context (i.e., home, school or friends) fit the data adequately, according to three of four cut-off criteria from Hu and Bentler,Note 20 with the fourth criteria just barely not met. All factor loadings and associations were positive and statistically significant, except for the associations between residuals for some of the school items. A similar pattern of results from the CFA observed in the current study was found in the analysis conducted by Orpana et al.Note 11 Moreover, support was found for a three-factor model fitting the data better than a single-factor model, and this is in line with the self-determination theory that underpinned the original development of the CINSS.Note 6, Note 8, Note 9 Nevertheless, given the strong correlations between the three factors, the adequate model fit of the single-factor CFA across most metrics and the limitations of the method used to compare models,Note 23 researchers could also be justified in employing the CINSS to broadly assess psychological need satisfaction (or eudaimonic well-being)Note 24 in the 2019 CHSCY.
The zero-order correlations between items measuring the same “trait” in the same context tended to be the strongest (providing support for convergent validity), while the zero-order correlations between items measuring different “traits” in different contexts tended to be the weakest (providing support for divergent validity). Similar to previous validation analyses,Note 11 the CINSS subscales had acceptable internal consistency and were associated with self-reported bullying victimization and behaviour problems in a manner consistent with expectations.Note 8, Note 9, Note 10, Note 12, Note 13, Note 14
In addition, youth who reported high self-rated mental health and happiness, higher life satisfaction, and lower perceived stress scored significantly higher on all three of the CINSS subscales. These findings provide novel support for the convergent validity of the CINSS, as autonomy, competence and relatedness should be associated with other measures of positive mental health from the PMHSIF.Note 8, Note 13 Nevertheless, autonomy, competence and relatedness were more strongly associated with one another than with a conceptually distinct positive mental health outcome (i.e., life satisfaction), supporting the divergent validity of the CINSS. Furthermore, around one-quarter or less of the variance in the CINSS subscales could be explained by the other mental health variables. This highlights the importance of examining multiple positive mental health outcomes to gain a complete understanding of the nuanced aspects of youth well-being. How the CINSS compares with other multi-item measures of positive mental health that have been used with youth (e.g., Warwick-Edinburgh Mental Wellbeing Scale, WHO-5 Well-Being Index)Note 25, Note 26 could be explored in future research.
Strengths and limitations
The validation of the CINSS in a dataset with a broader and more representative sample and different collection methods than the CSTADS supports the CINSS as an appropriate measure of the psychological and social well-being of youth in Canada. Of note, an overall pattern of youth responding somewhat more positively to the CINSS items in the 2019 CHSCY sample, compared with the 2014/2015 CSTADS sample, was observed. However, the current investigation cannot speak to whether meaningful differences in the CINSS scores exist between the two samples and, if so, why (e.g., different sampling strategies, data collection methods, time periods). Regardless, in both samples, responses to the CINSS tended to be negatively skewed, with most youth responding “sort of true for me” and “really true for me” across items. Potentially alleviating concerns of ceiling effects, the CINSS subscales were still shown to be sufficiently sensitive to distinguish youth with better mental health and fewer psychosocial difficulties from others, even after controlling for various sociodemographic characteristics. Moreover, the distribution observed on the CINSS is not unique; many measures that assess aspects of well-being show clustering toward the positive end of their scale (e.g., life satisfaction, purpose and meaning in life, social support).Note 27, Note 28, Note 29, Note 30
The 2019 CHSCY used a more inclusive sampling frame than the 2014/2015 CSTADS and allowed for a more in-depth examination of how the CINSS is associated with other measures of mental health, including other positive mental health outcomes from the PMHSIF.Note 5 Nevertheless, there are limitations to the 2019 CHSCY and the analyses that restrict the conclusions that can be drawn in the current investigation. For instance, some subpopulations of youth (i.e., institutionalized, living in foster homes, or living on First Nations reserves or settlements) were excluded from the 2019 CHSCY, and the CINSS was not administered to younger children (under 12 years of age). Future research should evaluate the appropriateness of the CINSS for use in additional subpopulations of youth and among younger age groups. Furthermore, the predictive validity or test-retest reliability of the CINSS could not be examined, given the cross-sectional nature of the 2019 CHSCY data. Longitudinal follow-up of CINSS scores in future youth population health surveys will be important for addressing these limitations and will be beneficial for monitoring longer-term trends in social and psychological well-being among Canadian youth. The relatively low response rate and the number of respondents with data that were not shared could have affected the results of this study,Note 31 although analyses were weighted to attempt to account for non-response and non-sharing. Lastly, although the CFA for the three-factor model in the current study replicated the CTCU model tested in previous research,Note 11 it is important to note that CTCU models in general are not without limitations.Note 32 For instance, there is the potential for trait factor loadings and correlations to be biased in CTCU models, depending on the magnitude of method effects and their correlations.Note 33
Conclusion
This study provides additional support for the validity of the CINSS and the use of its autonomy, competence and relatedness subscales as measures of psychological and social well-being in the youth version of the PMHSIF.Note 7 With the abundance of variables assessed in the 2019 CHSCY (e.g., substance use, work, volunteering), further investigation of the correlates and distribution of autonomy, competence and relatedness is possible and recommended. The inclusion of the CINSS in future surveys of youth population health would allow for continued public health surveillance of the psychological and social well-being of youth in Canada. This will be particularly important for understanding the wider impacts of the COVID-19 pandemic on the well-being of youth in Canada.Note 34, Note 35
| Variables | Pearson correlation coefficient |
|---|---|
| Relatedness school item 1 (RS1) and Relatedness school item 2 (RS2) | 0.58 |
| Relatedness home item 1 (RH1) and Relatedness home item 2 (RH2) | 0.47 |
| Relatedness peers item 1 (RP1) and Relatedness peers item 2 (RP2) | 0.60 |
| Autonomy home item 1 (AH1) and Autonomy home item 2 (AH2) | 0.29 |
| Autonomy peers item 1 (AP1) and Autonomy peers item 2 (AP2) | 0.44 |
| Autonomy school item 1 (AS1) and Autonomy school item 2 (AS2) | 0.33 |
| Competence school item 1 (CS1) and Competence school item 2 (CS2) | 0.59 |
| Competence home item 1 (CH1) and Competence home item 2 (CH2) | 0.51 |
| Competence peers item 1 (CP1) and Competence peers item 2 (CP2) | 0.54 |
|
Notes: CINSS = Children’s Intrinsic Needs Satisfaction Scale. Respondents with missing data on any of the CINSS items were excluded from the correlation analyses. The sample size was 11,009. The correlation estimates are weighted. All correlations were statistically significant (p < 0.001). Source: 2019 Canadian Health Survey on Children and Youth. |
|
| Variables | Pearson correlation coefficient |
|---|---|
| Relatedness school item 1 (RS1) and Relatedness home item 1 (RH1) | 0.32 |
| Relatedness school item 1 (RS1) and Relatedness home item 2 (RH2) | 0.29 |
| Relatedness school item 1 (RS1) and Relatedness peers item 1 (RP1) | 0.32 |
| Relatedness school item 1 (RS1) and Relatedness peers item 2 (RP2) | 0.22 |
| Relatedness home item 1 (RH1) and Relatedness school item 2 (RS2) | 0.33 |
| Relatedness home item 1 (RH1) and Relatedness peers item 1 (RP1) | 0.26 |
| Relatedness home item 1 (RH1) and Relatedness peers item 2 (RP2) | 0.21 |
| Relatedness home item 2 (RH2) and Relatedness school item 2 (RS2) | 0.17 |
| Relatedness home item 2 (RH2) and Relatedness peers item 1 (RP1) | 0.29 |
| Relatedness home item 2 (RH2) and Relatedness peers item 2 (RP2) | 0.25 |
| Relatedness school item 2 (RS2) and Relatedness peers item 1 (RP1) | 0.26 |
| Relatedness school item 2 (RS2) and Relatedness peers item 2 (RP2) | 0.18 |
| Autonomy home item 1 (AH1) and Autonomy peers item 1 (AP1) | 0.31 |
| Autonomy home item 1 (AH1) and Autonomy school item 1 (AS1) | 0.28 |
| Autonomy home item 1 (AH1) and Autonomy peers item 2 (AP2) | 0.32 |
| Autonomy home item 1 (AH1) and Autonomy school item 2 (AS2) | 0.37 |
| Autonomy peers item 1 (AP1) and Autonomy school item 1 (AS1) | 0.23 |
| Autonomy peers item 1 (AP1) and Autonomy school item 2 (AS2) | 0.48 |
| Autonomy peers item 1 (AP1) and Autonomy home item 2 (AH2) | 0.17 |
| Autonomy school item 1 (AS1) and Autonomy peers item 2 (AP2) | 0.29 |
| Autonomy school item 1 (AS1) and Autonomy home item 2 (AH2) | 0.38 |
| Autonomy peers item 2 (AP2) and Autonomy school item 2 (AS2) | 0.38 |
| Autonomy peers item 2 (AP2) and Autonomy home item 2 (AH2) | 0.25 |
| Autonomy school item 2 (AS2) and Autonomy home item 2 (AH2) | 0.26 |
| Competence school item 1 (CS1) and Competence home item 1 (CH1) | 0.38 |
| Competence school item 1 (CS1) and Competence home item 2 (CH2) | 0.42 |
| Competence school item 1 (CS1) and Competence peers item 1 (CP1) | 0.28 |
| Competence school item 1 (CS1) and Competence peers item 2 (CP2) | 0.41 |
| Competence school item 2 (CS2) and Competence home item 1 (CH1) | 0.39 |
| Competence school item 2 (CS2) and Competence home item 2 (CH2) | 0.49 |
| Competence school item 2 (CS2) and Competence peers item 1 (CP1) | 0.32 |
| Competence school item 2 (CS2) and Competence peers item 2 (CP2) | 0.47 |
| Competence home item 1 (CH1) and Competence peers item 1 (CP1) | 0.35 |
| Competence home item 1 (CH1) and Competence peers item 2 (CP2) | 0.40 |
| Competence home item 2 (CH2) and Competence peers item 1 (CP1) | 0.30 |
| Competence home item 2 (CH2) and Competence peers item 2 (CP2) | 0.42 |
|
Notes: CINSS = Children’s Intrinsic Needs Satisfaction Scale. Respondents with missing data on any of the CINSS items were excluded from the correlation analyses. The sample size was 11,009. The correlation estimates are weighted. All correlations were statistically significant (p < 0.001). Source: 2019 Canadian Health Survey on Children and Youth. |
|
| Variables | Pearson correlation coefficient |
|---|---|
| Relatedness school item 1 (RS1) and Autonomy school item 1 (AS1) | 0.27 |
| Relatedness school item 1 (RS1) and Autonomy school item 2 (AS2) | 0.39 |
| Relatedness school item 1 (RS1) and Competence school item 1 (CS1) | 0.44 |
| Relatedness school item 1 (RS1) and Competence school item 2 (CS2) | 0.61 |
| Relatedness school item 2 (RS2) and Autonomy school item 1 (AS1) | 0.28 |
| Relatedness school item 2 (RS2) and Autonomy school item 2 (AS2) | 0.42 |
| Relatedness school item 2 (RS2) and Competence school item 1 (CS1) | 0.36 |
| Relatedness school item 2 (RS2) and Competence school item 2 (CS2) | 0.50 |
| Autonomy school item 1 (AS1) and Competence school item 1 (CS1) | 0.32 |
| Autonomy school item 1 (AS1) and Competence school item 2 (CS2) | 0.35 |
| Autonomy school item 2 (AS2) and Competence school item 1 (CS1) | 0.35 |
| Autonomy school item 2 (AS2) and Competence school item 2 (CS2) | 0.44 |
| Relatedness home item 1 (RH1) and Autonomy home item 1 (AH1) | 0.51 |
| Relatedness home item 1 (RH1) and Autonomy home item 2 (AH2) | 0.29 |
| Relatedness home item 1 (RH1) and Competence home item 1 (CH1) | 0.46 |
| Relatedness home item 1 (RH1) and Competence home item 2 (CH2) | 0.44 |
| Relatedness home item 2 (RH2) and Autonomy home item 1 (AH1) | 0.48 |
| Relatedness home item 2 (RH2) and Autonomy home item 2 (AH2) | 0.22 |
| Relatedness home item 2 (RH2) and Competence home item 1 (CH1) | 0.37 |
| Relatedness home item 2 (RH2) and Competence home item 2 (CH2) | 0.49 |
| Autonomy home item 1 (AH1) and Competence home item 1 (CH1) | 0.46 |
| Autonomy home item 1 (AH1) and Competence home item 2 (CH2) | 0.47 |
| Autonomy home item 2 (AH2) and Competence home item 1 (CH1) | 0.33 |
| Autonomy home item 2 (AH2) and Competence home item 2 (CH2) | 0.30 |
| Relatedness peers item 1 (RP1) and Autonomy peers item 1 (AP1) | 0.57 |
| Relatedness peers item 1 (RP1) and Autonomy peers item 2 (AP2) | 0.48 |
| Relatedness peers item 1 (RP1) and Competence peers item 1 (CP1) | 0.56 |
| Relatedness peers item 1 (RP1) and Competence peers item 2 (CP2) | 0.60 |
| Relatedness peers item 2 (RP2) and Autonomy peers item 1 (AP1) | 0.53 |
| Relatedness peers item 2 (RP2) and Autonomy peers item 2 (AP2) | 0.39 |
| Relatedness peers item 2 (RP2) and Competence peers item 1 (CP1) | 0.49 |
| Relatedness peers item 2 (RP2) and Competence peers item 2 (CP2) | 0.46 |
| Autonomy peers item 1 (AP1) and Competence peers item 1 (CP1) | 0.52 |
| Autonomy peers item 1 (AP1) and Competence peers item 2 (CP2) | 0.46 |
| Autonomy peers item 2 (AP2) and Competence peers item 1 (CP1) | 0.52 |
| Autonomy peers item 2 (AP2) and Competence peers item 2 (CP2) | 0.45 |
|
Notes: CINSS = Children’s Intrinsic Needs Satisfaction Scale. Respondents with missing data on any of the CINSS items were excluded from the correlation analyses. The sample size was 11,009. The correlation estimates are weighted. All correlations were statistically significant (p < 0.001). Source: 2019 Canadian Health Survey on Children and Youth. |
|
| Variables | Pearson correlation coefficient |
|---|---|
| Relatedness school item 1 (RS1) and Autonomy home item 1 (AH1) | 0.31 |
| Relatedness school item 1 (RS1) and Autonomy peers item 1 (AP1) | 0.22 |
| Relatedness school item 1 (RS1) and Autonomy peers item 2 (AP2) | 0.25 |
| Relatedness school item 1 (RS1) and Autonomy home item 2 (AH2) | 0.22 |
| Relatedness school item 1 (RS1) and Competence home item 1 (CH1) | 0.31 |
| Relatedness school item 1 (RS1) and Competence home item 2 (CH2) | 0.37 |
| Relatedness school item 1 (RS1) and Competence peers item 1 (CP1) | 0.27 |
| Relatedness school item 1 (RS1) and Competence peers item 2 (CP2) | 0.36 |
| Relatedness home item 1 (RH1) and Autonomy peers item 1 (AP1) | 0.22 |
| Relatedness home item 1 (RH1) and Autonomy school item 1 (AS1) | 0.25 |
| Relatedness home item 1 (RH1) and Autonomy peers item 2 (AP2) | 0.24 |
| Relatedness home item 1 (RH1) and Autonomy school item 2 (AS2) | 0.30 |
| Relatedness home item 1 (RH1) and Competence school item 1 (CS1) | 0.30 |
| Relatedness home item 1 (RH1) and Competence school item 2 (CS2) | 0.32 |
| Relatedness home item 1 (RH1) and Competence peers item 1 (CP1) | 0.25 |
| Relatedness home item 1 (RH1) and Competence peers item 2 (CP2) | 0.28 |
| Relatedness home item 2 (RH2) and Autonomy peers item 1 (AP1) | 0.24 |
| Relatedness home item 2 (RH2) and Autonomy school item 1 (AS1) | 0.24 |
| Relatedness home item 2 (RH2) and Autonomy peers item 2 (AP2) | 0.25 |
| Relatedness home item 2 (RH2) and Autonomy school item 2 (AS2) | 0.23 |
| Relatedness home item 2 (RH2) and Competence school item 1 (CS1) | 0.25 |
| Relatedness home item 2 (RH2) and Competence school item 2 (CS2) | 0.29 |
| Relatedness home item 2 (RH2) and Competence peers item 1 (CP1) | 0.23 |
| Relatedness home item 2 (RH2) and Competence peers item 2 (CP2) | 0.27 |
| Relatedness school item 2 (RS2) and Autonomy home item 1 (AH1) | 0.24 |
| Relatedness school item 2 (RS2) and Autonomy peers item 1 (AP1) | 0.19 |
| Relatedness school item 2 (RS2) and Autonomy peers item 2 (AP2) | 0.25 |
| Relatedness school item 2 (RS2) and Autonomy home item 2 (AH2) | 0.26 |
| Relatedness school item 2 (RS2) and Competence home item 1 (CH1) | 0.29 |
| Relatedness school item 2 (RS2) and Competence home item 2 (CH2) | 0.32 |
| Relatedness school item 2 (RS2) and Competence peers item 1 (CP1) | 0.26 |
| Relatedness school item 2 (RS2) and Competence peers item 2 (CP2) | 0.33 |
| Relatedness peers item 1 (RP1) and Autonomy home item 1 (AH1) | 0.31 |
| Relatedness peers item 1 (RP1) and Autonomy school item 1 (AS1) | 0.26 |
| Relatedness peers item 1 (RP1) and Autonomy school item 2 (AS2) | 0.44 |
| Relatedness peers item 1 (RP1) and Autonomy home item 2 (AH2) | 0.19 |
| Relatedness peers item 1 (RP1) and Competence school item 1 (CS1) | 0.29 |
| Relatedness peers item 1 (RP1) and Competence school item 2 (CS2) | 0.34 |
| Relatedness peers item 1 (RP1) and Competence home item 1 (CH1) | 0.35 |
| Relatedness peers item 1 (RP1) and Competence home item 2 (CH2) | 0.34 |
| Relatedness peers item 2 (RP2) and Autonomy home item 1 (AH1) | 0.21 |
| Relatedness peers item 2 (RP2) and Autonomy school item 1 (AS1) | 0.17 |
| Relatedness peers item 2 (RP2) and Autonomy school item 2 (AS2) | 0.34 |
| Relatedness peers item 2 (RP2) and Autonomy home item 2 (AH2) | 0.12 |
| Relatedness peers item 2 (RP2) and Competence school item 1 (CS1) | 0.20 |
| Relatedness peers item 2 (RP2) and Competence school item 2 (CS2) | 0.24 |
| Relatedness peers item 2 (RP2) and Competence home item 1 (CH1) | 0.24 |
| Relatedness peers item 2 (RP2) and Competence home item 2 (CH2) | 0.23 |
| Autonomy home item 1 (AH1) and Competence school item 1 (CS1) | 0.30 |
| Autonomy home item 1 (AH1) and Competence school item 2 (CS2) | 0.36 |
| Autonomy home item 1 (AH1) and Competence peers item 1 (CP1) | 0.26 |
| Autonomy home item 1 (AH1) and Competence peers item 2 (CP2) | 0.32 |
| Autonomy peers item 1 (AP1) and Competence school item 1 (CS1) | 0.20 |
| Autonomy peers item 1 (AP1) and Competence school item 2 (CS2) | 0.25 |
| Autonomy peers item 1 (AP1) and Competence home item 1 (CH1) | 0.31 |
| Autonomy peers item 1 (AP1) and Competence home item 2 (CH2) | 0.24 |
| Autonomy school item 1 (AS1) and Competence home item 1 (CH1) | 0.32 |
| Autonomy school item 1 (AS1) and Competence home item 2 (CH2) | 0.36 |
| Autonomy school item 1 (AS1) and Competence peers item 1 (CP1) | 0.25 |
| Autonomy school item 1 (AS1) and Competence peers item 2 (CP2) | 0.30 |
| Autonomy peers item 2 (AP2) and Competence school item 1 (CS1) | 0.26 |
| Autonomy peers item 2 (AP2) and Competence school item 2 (CS2) | 0.30 |
| Autonomy peers item 2 (AP2) and Competence home item 1 (CH1) | 0.31 |
| Autonomy peers item 2 (AP2) and Competence home item 2 (CH2) | 0.33 |
| Autonomy school item 2 (AS2) and Competence home item 1 (CH1) | 0.36 |
| Autonomy school item 2 (AS2) and Competence home item 2 (CH2) | 0.34 |
| Autonomy school item 2 (AS2) and Competence peers item 1 (CP1) | 0.43 |
| Autonomy school item 2 (AS2) and Competence peers item 2 (CP2) | 0.48 |
| Autonomy home item 2 (AH2) and Competence school item 1 (CS1) | 0.23 |
| Autonomy home item 2 (AH2) and Competence school item 2 (CS2) | 0.24 |
| Autonomy home item 2 (AH2) and Competence peers item 1 (CP1) | 0.21 |
| Autonomy home item 2 (AH2) and Competence peers item 2 (CP2) | 0.23 |
|
Notes: CINSS = Children’s Intrinsic Needs Satisfaction Scale. Respondents with missing data on any of the CINSS items were excluded from the correlation analyses. The sample size was 11,009. The correlation estimates are weighted. All correlations were statistically significant (p < 0.001). Source: 2019 Canadian Health Survey on Children and Youth. |
|
- Date modified: