
Health Reports
Immigrant status and loneliness among older Canadians
by Md Kamrul Islam and Heather Gilmour

DOI: https://www.doi.org/10.25318/82-003-x202300700001-eng
Abstract
Background
Prevalence of loneliness among Canadians has become an important concern because of its wider consequences on health and well-being. However, there are limited Canadian studies about loneliness disaggregated by gender and across various subgroups of older Canadians, particularly immigrant subgroups.
Data and methods
Data from the Canadian Health Survey on Seniors (CHSS) – 2019/2020 were used to estimate the prevalence of loneliness among older Canadians in a nationally representative sample of 38,941 Canadians aged 65 and older. The association between immigrant status and loneliness was assessed using multivariable logistic regression adjusted for demographic, socioeconomic and health characteristics. Analyses were conducted for men and women combined and separately.
Results
In 2019/2020, an estimated 1.1 million older Canadians (19.2%) experienced loneliness, with women having significantly higher likelihood of being lonely than men. Among men, both European and non-European immigrants were more likely to experience loneliness than the Canadian-born population. Among women, the likelihood of loneliness was higher among European immigrants than among those born in Canada. For both men and women, immigrants who migrated as adults (from ages 18 to 44) and long-term immigrants (20 years or more in Canada since immigration) were at higher risk of loneliness than the Canadian-born population. The likelihood of being lonely was higher among people living with multimorbidity or experiencing barriers to social participation.
Interpretation
The findings underscore the importance of considering immigrant subgroups and gender in examining loneliness among older Canadians and when developing policies and programs to address loneliness.
Keywords
Loneliness, immigrant status, gender, aging, older adults
Authors
Md Kamrul Islam and Heather Gilmour are with the Health Analysis Division at Statistics Canada.
What is already known on this subject?
- Prevalence of loneliness is increasingly common among Canadians. Loneliness has a wide range of negative consequences on individual health and well-being, including higher risk of poor mental health, morbidity, disability, frailty, and mortality.
- Immigrants are at a higher risk of experiencing loneliness than the Canadian-born population. However, little is known about the extent to which the risk of loneliness varies across immigrant subgroups (based on country of origin, age at immigration, and time since immigration) in relation to those born in Canada.
- Women are more likely than men to experience loneliness, but little is known about gender differences in loneliness among immigrant subgroups of older Canadians.
What does this study add?
- An estimated one in five older Canadians experienced loneliness in 2019/2020. Women were significantly more likely than men to be lonely.
- Among men, both European immigrants and non-European immigrants were at higher risk of experiencing loneliness than the Canadian-born population, while among women, this was the case only for European immigrants.
- Immigrants who migrated to Canada as adults (from ages 18 to 44) were more likely to experience loneliness than those born in Canada, for both men and women. Similarly, both men and women long-term immigrants (20 years or more in Canada since immigration) were more likely to be lonely than the Canadian-born population.
- Those living with multimorbidity or reporting barriers to social participation were at a higher risk of loneliness than those who did not have these circumstances.
Introduction
Prevalence of loneliness among Canadians has become an important concern among policy makers and program planners because of its wider consequences on health and well-being. Lonely individuals are at greater risk of experiencing poor mental and physical health, including higher levels of stress, depression and anxiety,Note 1, Note 2, Note 3 and higher risk of morbidity, disability and frailty.Note 1, Note 4, Note 5 For example, using longitudinal data, Davies and colleagues,Note 5 revealed that older adults living with medium or high loneliness had higher relative risk (1.6 times and 2.6 times, respectively) of developing frailty than those with a low level of loneliness. Other research has shown that the risk of death is also higher among individuals experiencing infrequent social participationNote 6, Note 7 and loneliness.Note 8, Note 9
Loneliness has been defined as people’s perception about the adequacy of their network of social relations, either in terms of quantity or quality.Note 10 In 2021, about 13.0% of Canadians aged 15 and older reported always or often feeling lonely, with women experiencing higher levels of loneliness than men (15% versus 11%).Note 3 Among older adults (65 years and older), prevalence of loneliness grows with increasing ageNote 3, Note 5, Note 11, Note 12 and may be attributable to factors that relate more specifically to older ages, such as smaller social networks, decreasing financial resources, increasing chronic conditions and poor functional health.
Previous research has identified associations between loneliness and both modifiable and non-modifiable risk factors, including demographic,Note 3, Note 5, Note 13, Note 14, Note 15, Note 16 socioeconomic,Note 14, Note 16, Note 17, Note 18 and health status,Note 14, Note 17, Note 19 and social participation.Note 20 Among these factors, a limited number of studies have identified the greater likelihood of loneliness among immigrants compared with the Canadian-born population,Note 16 specifically among older adults.Note 10, Note 21 Immigrants may be particularly vulnerable to loneliness because of disruptions in their social network, language barriers and stress associated with getting settled in the host country.Note 10, Note 22 Understanding the association between immigrant status and loneliness among older Canadians is especially relevant because immigrants comprise 30% of the population aged 65 or older, compared with 23% of the total population.Note 23
Wu and PenningNote 21 emphasized the importance of acknowledging the diversity of immigrant experiences across the life course to better understand the factors associated with loneliness. Existing research has indicated that loneliness among immigrants can differ by race or ethnicity,Note 21 length of time in host country,Note 16, Note 21 age at immigration,Note 21 mother tongue,Note 16 similarity of culture to the host country and social network.Note 10
Gender differences in loneliness are well documented in the literature, but previous studies did not examine the associations between immigrant status and loneliness of men and women separately.Note 10, Note 16, Note 21 Loneliness among immigrants may vary considerably between men and women because of various factors, including differences in socioeconomic status,Note 24 language skills,Note 25 sense of belonging to local community,Note 26 and health status.Note 27 Thus, whether differences in the loneliness experienced by men and women exist among immigrant subgroups, compared with the Canadian-born population, is not well understood.
Building on previous research, the current study assesses the prevalence of, and factors associated with loneliness among older Canadians, with particular focus on evaluating differences in loneliness across immigrant subgroups. Specifically, this study separately examined the association between loneliness and immigrant origin (European, non-European), age at immigration, and time since immigration. Drawing on the World Health Organization’s conceptual framework on the social determinants of healthNote 28 and the life course perspective,Note 29, Note 30 demographic, socioeconomic, and health characteristics were considered in the multivariable analysis. Analyses were categorized into men and women to examine the extent to which factors associated with loneliness vary between them among immigrant subgroups. In addition, because the COVID-19 pandemic has increased loneliness among individuals of all backgrounds,Note 31 and because data collection spanned a pre-pandemic period and pandemic restriction period, the association of COVID-19 with loneliness was considered in this analysis.
Methods
Data source
Data from the Canadian Health Survey on Seniors (CHSS) – 2019/2020 were used to examine loneliness among older Canadians. The CHSS is a cross-sectional supplement to the Canadian Community Health Survey (CCHS), which collected detailed information on health status, health care services, social provisions, and social determinants of health. Individuals living on reserves and in other Indigenous communities in the provinces, full-time members of the Canadian Forces, the institutionalized population, and individuals living in certain remote regions were excluded from the 2019/2020 CHSS.
Data were collected from January 2019 to December 2020, with a pause from mid-March until September 2020 because of the COVID-19 pandemic. A total of 41,635 persons aged 65 and older were interviewed using a combination of personal and telephone interviews. The response rate for the 2019/2020 CHSS was 40.1%, of which 90.8% agreed to link their responses to the CCHS. Detailed documentation for the 2019/2020 CHSS is available at https://www23.statcan.gc.ca/imdb/p2SV.pl?Function=getSurvey&SDDS=5267.
Study sample
Questions for the loneliness module were not asked in proxy interviews and were excluded from the analysis. After the exclusion, the analytical sample for this study was 38,941 respondents aged 65 and older (16,522 men and 22,419 women), representing 5.9 million people living in the community in the 10 provinces.
Definitions
Loneliness
The three-item loneliness scaleNote 32 measures an individual’s loneliness. On a three-point Likert scale (hardly ever, some of the time, and often), respondents answered the following questions: “How often do you feel
- that you lack companionship?
- left out?
- isolated from others?”
Higher scores indicated greater loneliness, while the distribution was skewed toward lower scores. Scores were dichotomized to classify respondents in the top quintile of the frequency distribution as experiencing loneliness.Note 33 Thus, participants who responded “some of the time” to two or more items or “often” to one or more items—resulting in a score of at least 5—were coded as “lonely.”
Immigrant status
Considering the importance of ethnic origin, language skills, and cultural background in examining loneliness,Note 10 immigrant origin was classified into three categories based on country of birth: European immigrants, non-European immigrants, and Canadian-born population. Age at immigration was defined as immigrants who migrated as children (younger than 18 years), immigrants who migrated as adults (from 18 to 44 years), immigrants who migrated at older ages (45 years or older), and the Canadian-born population. Time since immigration was coded as recent immigrants (0 to 9 years in Canada), medium-term immigrants (10 to 19 years in Canada), and long-term immigrants (20 years or more in Canada).
Covariates
The selection of covariates for the multivariable analyses was guided by the literature and data availability in the CHSS, and included demographic, socioeconomic and health variables that have been associated with loneliness. Among the three categories of gender available in the 2019/2020 CHSS (male, female, and gender diverse), the first two categories were used for this analysis and the third category was excluded because of a very small number of cases (<10). Age was grouped into three categories (in years): 65 to 74, 75 to 84, and 85 or older. Marital status was classified as married or common-law, widowed, separated or divorced, and single or never married.
Respondents’ level of education was categorized as postsecondary and less than postsecondary. Household income quintiles were defined as lowest, low-middle, middle, high-middle, and highest.
Multimorbidity was defined as having two or more chronic conditions that had been diagnosed by a health professional, and that had lasted or were expected to last at least six months. Conditions included asthma, chronic obstructive pulmonary disease, sleep apnea, fibromyalgia, arthritis, osteoporosis, high blood pressure, high blood cholesterol or lipids, heart disease, stroke, diabetes, cancer, Alzheimer’s disease, chronic fatigue syndrome, mood disorder, anxiety disorder, back problems, chronic kidney disease, bowel disorder, urinary incontinence, Parkinson’s disease, cataracts, glaucoma, diabetic retinopathy, age-related macular degeneration and post-traumatic stress disorder.
Barriers to social participation was based on the question, “In the past 12 months, have you felt like you wanted to participate in more social, recreational or group activities?” (yes or no). Based on the Statistics Canada classification of population centres,Note 34 four categories were used: rural area (fewer than 1,000 people), small population centre (1,000 to 29,999), medium population centre (30,000 to 99,999), and large urban centre (100,000 or more).
Timing of the survey was based on the survey collection period and was coded as “before COVID-19 restrictions (January to December 2019, and January to March 2020)” and “during COVID-19 (September to December 2020).”
Analytical techniques
Weighted percentages and cross-tabulations were calculated to examine estimates of loneliness among older Canadians. Multivariable logistic regression was used to evaluate the association of immigrant status to loneliness after accounting for demographic, socioeconomic and health characteristics, as well as timing of the survey. Variance inflation factors below the acceptable threshold of 2.0 indicate that multicollinearity is not a problem for variables included in the multivariable analyses. Analyses were presented for men and women combined and separately. Immigrant subgroups examined include country of birth, age at immigration, and time since immigration, and were assessed in separate multivariable models. Adjusted odds ratios for all covariates are shown for the model, including country of birth. Models for age at immigration and time since immigration control for all the same covariates (with similar results) but, for brevity, tables present only the adjusted odds ratios for the immigrant subgroup and gender. The descriptive estimates of loneliness were based on available case analysis (unequal number of cases across immigrant status and the covariates). The logistic regression estimates were derived based on complete case analysis, equal number of cases across immigrant status and the covariates derived following list-wise deletion of missing cases. The percentages of missing cases in the selected variables were very low, ranging from 0.1% (marital status) to 1.2% (education).
Sampling weights were used in the analyses to ensure that the estimates were representative of the population. Bootstrap weights were applied (1000 iterations) for estimation of standard errors, coefficient of variation, and confidence intervals to account for the complex design of the CHSS.Note 35 Significance level alpha was set to 0.05. Analyses were performed using SAS 9.4 and SUDAAN 11.0.3.
Results
Characteristics of the study population
One-quarter of the study population (25.7%) were immigrants (12.8% European and 12.9% non-European), 23.0% of older Canadians were long-term immigrants (had arrived 20 years ago or more) and 16.0% of older Canadians were immigrants who came to Canada as adults. The majority of the study population (61.5%) was 65 to 74 years old, about two-thirds (63.6%) were married or common-law, 57.0% had a postsecondary education, 71.3% were living with multimorbidity and about one-quarter (23.3%) reported barriers to social participation. More than half (54.6%) lived in large population centres. The majority (61.6%) were interviewed before COVID-19 restrictions were put in place, and the rest (38.4%) were interviewed during the pandemic (Appendix A).
Women were more likely than men to have been born in Canada, to be 85 years or older, widowed, separated or divorced, among the lower income quintiles, and to report multimorbidity and barriers to social participation. They were less likely to be non-European immigrants, immigrants who migrated as adults, long-term immigrants, or to have a postsecondary education (Appendix A).
Prevalence of loneliness among older Canadians
According to the 2019/2020 CHSS, an estimated 1.1 million older Canadians (19.2%) experienced loneliness. Women were significantly more likely than men to have been lonely (23.0% versus 14.6%) (Table 1). Overall, both European and non-European immigrants were significantly more likely to report loneliness than the Canadian-born population, as were immigrants who migrated as adults or were long-term immigrants.
Gender-specific estimates revealed that among men, non-European immigrants (19.4%) had a significantly higher prevalence of loneliness than those born in Canada (13.3%). By contrast, among women, European immigrants had a significantly higher prevalence of loneliness (26.8%) than the Canadian-born population (22.2%). Women were significantly more likely to experience loneliness than men, among those born in Canada and several immigrant subgroups: European immigrants, immigrants who migrated as children (younger than 18 years), immigrants who migrated as adults (18 to 44 years of age), and long-term immigrants (Table 1).
| Characteristics | Men and women | Men | Women | ||||||
|---|---|---|---|---|---|---|---|---|---|
| % | 95% confidence interval | % | 95% confidence interval | % | 95% confidence interval | ||||
| from | to | from | to | from | to | ||||
| Overall | 19.2 | 18.4 | 20.0 | 14.6 | 13.5 | 15.7 | 23.0Table 1 Note ‡ | 21.9 | 24.2 |
| Immigrant origin | |||||||||
| European immigrants | 22.2Note * | 19.5 | 25.1 | 16.9 | 13.3 | 21.3 | 26.8Note * Table 1 Note ‡ | 23.1 | 30.9 |
| Non-European immigrants | 22.0Note * | 18.9 | 25.5 | 19.4Note * | 15.6 | 23.8 | 24.7 | 19.9 | 30.2 |
| Canadian-born populationTable 1 Note ‡‡ | 18.2 | 17.4 | 18.9 | 13.3 | 12.3 | 14.3 | 22.2Table 1 Note ‡ | 21.2 | 23.3 |
| Age at immigration | |||||||||
| Immigrants who arrived as children (younger than 18) | 21.7 | 17.7 | 26.3 | 16.7Note E: Use with caution | 11.3 | 23.9 | 25.9Table 1 Note ‡ | 20.1 | 32.6 |
| Immigrants who arrived as adults (18 to 44) | 23.1Note * | 20.3 | 26.1 | 19.2Note * | 15.9 | 23.0 | 26.9Note * Table 1 Note ‡ | 23.0 | 31.3 |
| Immigrants who arrived at older ages (45 or older) | 17.6Note E: Use with caution | 12.6 | 24.0 | 16.0Note E: Use with caution | 9.5 | 25.9 | 19.2Note E: Use with caution | 12.3 | 28.7 |
| Canadian-born populationTable 1 Note ‡‡ | 18.2 | 17.4 | 18.9 | 13.3 | 12.3 | 14.3 | 22.2Table 1 Note ‡ | 21.2 | 23.3 |
| Time since immigration | |||||||||
| Recent immigrants (0 to 9 years) | 26.1Note E: Use with caution | 12.7 | 46.2 | Note F: too unreliable to be published | Note ...: not applicable | Note ...: not applicable | Note F: too unreliable to be published | Note ...: not applicable | Note ...: not applicable |
| Medium-term immigrants (10 to 19 years) | 6.9Note * Note E: Use with caution | 3.6 | 12.8 | Note F: too unreliable to be published | Note ...: not applicable | Note ...: not applicable | Note F: too unreliable to be published | Note ...: not applicable | Note ...: not applicable |
| Long-term immigrants (20 years or more) | 22.6Note * | 20.3 | 25.0 | 18.4Note * | 15.6 | 21.6 | 26.6Note * Table 1 Note ‡ | 23.2 | 30.3 |
| Canadian-born populationTable 1 Note ‡‡ | 18.2 | 17.4 | 18.9 | 13.3 | 12.3 | 14.3 | 22.2Table 1 Note ‡ | 21.2 | 23.3 |
| Age group | |||||||||
| 65 to 74Table 1 Note ‡‡ | 19.0 | 18.0 | 20.1 | 14.7 | 13.3 | 16.1 | 23.0Table 1 Note ‡ | 21.5 | 24.5 |
| 75 to 84 | 18.3 | 16.9 | 19.9 | 13.2 | 11.3 | 15.2 | 22.6Table 1 Note ‡ | 20.6 | 24.8 |
| 85 or older | 22.7Note * | 20.3 | 25.4 | 19.1Note * | 15.2 | 23.7 | 24.8Table 1 Note ‡ | 21.7 | 28.3 |
| Marital status | |||||||||
| Married or common-law | 12.5Note * | 11.6 | 13.5 | 9.7Note * | 8.6 | 10.9 | 16.0Note * Table 1 Note ‡ | 14.6 | 17.6 |
| Widowed or widower | 30.9 | 29.0 | 32.8 | 33.4Note * | 29.5 | 37.6 | 30.2 | 28.1 | 32.4 |
| Separated or divorced | 31.7 | 29.4 | 34.2 | 31.1Note * | 27.3 | 35.1 | 32.1 | 29.2 | 35.3 |
| Single, never marriedTable 1 Note ‡‡ | 28.5 | 25.4 | 31.8 | 24.6 | 20.9 | 28.7 | 31.5Table 1 Note ‡ | 26.7 | 36.7 |
| Education | |||||||||
| Less than postsecondaryTable 1 Note ‡‡ | 19.3 | 18.2 | 20.4 | 14.7 | 13.1 | 16.4 | 22.4Table 1 Note ‡ | 20.9 | 23.9 |
| Postsecondary | 19.1 | 18.0 | 20.3 | 14.6 | 13.3 | 16.2 | 23.6Table 1 Note ‡ | 22.0 | 25.3 |
| Income quintile | |||||||||
| LowestTable 1 Note ‡‡ | 25.3 | 23.2 | 27.1 | 21.2 | 18.1 | 24.6 | 27.6Table 1 Note ‡ | 25.4 | 29.9 |
| Low-middle | 21.6Note * | 19.9 | 23.4 | 16.2Note * | 13.9 | 18.9 | 25.4Table 1 Note ‡ | 23.1 | 27.8 |
| Middle | 17.8Note * | 16.2 | 19.6 | 13.2Note * | 11.2 | 15.5 | 21.7Note * Table 1 Note ‡ | 19.4 | 24.2 |
| High-middle | 16.0Note * | 14.5 | 17.7 | 14.0Note * | 11.9 | 16.4 | 18.2Note * Table 1 Note ‡ | 16.0 | 20.6 |
| Highest | 15.3Note * | 13.6 | 17.2 | 10.3Note * | 8.5 | 12.3 | 21.0Note * Table 1 Note ‡ | 18.1 | 24.2 |
| Living with multimorbidity | |||||||||
| Yes | 21.6Note * | 20.6 | 22.6 | 16.1Note * | 14.8 | 17.5 | 25.8Note * Table 1 Note ‡ | 24.5 | 27.2 |
| NoTable 1 Note ‡‡ | 13.1 | 11.9 | 14.5 | 11.2 | 9.6 | 13.1 | 15.1Table 1 Note ‡ | 13.2 | 17.1 |
| Social participation barrier | |||||||||
| Yes | 38.0Note * | 35.9 | 40.3 | 29.9Note * | 26.7 | 33.3 | 43.1Note * Table 1 Note ‡ | 40.4 | 45.8 |
| NoTable 1 Note ‡‡ | 13.4 | 12.6 | 14.2 | 10.8 | 9.8 | 11.8 | 15.8Table 1 Note ‡ | 14.8 | 16.9 |
| Population centre | |||||||||
| Rural (fewer than 1,000)Table 1 Note ‡‡ | 16.5 | 15.5 | 17.6 | 13.3 | 11.9 | 14.9 | 19.7Table 1 Note ‡ | 18.1 | 21.3 |
| Small (1,000 to 29,999) | 17.4 | 16.1 | 18.8 | 12.8 | 11.2 | 14.7 | 21.1Table 1 Note ‡ | 19.3 | 22.9 |
| Medium (30,000 to 99,999) | 17.9 | 16.2 | 19.7 | 11.2 | 9.3 | 13.3 | 22.9Note * Table 1 Note ‡ | 20.5 | 25.5 |
| Large (100,000 or more) | 20.9Note * | 19.6 | 22.2 | 16.0Note * | 14.4 | 18.0 | 24.8Note * Table 1 Note ‡ | 23.0 | 26.8 |
| Timing of the survey | |||||||||
| Before COVID-19 restrictions | 17.6 | 16.6 | 18.5 | 13.8 | 12.6 | 15.2 | 20.7Table 1 Note ‡ | 19.4 | 22.0 |
| During COVID-19 pandemic | 21.7Note * | 20.3 | 23.2 | 15.8 | 14.0 | 17.7 | 26.8Note * Table 1 Note ‡ | 24.8 | 29.0 |
|
... not applicable E use with caution F too unreliable to be published
Note: Based on available case analysis (unequal sample size across the predictors). Source: The 2019/2020 Canadian Health Survey on Seniors. |
|||||||||
Differences between men and women in the proportion responding “some of the time” or “always” to all three questions on the loneliness scale were similar among the total study population, as shown in Figure 1. In addition, within all three categories of immigrant origin, women were significantly more likely than men to report each of the responses above, with only one exception among non-European immigrants who reported feeling left out (Figure 1). Similarly, among both immigrants who migrated as adults and long-term immigrants, women had significantly higher rates of reporting each of the responses above (appendices B and C).
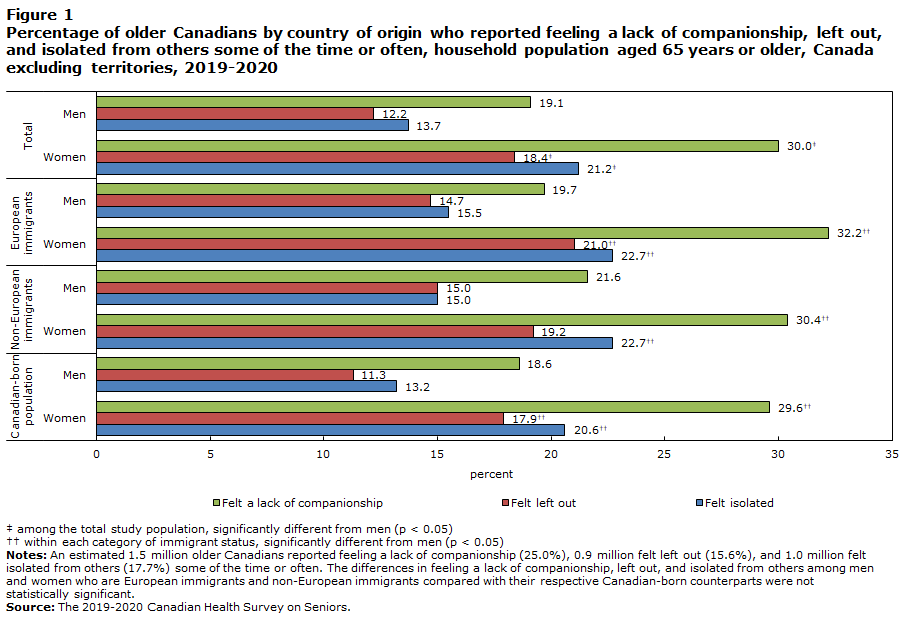
Description of Figure 1
| Loneliness items | ||||||||
|---|---|---|---|---|---|---|---|---|
| Women | Men | Women | Men | Women | Men | Women | Men | |
| percent | ||||||||
| Felt isolated | 20.6Data table for figure 1 Note †† | 13.2 | 22.7Data table for figure 1 Note †† | 15.0 | 22.7Data table for figure 1 Note †† | 15.5 | 21.2Data table for figure 1 Note ‡ | 13.7 |
| Felt left out | 17.9Data table for figure 1 Note †† | 11.3 | 19.2 | 15.0 | 21.0Data table for figure 1 Note †† | 14.7 | 18.4Data table for figure 1 Note ‡ | 12.2 |
| Felt a lack of companionship | 29.6Data table for figure 1 Note †† | 18.6 | 30.4Data table for figure 1 Note †† | 21.6 | 32.2Data table for figure 1 Note †† | 19.7 | 30.0Data table for figure 1 Note ‡ | 19.1 |
Source: The 2019-2020 Canadian Health Survey on Seniors. |
||||||||
Several other covariates were significantly associated with loneliness. Among the total study population, people aged 85 or older were significantly more likely to be lonely (22.7%) than those aged 65 to 74 years (19.0%). However, men—but not women—in the oldest age group were more likely to be lonely than those in the youngest age group. Both men and women who were married or common-law were less likely to be lonely than those who were single or never married. Multimorbidity and barriers to social participation were significantly associated with loneliness among both men and women. Women were also more likely to be lonely during the COVID-19 pandemic (26.8%), compared with before COVID-19 restrictions were put in place (20.7%) (Table 1).
Multivariable findings
Immigrant origin and loneliness
Among the total study population, both European and non-European immigrants were found to have higher odds of loneliness (1.3 and 1.5, respectively) than the Canadian-born population, even after accounting for demographic and socioeconomic characteristics, health status, and timing of the survey. Women had 1.2 times higher odds of experiencing loneliness (95% CI: 1.1-1.4) than men (Table 2).
| Characteristics | Men and women | Men | Women | ||||||
|---|---|---|---|---|---|---|---|---|---|
| Adjusted odds ratios | 95% confidence interval | Adjusted odds ratios | 95% confidence interval | Adjusted odds ratios | 95% confidence interval | ||||
| from | to | from | to | from | to | ||||
| Immigrant origin | |||||||||
| European immigrants | 1.3Note * | 1.1 | 1.6 | 1.4Note * | 1.0 | 1.9 | 1.3Note * | 1.0 | 1.6 |
| Non-European immigrants | 1.5Note * | 1.2 | 1.8 | 1.9Note * | 1.4 | 2.7 | 1.2 | 0.9 | 1.6 |
| Canadian-born populationTable 2 Note ‡‡ | 1.0 | Note ...: not applicable | Note ...: not applicable | 1.0 | Note ...: not applicable | Note ...: not applicable | 1.0 | Note ...: not applicable | Note ...: not applicable |
| Gender | |||||||||
| MenTable 2 Note ‡‡ | 1.0 | Note ...: not applicable | Note ...: not applicable | Note ...: not applicable | Note ...: not applicable | Note ...: not applicable | Note ...: not applicable | Note ...: not applicable | Note ...: not applicable |
| Women | 1.2Note * | 1.1 | 1.4 | Note ...: not applicable | Note ...: not applicable | Note ...: not applicable | Note ...: not applicable | Note ...: not applicable | Note ...: not applicable |
| Age group | |||||||||
| 65 to 74Table 2 Note ‡‡ | 1.0 | Note ...: not applicable | Note ...: not applicable | 1.0 | Note ...: not applicable | Note ...: not applicable | 1.0 | Note ...: not applicable | Note ...: not applicable |
| 75 to 84 | 0.8Note * | 0.7 | 0.9 | 0.9 | 0.7 | 1.1 | 0.8Note * | 0.6 | 0.9 |
| 85 or older | 0.8Note * | 0.7 | 1.0 | 1.0 | 0.7 | 1.5 | 0.7Note * | 0.6 | 0.9 |
| Marital status | |||||||||
| Married or common-law | 0.4Note * | 0.3 | 0.5 | 0.3Note * | 0.2 | 0.4 | 0.4Note * | 0.3 | 0.5 |
| Widowed or widower | 1.1 | 0.9 | 1.4 | 1.5Note * | 1.1 | 2.2 | 1.1 | 0.8 | 1.4 |
| Separated or divorced | 1.1 | 0.9 | 1.3 | 1.2 | 0.9 | 1.6 | 1.0 | 0.7 | 1.2 |
| Single, never marriedTable 2 Note ‡‡ | 1.0 | Note ...: not applicable | Note ...: not applicable | 1.0 | Note ...: not applicable | Note ...: not applicable | 1.0 | Note ...: not applicable | Note ...: not applicable |
| Education | |||||||||
| Less than postsecondaryTable 2 Note ‡‡ | 1.0 | Note ...: not applicable | Note ...: not applicable | 1.0 | Note ...: not applicable | Note ...: not applicable | 1.0 | Note ...: not applicable | Note ...: not applicable |
| Postsecondary | 1.0 | 0.9 | 1.2 | 1.0 | 0.8 | 1.3 | 1.0 | 0.9 | 1.2 |
| Income quintile | |||||||||
| LowestTable 2 Note ‡‡ | 1.0 | Note ...: not applicable | Note ...: not applicable | 1.0 | Note ...: not applicable | Note ...: not applicable | 1.0 | Note ...: not applicable | Note ...: not applicable |
| Low-middle | 1.0 | 0.9 | 1.2 | 1.0 | 0.7 | 1.3 | 1.0 | 0.9 | 1.2 |
| Middle | 0.9 | 0.7 | 1.1 | 0.9 | 0.7 | 1.2 | 0.9 | 0.7 | 1.1 |
| High-middle | 0.8Note * | 0.7 | 1.0 | 1.0 | 0.7 | 1.3 | 0.7Note * | 0.6 | 0.9 |
| Highest | 0.8Note * | 0.7 | 1.0 | 0.7Note * | 0.5 | 1.0 | 0.9 | 0.7 | 1.2 |
| Living with multimorbidity | |||||||||
| Yes | 1.6Note * | 1.4 | 1.9 | 1.5Note * | 1.2 | 1.8 | 1.8Note * | 1.5 | 2.2 |
| NoTable 2 Note ‡‡ | 1.0 | Note ...: not applicable | Note ...: not applicable | 1.0 | Note ...: not applicable | Note ...: not applicable | 1.0 | Note ...: not applicable | Note ...: not applicable |
| Social participation barrier | |||||||||
| Yes | 3.8Note * | 3.4 | 4.3 | 3.6Note * | 2.9 | 4.5 | 3.9Note * | 3.4 | 4.5 |
| NoTable 2 Note ‡‡ | 1.0 | Note ...: not applicable | Note ...: not applicable | 1.0 | Note ...: not applicable | Note ...: not applicable | 1.0 | Note ...: not applicable | Note ...: not applicable |
| Population centre | |||||||||
| Rural (fewer than 1,000)Table 2 Note ‡‡ | 1.0 | Note ...: not applicable | Note ...: not applicable | 1.0 | Note ...: not applicable | Note ...: not applicable | 1.0 | Note ...: not applicable | Note ...: not applicable |
| Small (1,000 to 29,999) | 0.9 | 0.8 | 1.1 | 0.9 | 0.7 | 1.1 | 1.0 | 0.8 | 1.2 |
| Medium (30,000 to 99,999) | 0.9 | 0.7 | 1.0 | 0.7Note * | 0.5 | 0.9 | 1.0 | 0.8 | 1.2 |
| Large (100,000 or more) | 1.0 | 0.9 | 1.2 | 1.0 | 0.8 | 1.2 | 1.1 | 0.9 | 1.3 |
| Timing of the survey | |||||||||
| Before COVID-19 restrictionsTable 2 Note ‡‡ | 1.0 | Note ...: not applicable | Note ...: not applicable | 1.0 | Note ...: not applicable | Note ...: not applicable | 1.0 | Note ...: not applicable | Note ...: not applicable |
| During COVID-19 pandemic | 1.2Note * | 1.0 | 1.3 | 1.1 | 0.9 | 1.3 | 1.2Note * | 1.0 | 1.4 |
... not applicable
Source: The 2019/2020 Canadian Health Survey on Seniors. |
|||||||||
Gender-specific analysis revealed that among men, both European immigrants and non-European immigrants had higher odds of reporting loneliness (1.4 and 1.9 respectively) than those born in Canada. Among women, European immigrants had 1.3 times higher odds of reporting loneliness than the Canadian-born population (95% CI: 1.0-1.6) in fully adjusted models.
Age at immigration and loneliness
Among the total study population, immigrants who migrated as adults had 1.6 times higher odds of experiencing loneliness (95% CI: 1.3-1.9) than the Canadian-born population, after adjusting for the other factors that influence loneliness. For both men and women, immigrants who migrated as adults were at higher risk of experiencing loneliness than their respective Canadian-born peers (Table 3).
| Characteristics | Men and women | Men | Women | ||||||
|---|---|---|---|---|---|---|---|---|---|
| Adjusted odds ratios |
95% confidence interval | Adjusted odds ratios |
95% confidence interval | Adjusted odds ratios |
95% confidence interval | ||||
| from | to | from | to | from | to | ||||
| Age at immigration | |||||||||
| Immigrants who arrived as children (younger than 18) | 1.3 | 1.0 | 1.6 | 1.4 | 0.8 | 2.3 | 1.2 | 0.9 | 1.6 |
| Immigrants who arrived as adults (18 to 44) | 1.6Note * | 1.3 | 1.9 | 1.8Note * | 1.3 | 2.3 | 1.4Note * | 1.1 | 1.8 |
| Immigrants who arrived at older ages (45 or older) | 1.0 | 0.6 | 1.6 | 1.5 | 0.7 | 3.2 | 0.7 | 0.4 | 1.3 |
| Canadian-born populationTable 3 Note ‡‡ | 1.0 | Note ...: not applicable | Note ...: not applicable | 1.0 | Note ...: not applicable | Note ...: not applicable | 1.0 | Note ...: not applicable | Note ...: not applicable |
| Gender | |||||||||
| MenTable 3 Note ‡‡ | 1.0 | Note ...: not applicable | Note ...: not applicable | Note ...: not applicable | Note ...: not applicable | Note ...: not applicable | Note ...: not applicable | Note ...: not applicable | Note ...: not applicable |
| Women | 1.2Note * | 1.1 | 1.4 | Note ...: not applicable | Note ...: not applicable | Note ...: not applicable | Note ...: not applicable | Note ...: not applicable | Note ...: not applicable |
... not applicable
Note: All models are also adjusted for respondents' age, marital status, education, household income quintile, multimorbidity, social participation barrier, population centre, and timing of the survey; findings on these covariates are identical to those in Table 2. Source: The 2019/2020 Canadian Health Survey on Seniors. |
|||||||||
Time since immigration and loneliness
Among the total study population, medium-term immigrants had 0.3 times lower odds of experiencing loneliness (95% CI: 0.2-0.7) than those born in Canada. By contrast, long-term immigrants had 1.4 times higher odds of loneliness (95% CI: 1.2-1.7) than the Canadian-born population. The lower odds of experiencing loneliness among medium-term immigrants than those born in Canada was significant for women, but not for men. By contrast, the higher risk of experiencing loneliness among long-term immigrants was significant for both men and women, in relation to their respective Canadian-born counterparts (Table 4).
| Characteristics | Men and women | Men | Women | ||||||
|---|---|---|---|---|---|---|---|---|---|
| Adjusted odds ratios | 95% confidence interval | Adjusted odds ratios | 95% confidence interval | Adjusted odds ratios | 95% confidence interval | ||||
| from | to | from | to | from | to | ||||
| Time since immigration | |||||||||
| Recent immigrants (0 to 9 years) | 1.8 | 0.5 | 6.1 | 5.1 | 0.8 | 34.0 | 0.9 | 0.2 | 3.4 |
| Medium-term immigrants (10 to 19 years) | 0.3Note * | 0.2 | 0.7 | 0.5 | 0.2 | 1.4 | 0.2Note * | 0.1 | 0.7 |
| Long-term immigrants (20 years or more) | 1.4Note * | 1.2 | 1.7 | 1.6Note * | 1.3 | 2.1 | 1.3Note * | 1.1 | 1.6 |
| Canadian-born populationTable 4 Note ‡‡ | 1.0 | Note ...: not applicable | Note ...: not applicable | 1.0 | Note ...: not applicable | Note ...: not applicable | 1.0 | Note ...: not applicable | Note ...: not applicable |
| Gender | |||||||||
| MenTable 4 Note ‡‡ | 1.0 | Note ...: not applicable | Note ...: not applicable | Note ...: not applicable | Note ...: not applicable | Note ...: not applicable | Note ...: not applicable | Note ...: not applicable | Note ...: not applicable |
| Women | 1.2Note * | 1.1 | 1.4 | Note ...: not applicable | Note ...: not applicable | Note ...: not applicable | Note ...: not applicable | Note ...: not applicable | Note ...: not applicable |
... not applicable
Note: All models are also adjusted for respondents' age, marital status, education, household income quintile, multimorbidity, social participation barrier, population centre, and timing of the survey; findings on these covariates are identical to those in Table 2. Source: The 2019/2020 Canadian Health Survey on Seniors. |
|||||||||
Multivariable findings on covariates
Among the total study population, in contrast to the bivariate finding, older age cohorts (75 to 84 years, and 85 years and older) were less likely to report loneliness than those aged 65 to 74 years when the control covariates were taken into account. In gender-specific analysis, the lower likelihood of loneliness among the older age cohorts was significant only among women. Both men and women who were married or living common-law were less susceptible to loneliness than those who were single or never married. By contrast, widowed men were at a higher risk of loneliness than men who were single or never married (Table 2).
Overall, the chances of experiencing loneliness were higher for people who were living with multimorbidity or experiencing barriers to social participation—among both men and women. Finally, women were at higher risk of being lonely during the COVID-19 pandemic (September to December 2020) than before COVID-19 restrictions were put in place (January 2019 to March 2020). The multivariable findings on the covariates in tables 3 and 4 (not shown) were also similar to those in Table 2.
Discussion
According to the 2019/2020 CHSS, an estimated 1.1 million older Canadians (19.2%) experienced loneliness. This is consistent with a previous study that used a similar scale for measuring loneliness among older Canadians.Note 33 Among demographic, socioeconomic and health factors considered in relation to loneliness, this study was particularly focused on differences by immigrant subgroups and gender.
Recognizing that immigrants are not a homogeneous group, they were categorized based on country of birth, age at immigration, and time since immigration, and examined in separate models. This study detected a significantly higher risk of loneliness for both men and women among European immigrants, and for men among non-European immigrants, and for both men and women who migrated as adults or were long-term immigrants. The higher risk of loneliness among immigrants compared with the Canadian-born population found in this study is consistent with previous research.Note 10, Note 21
Some factors not examined in this study that could explain the greater risk of loneliness among immigrants include dissatisfaction with frequency of communication with relatives and friends, poor sense of belonging to local community, and fewer number of friends with the same mother tongue.Note 10 Additionally, lower levels of social support among immigrants may lead to higher levels of loneliness, compared with the Canadian-born population.Note 33, Note 36 Immigrants are more susceptible to lower levels of social support because of disruptions in their social network and the challenges of establishing friendships in a new country.Note 10, Note 37 Moreover, feelings of perceived discrimination because of being an immigrant or ethnic minority,Note 38 a higher risk of experiencing poor mental health,Note 39 and lower life satisfactionNote 24, Note 40 than the host-country population may be potential contributing factors.
This study aimed to provide additional insight into gender differences in the association between immigrant subgroups and loneliness in Canada. In multivariable analysis, the difference in loneliness between non-European immigrants and the Canadian-born population was not significant for women. The association approached significance and it is possible that sample size limited statistical power. Alternatively, this may be related to the strong sense of filial responsibility among non-European immigrants, in particular among Asians. Filial piety (respect for one’s elders) is a common value among Asian immigrants, who see caring for parents as a norm.Note 41, Note 42 Because of this, it could be that the greater care and support received from children makes older non-European immigrant women less vulnerable to loneliness. More than half of the non-European immigrants (55.6%) among older Canadians were Asian immigrants.
The finding on higher risk of loneliness among immigrants who migrated to Canada as adults, compared with the Canadian born resonates with the life course theory, which suggests that the same transition can have a different impact on health and well-being, depending on when it happens in an individual’s life stages. For example, migrating to another country during adulthood (ages 18 to 44 years) may be more stressful than migrating during childhood (0 to 17 years) or during mid- to later life (45 years and older). The cumulative impact of the stress associated with moving to a new country, getting established in the labour market, developing a social network, and overcoming language and cultural barriers in the host country may trigger higher levels of loneliness among immigrants who migrated as adults. By contrast, immigrants who migrate as children obtain their education in the host country while living with their families and are in a better position to develop their social networks, which may make them less susceptible to loneliness in later life. Similarly, immigrants who migrated at older ages (45 years or older) may also be less vulnerable to loneliness if they migrated under the family reunification category, which may work as a buffer against loneliness in later life.Note 43
The lower likelihood of loneliness among medium-term immigrants and higher likelihood of loneliness among long-term immigrants, compared with the Canadian-born population, echoes the hypothesis of healthy immigrant effects, which indicates that immigrants possess better physical and mental health than the host country population at the time of immigration, but their health advantage starts to dissipate with increasing duration of residence in the host country.Note 44, Note 45 The differences in loneliness among immigrant subgroups in relation to those born in Canada may be related to other factors not included in the model, such as language ability, source countries and race. In accordance with the findings of this study, Wu and PenningNote 21 also detected a non-linear effect of years of residence in Canada on loneliness among immigrants: there was a negative association with shorter length of residence and a positive association with longer residence.
Loneliness was more prevalent among women than men, which is consistent with most previous studies,Note 46, Note 47, Note 48 though not all of them.Note 17,Note 49, Note 50 According to the life-course perspective, the higher risk of loneliness among women in later life may also be attributed to the cumulative effect of life trajectories, including occurrence and timing of family transitions (e.g., entering into partnership and parenthood, marital stability)Note 51, Note 52, Note 53 and early-to-midlife adversities, such as lack of adequate social relations and economic hardship,Note 54, Note 55 and burden of taking care of a spouse with disability.Note 56
The association of loneliness with multimorbidity is also well documented in the literature—for both men and women.Note 57, Note 58, Note 59 Stickley and KoyanagiNote 58 detected that the loneliness-multimorbidity association was significantly mediated by stressful life events, anxiety, and depression. In addition, presence of some chronic conditions (e.g., urinary incontinence) may also work as a barrier to greater social participation, which in turn could lead to increased loneliness among older adults.Note 14
In line with previous research,Note 11, Note 21, Note 33, Note 60 this study also observed a higher risk of loneliness among older Canadians associated with barriers to social participation—for both men and women. Gilmour,Note 33 for example, noticed that frequent participation in social activities was associated with lower prevalence of loneliness among older Canadians. In that study, barriers to participation in social activities included health condition, personal and family responsibilities, lack of company, cost, unavailability of activities in the area, and transportation problems.
Finally, the higher risk of loneliness among women during the first year of the COVID-19 pandemic, compared with before COVID-19 restrictions were put in place, aligns with the growing evidence of gender differences in loneliness during the pandemic.Note 15, Note 31 The greater risk of experiencing loneliness among women during the pandemic may also be related to their higher concern about the pandemic,Note 15 increased burden of caregiving roles,Note 61 and greater adherence to physical distancing restrictions.Note 62
Strengths and limitations
This study has a number of strengths, including the use of a nationally representative and recent Canadian data source with a large sample of older Canadians, allowing for the inclusion of a wide range of covariates. Analysis of country of birth, age at immigration, and time since immigration provided additional insight into variations in loneliness among immigrant subgroups, compared with the Canadian-born population. Analyses were conducted separately for men and women to better illuminate how factors associated with loneliness among the immigrant subgroups differ by gender. This study provides new evidence of the impacts of COVID-19 on loneliness among older Canadians. Interaction effect between immigrant status and timing of the survey on loneliness was tested in the analysis, but no significant difference was found.
Nonetheless, this study has some limitations. First, the 2019/2020 CHSS excludes information on older Canadians living in institutional settings, such as long-term care and nursing homes, who may be more likely to experience loneliness. Second, data collection for the 2020 CHSS was interrupted because of the COVID-19 pandemic, and the inability to conduct in-person interviews during the pandemic resulted in lower response rates. Survey weights were used in the analyses to minimize any potential bias that could arise because of low response rates. Yet, the increase in non-response rates could impact estimates (e.g., increase in the total variance) produced using the survey data.Note 63 Third, despite the sizable sample, further disaggregated analysis of loneliness among immigrant subgroups by age and gender was not possible. Similarly, breakdowns by population groups of interest, such as sexual orientation or gender diverse, was not possible. Fourth, data on type of immigrant (economic immigrants, family immigrants or refugees) were not available. Finally, additional categorization of immigrants into those from countries with similar culture or language to Canada (e.g., the United Kingdom, Ireland, France, the United States, Australia, New Zealand) was not possible because of the relatively small number of respondents from each country. The variable on language skills was not included in the analysis because of inadequate sample size in some categories, such as those proficient in neither English nor French. Living arrangement was not included in the analysis because of higher correlation with marital status.
Conclusion
According to the 2019/2020 CHSS, about one in five older Canadians experienced loneliness, with women more likely to than men. Immigrants in particular, were more likely to experience loneliness than Canadian-born individuals, with substantial variations in the risk of loneliness by immigrant status. Understanding which groups of older Canadians are at the greatest risk of loneliness can inform programs aimed at reducing the negative health consequences of loneliness. The findings of this study highlight the importance of considering country of origin, age at immigration, time since immigration and gender in assessing loneliness among older Canadians. In addition, those with multimorbidity and barriers to social participation had greater risk of loneliness, suggesting areas to target interventions.
| Characteristics | Men and women | Men | Women | |||||||||
|---|---|---|---|---|---|---|---|---|---|---|---|---|
| Number ('000) | % | 95% confidence interval | Number ('000) | % | 95% confidence interval | Number ('000) | % | 95% confidence interval | ||||
| from | to | from | to | from | to | |||||||
| Immigrant origin | ||||||||||||
| European immigrants | 753 | 12.8 | 12.1 | 13.6 | 352 | 13.1 | 12.0 | 14.2 | 401 | 12.6 | 11.7 | 13.6 |
| Non-European immigrants | 757 | 12.9 | 11.9 | 13.9 | 380 | 14.1 | 12.7 | 15.6 | 377 | 11.9Appendix A Note ‡ | 10.6 | 13.2 |
| Canadian-born population | 4,366 | 74.3 | 73.2 | 75.4 | 1,963 | 72.8 | 71.3 | 74.4 | 2,403 | 75.5Appendix A Note ‡ | 74.1 | 76.9 |
| Age at immigration | ||||||||||||
| Immigrants who arrived as children (younger than 18) | 307 | 5.2 | 4.8 | 5.8 | 141 | 5.3 | 4.5 | 6.1 | 166 | 5.3 | 4.6 | 6.0 |
| Immigrants who arrived as adults (18 to 44) | 932 | 16.0 | 15.2 | 16.9 | 462 | 17.3 | 16.0 | 18.6 | 470 | 15.0Appendix A Note ‡ | 13.8 | 16.2 |
| Immigrants who arrived at older ages (45 or older) | 216 | 3.7 | 3.2 | 4.3 | 111 | 4.1 | 3.4 | 5.0 | 106 | 3.4 | 2.6 | 4.2 |
| Canadian-born population | 4,366 | 75.0 | 73.9 | 76.1 | 1,963 | 73.3 | 71.8 | 74.9 | 2,403 | 76.4Appendix A Note ‡ | 75.0 | 77.8 |
| Time since immigration | ||||||||||||
| Recent immigrants (0 to 9 years) | 49 | 0.8Note E: Use with caution | 0.6 | 1.2 | 23 | 0.9Note E: Use with caution | 0.5 | 1.4 | 26 | 0.8Appendix A Note ‡ | 0.5 | 1.4 |
| Medium-term immigrants (10 to 19 years) | 68 | 1.2 | 0.9 | 1.6 | 39 | 1.5Note E: Use with caution | 1.0 | 2.2 | 29 | 0.9Appendix A Note ‡ | 0.6 | 1.4 |
| Long-term immigrants (20 years or more) | 1,339 | 23.0 | 22.0 | 24.0 | 651 | 24.3 | 22.9 | 25.9 | 687 | 21.8Appendix A Note ‡ | 20.5 | 23.2 |
| Canadian-born population | 4,366 | 75.0 | 73.9 | 76.1 | 1,963 | 73.3 | 71.8 | 74.9 | 2,403 | 76.4Appendix A Note ‡ | 75.0 | 77.8 |
| Age group | ||||||||||||
| 65 to 74 | 3,622 | 61.5 | 61.0 | 61.9 | 1,728 | 64.0 | 63.4 | 64.5 | 1,894 | 59.4Appendix A Note ‡ | 58.8 | 59.9 |
| 75 to 84 | 1,719 | 29.2 | 28.9 | 29.5 | 772 | 28.6 | 28.1 | 29.1 | 947 | 29.7Appendix A Note ‡ | 29.2 | 30.2 |
| 85 or older | 550 | 9.3 | 9.0 | 9.7 | 201 | 7.4 | 7.0 | 7.9 | 349 | 10.9Appendix A Note ‡ | 10.5 | 11.4 |
| Marital status | ||||||||||||
| Married or common-law | 3,744 | 63.6 | 62.7 | 64.5 | 2,054 | 76.1 | 75.0 | 77.2 | 1,690 | 53.0Appendix A Note ‡ | 51.7 | 54.4 |
| Widowed or widower | 1,070 | 18.2 | 17.5 | 18.9 | 216 | 8.0 | 7.3 | 8.7 | 854 | 26.8Appendix A Note ‡ | 25.8 | 27.8 |
| Separated or divorced | 658 | 11.2 | 10.6 | 11.7 | 248 | 9.2 | 8.5 | 9.9 | 410 | 12.9Appendix A Note ‡ | 12.1 | 13.6 |
| Single, never married | 414 | 7.0 | 6.5 | 7.6 | 181 | 6.7 | 6.1 | 7.3 | 233 | 7.3 | 6.6 | 8.1 |
| Education | ||||||||||||
| Less than postsecondary | 2,482 | 43.0 | 42.0 | 44.0 | 999 | 37.7 | 36.3 | 39.2 | 1,483 | 47.4Appendix A Note ‡ | 46.2 | 48.7 |
| Postsecondary | 3,292 | 57.0 | 56.0 | 58.0 | 1,648 | 62.3 | 60.8 | 63.7 | 1,644 | 52.6Appendix A Note ‡ | 51.3 | 53.8 |
| Income quintile | ||||||||||||
| Lowest | 1,170 | 19.9 | 19.1 | 20.7 | 451 | 16.7 | 15.5 | 17.9 | 719 | 22.6Appendix A Note ‡ | 21.5 | 23.6 |
| Low-middle | 1,164 | 19.8 | 19.0 | 20.5 | 477 | 17.7 | 16.6 | 18.7 | 687 | 21.5Appendix A Note ‡ | 20.5 | 22.6 |
| Middle | 1,170 | 19.9 | 19.1 | 20.7 | 527 | 19.5 | 18.4 | 20.6 | 643 | 20.2Appendix A Note ‡ | 19.1 | 21.3 |
| High-middle | 1,198 | 20.3 | 19.5 | 21.1 | 620 | 23.0 | 21.7 | 24.2 | 578 | 18.1Appendix A Note ‡ | 17.1 | 19.1 |
| Highest | 1,189 | 20.2 | 19.3 | 21.1 | 626 | 23.2 | 21.9 | 24.5 | 563 | 17.6Appendix A Note ‡ | 16.6 | 18.7 |
| Living with multimorbidity | ||||||||||||
| Yes | 4,202 | 71.3 | 70.4 | 72.2 | 1,839 | 68.1 | 66.6 | 69.6 | 2,363 | 74.1Appendix A Note ‡ | 72.9 | 75.2 |
| No | 1,688 | 28.7 | 27.8 | 29.6 | 861 | 31.9 | 30.4 | 33.4 | 827 | 25.9Appendix A Note ‡ | 24.8 | 27.1 |
| Social participation barrier | ||||||||||||
| Yes | 1,368 | 23.3 | 22.4 | 24.2 | 523 | 19.4 | 18.2 | 20.7 | 845 | 26.6Appendix A Note ‡ | 25.4 | 27.8 |
| No | 4,506 | 76.7 | 75.8 | 77.6 | 2,171 | 80.6 | 79.3 | 81.8 | 2,335 | 73.4Appendix A Note ‡ | 72.2 | 74.6 |
| Population centre | ||||||||||||
| Rural (fewer than 1,000) | 1,230 | 20.9 | 20.1 | 21.7 | 605 | 22.4 | 21.3 | 23.6 | 625 | 19.6Appendix A Note ‡ | 18.7 | 20.6 |
| Small (1,000 to 29,999) | 843 | 14.3 | 13.6 | 15.1 | 371 | 13.7 | 12.8 | 14.7 | 472 | 14.8 | 13.9 | 15.7 |
| Medium (30,000 to 99,999) | 604 | 10.2 | 9.6 | 11.0 | 259 | 9.6 | 8.7 | 10.5 | 345 | 10.8Appendix A Note ‡ | 10.0 | 11.7 |
| Large (100,000 or more) | 3,214 | 54.6 | 53.5 | 55.6 | 1,466 | 54.3 | 52.8 | 55.8 | 1,748 | 54.8 | 53.5 | 56.1 |
| Timing of the survey | ||||||||||||
| Before COVID-19 restrictions | 3,631 | 61.6 | 61.3 | 62.0 | 1,663 | 61.6 | 60.7 | 62.4 | 1,968 | 61.7 | 61.0 | 62.4 |
| During COVID-19 pandemic | 2,260 | 38.4 | 38.0 | 38.7 | 1,038 | 38.4 | 37.6 | 39.3 | 1,222 | 38.3 | 37.6 | 39.0 |
E use with caution
Source: The 2019/2020 Canadian Health Survey on Seniors. |
||||||||||||

Description of Appendix B
| Loneliness items | ||||||||
|---|---|---|---|---|---|---|---|---|
| Women | Men | Women | Men | Women | Men | Women | Men | |
| percent | ||||||||
| Felt isolated | 20.6Data table for appendix B Note ‡ | 13.2 | 17.0Note E: Use with caution | 14.5Note E: Use with caution | 24.0Data table for appendix B Note ‡ | 15.5 | 22.3 | 14.6 |
| Felt left out | 17.9Data table for appendix B Note ‡ | 11.3 | 17.8Note E: Use with caution | 14.8Note E: Use with caution | 20.1Data table for appendix B Note ‡ | 15.3Data table for appendix B Note †† | 21.2 | 13.3 |
| Felt a lack of companionship | 29.6Data table for appendix B Note ‡ | 18.6 | 30.7Data table for appendix B Note E‡Data table for appendix B Note E‡ | 18.5Note E: Use with caution | 32.5Data table for appendix B Note ‡ | 22.1 | 27.4 | 17.9 |
E use with caution
|
||||||||

Description of Appendix C
| Loneliness items | ||||
|---|---|---|---|---|
| Women | Men | Women | Men | |
| percent | ||||
| Felt isolated | 20.6Data table for appendix C Note ‡ | 13.2 | 23.7Data table for appendix C Note ‡ | 15.0 |
| Felt left out | 17.9Data table for appendix C Note ‡ | 11.3 | 20.6Data table for appendix C Note ‡ | 14.8Data table for appendix C Note †† |
| Felt a lack of companionship | 29.6Data table for appendix C Note ‡ | 18.6 | 31.7Data table for appendix C Note ‡ | 21.4 |
|
||||
- Date modified: