
Health Reports
Five-year cancer survival by stage at diagnosis in Canada

DOI: https://www.doi.org/10.25318/82-003-x202300100001-eng
Abstract
Background
Cancer survival estimates provide insights into the effectiveness of early detection and treatment. The stage of cancer at diagnosis is an important determinant of survival, reflecting the extent and spread at the time of disease detection. This work provides stage-specific, five-year survival results not previously available for Canada.
Data and methods
Data reflect the population-based Canadian Cancer Registry death-linked analytic file covering the period from 2010 to 2017. The stage at diagnosis was determined by the Collaborative Stage Data Collection System. Five-year net survival (NS) estimates for Canada excluding Quebec were derived using the Pohar Perme estimator for the five most commonly diagnosed cancers.
Results
Except for prostate cancer, NS decreased monotonically with increased stage at diagnosis. For example, female breast cancer NS estimates were 100% (stage I), 92% (stage II), 74% (stage III) and 23% (stage IV). Apart from lung cancer, stage I NS exceeded 90% for all cancers studied. The largest sex-specific difference in NS was for lung cancer stage I (female 66%; male 56%). Stage-specific NS generally decreased with age, particularly for early-stage lung cancer. Between the 2010-to-2012 and 2015-to-2017 periods, NS improved among stage IV prostate, female breast and lung cancer cases, as well as for stage I and III lung cancer cases; however, it did not improve at any stage for colon or rectal cancer cases.
Interpretation
The work highlights the importance of detecting cancer early, when treatment is most effective. It demonstrates some progress in stage-specific survival among top cancers in Canada and offers data to inform health policy, including screening, and clinical decisions regarding cancer treatment.
Keywords
malignant neoplasms; population surveillance; registries; stage; survival analysis
Authors
Larry F. Ellison (larry.ellison@canada.ca) is with the Centre for Population Health Data at Statistics Canada, Ottawa, Ontario. Nathalie Saint-Jacques (nathalie.st-jacques@nshealth.ca) is with the Nova Scotia Health Cancer Care Program and the Department of Medicine at Dalhousie University, Halifax, Nova Scotia.
What is already known on this subject?
- The stage of cancer at diagnosis is an important determinant of survival, reflecting the extent and spread at the time of disease detection.
- The staging of cancer cases is important at the population level because it helps health professionals evaluate the effectiveness of early detection. At the individual level, it guides clinical decisions regarding the most appropriate course of treatment.
- Five-year net survival (NS) estimates by stage at diagnosis were not previously available for Canada overall.
What does this study add?
- This study fills an important gap in providing Canadian, stage-specific, five-year NS estimates for the most commonly diagnosed cancers. It showcases the stage at diagnosis as a key predictor of prognosis and highlights the importance of detecting cancer at an early stage, when treatment is most effective.
- Apart from lung cancer, stage I five-year NS exceeded 90% for all cancers studied.
- Stage-specific, five-year NS generally decreased with age, particularly for early-stage lung cancer.
- Between the 2010-to-2012 and 2015-to-2017 periods, five-year NS improved among stage IV prostate, female breast and lung cancer cases, as well as for stage I and III lung cancer cases; however, it did not improve at any stage for colon or rectal cancer cases.
Introduction
Cancer staging is a way of classifying cancer according to its extent and spread at the time of diagnosis. The staging of cancer cases is important at the population level because it helps health professionals evaluate the effectiveness of early detection, including screening programs.Note 1 For example, a shift in the stage distribution of cases towards lower stages at diagnosis after the initiation of a screening program provides some evidence for a successful program. The staging of cancer cases also helps with assessing trends in public health system demands and costs for cancer treatment. At the individual level, it guides clinical decisions regarding the most appropriate course of treatment.Note 2 Along with other potential predictive factors such as age, sex and the histology of the cancer, the stage at which a cancer is diagnosed often provides considerable prognostic insight.Note 2 It also permits the evaluation of treatment effectiveness.
The Canadian Cancer Registry (CCR) is a population-based database composed of cases diagnosed among Canadian residents since 1992.Note 3 The data originate from the provincial and territorial cancer registries that annually provide patient and tumour information to Statistics Canada, where the CCR is maintained. For the 2010-to-2017 data period, all Canadian provinces and territories except Quebec reported information on stage at diagnosis to the CCR for the most commonly diagnosed cancers in Canada. Stage-specific incidence data from the CCR have been the focus of several reports, including the 2018 Canadian Cancer Statistics special report on cancer incidence by stage.Note 4Note 5Note 6Note 7 In contrast, the publication of stage-specific survival figures using CCR data has, to date, been limited to three-year net survival (NS) estimates for lung and bronchus (lung) cancers.Note 8
Short-term, stage-specific survival estimates have also been reported using data directly obtained from nine Canadian provinces. The International Cancer Benchmarking Partnership project has produced reports of one- and three-year
The recent extension of the CCR death-linked analytic file from 2014 to 2017 now offers an opportunity to provide more up-to-date NS figures and to profile, for the first time, five-year NS estimates for Canada (excluding Quebec). This study thus presents five-year, stage-specific cancer NS estimates for the most commonly diagnosed cancers in Canada—lung, breast, prostate, colon, and rectum and rectosigmoid junction (rectum)—which together constitute almost half of all annually diagnosed cancer cases.Note 13 NS estimates are compared across age groups and between biological sexes and two periods (2010-to-2012 vs. 2015-to-2017). The latter allows for the examination of potential short-term changes in stage-specific, five-year NS in Canada that could point to recent variations in screening behaviour or treatment modality.
Data and methods
Data sources and definitions
Canadian Cancer Registry death-linked analytic file
The data source was a pre-existing analytic file created by linking CCR cases diagnosed from 1992 to 2017 to mortality information complete through December 31, 2017, via Statistics Canada’s Social Data Linkage Environment.Note 14 CCR cases originated from the version of the file released on January 29, 2020, which covered the period from 1992 to 2017. The mortality information was obtained from the CCR, the Canadian Vital Statistics Death database (CVSD)Note 15—whose current scope is all deaths in Canada—and the T1 personal master file (as reported on tax returns). The use of death information on tax returns facilitated the identification of additional death events of patients in the CCR that may not have been included in the CVSD, such as out-of-country deaths. It was also used to validate the date of death when discrepancies between dates in the CCR and the CVSD were encountered.
The analytic file followed the multiple primary coding rules of the International Agency for Research on Cancer
Stage data
Using the seventh edition of the American Joint Committee on Cancer’s Cancer Staging Manual, the stage at diagnosis was determined by the Collaborative Stage Data Collection System, which incorporates the tumour, node and metastasis (TNM) staging system. Based on the TNM staging system, cancers are usually assigned an overall stage grouping categorized as either 0, I, II, III, IV or unknown.Note 19 As the size and spread of the cancer increase, the corresponding stage grouping increases. A detailed description of each stage grouping can be found elsewhere.4 The unknown stage category is restricted to cases where staging was attempted but the collected information was insufficient to determine a specific stage (e.g., not all diagnostic workups necessary to determine a stage were performed or the workup record was incomplete). In contrast, missing stage refers to cases for which staging was not attempted (i.e., unstaged). Cancer-specific stage distributions by sex and age group are provided in Appendix Table A.1.
Inclusion and exclusions
All new primary cancers of the colon, rectum, lung, breast and prostate diagnosed in individuals aged 15 to 99 years in the period from 2010 to 2017 were initially included. Cases from the province of Quebec were not available to be included. Of the cases that were originally included, those with an undefined survival time—specifically, cases for which the diagnosis had been established through an autopsy or a death certificate only or for which a death had been established but the year of death was unknown—were excluded (1.0%). The restriction of the dataset to first primary cancers per person, per individual cancerNote 20Note 21Note 22Note 23 resulted in a further rejection of 0.5% of cases. Of the remaining cases, 0.3% were excluded based on stage data, because they were either considered out of scope for survival analysis (i.e., non-invasive stage 0 cases or lung cancer cases staged as occult) or coded as “not applicable” (i.e., unstageable), and 4.1% were excluded because the stage variable was coded as a missing value (i.e., unstaged cases). A total of 531,732 cases were available for stage-specific survival analysis.
Statistical analysis
NS estimates were derived using an algorithmNote 24 that was augmented by Ron Dewar of the Nova Scotia Health Cancer Care ProgramNote 25 to include the Pohar Perme estimator of NSNote 26 using the hazard transformation approach.
The derivation of expected survival probabilities necessary for the calculation of NS has been described elsewhere.Note 27 While NS cannot exceed 100% in theory, in practice it is possible because of the relative survival framework in which it is estimated. However, confidence intervals for point estimates exceeding 100% were unavailable, because they are undefined for the log (-log) transformation approach used to construct them.
For each cancer type, patterns in overall five-year, stage-specific NS and stage-specific NS by sex and by age group were determined using cases diagnosed from 2010 to 2017 and the complete method of survival analysis. Apart from the analysis by sex, the focus of breast cancer was on females because of the rarity of cases among males. To provide the most up-to-date estimates and to facilitate the examination of changes in NS over time, the period method was used to determine predicted NS estimates for the 2015-to-2017 period and the cohort method was used to derive estimates for cases diagnosed from 2010 to 2012.Note 28
The percentage point difference in five-year NS was used as the measure of differences in survival. Differences in NS were calculated before rounding the result. The Z-test was used to determine p-values for percentage point differences in NS; the standard errors of differences were estimated by the square root of the sum of the variances associated with the two NS estimates. P-values correspond to two-sided tests of the null hypothesis that the difference in NS is zero, with a significance level of 0.05.
Stage completeness was defined as the percentage of cases that were assigned a stage value (including those staged as 0 or occult) among the cases that were considered as stageable.Note 4 Estimates of stage completeness were calculated for each cancer type and sex, where applicable. For interpretational purposes, a separate analysis of cases with missing stage was also performed (see Appendix Table A.2).
Results
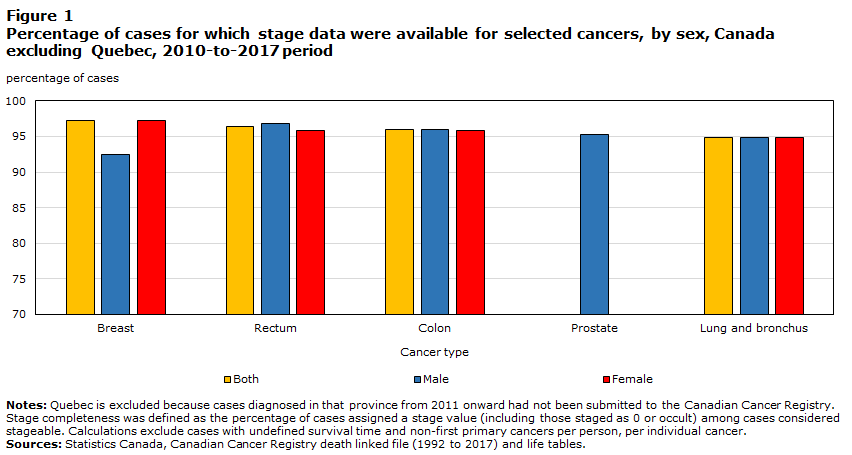
Stage completeness very high
Stage completeness refers to the percentage of cases not coded as unstaged. Stage completeness by cancer type ranged from 94.9% (lung) to 97.2% (breast) for the 2010-to-2017 period (Figure 1). Completeness was higher among females diagnosed with breast cancer than among males (97.2% versus 92.4%) and slightly higher among females for rectal cancer (96.8% versus 95.8%). For both lung and colon cancers, sex-specific stage completeness was virtually identical. Compared with cases that were staged, cases for which the stage was missing (unstaged) were more concentrated in the oldest age group for lung, breast and prostate cancers (Table A2). In contrast, for colon and rectal cancers, unstaged cases were more concentrated in the younger age groups. Of the unstaged cases overall, 98% were diagnosed in Ontario, a province that contributed 48% of the total cases to this study (data not shown).
Description for Figure 1
| Cancer type | Sex | ||
|---|---|---|---|
| Both sexes | Male | Female | |
| percentage of cases | |||
| Breast | 97.2 | 92.4 | 97.2 |
| Rectum | 96.4 | 96.8 | 95.8 |
| Colon | 96.0 | 96.0 | 95.9 |
| Prostate | Note ...: not applicable | 95.3 | Note ...: not applicable |
| Lung and bronchus | 94.9 | 94.9 | 94.8 |
|
... not applicable Notes: Quebec is excluded because cases diagnosed in that province from 2011 onward had not been submitted to the Canadian Cancer Registry. Stage completeness was defined as the percentage of cases assigned a stage value (including those staged as 0 or occult) among cases considered stageable. Calculations exclude cases with undefined survival time and non-first primary cancers per person, per individual cancer. Sources: Statistics Canada, Canadian Cancer Registry death linked file (1992 to 2017) and life tables. |
|||
Net survival inversely related to the stage at diagnosis
NS was observed to be inversely related to the stage at diagnosis for each cancer type, except for prostate cancer, for which there was little variation within the first three stage groups (Figure 2). For example, five-year NS for female breast cancer was 99.8% when diagnosed at stage I, dropping to 91.9% at stage II, then 74.0% at stage III and 23.2% at stage IV. Among cases diagnosed at stage I, five-year NS exceeded 90% for all cancer types except for lung cancer (62%). For lung cancer, estimates decreased by just over 20 percentage points from stage I to II and from stage II to III, and by 13 points from stage III to IV. For both female breast and colon cancers, smaller decreases were observed from stage I to II (8 and 4 percentage points, respectively) than from stage II to III (18 and 20 percentage points, respectively). For rectal cancer, conversely, NS decreased more from stage I to II (12 percentage points) than from stage II to III (6 percentage points). Sharp decreases in NS from stage III to IV were noted for each cancer type. Apart from lung cancer, for which NS at stage III was already quite low (16.3%), decreases from stage III to stage IV ranged from 51 percentage points for breast cancer to 60 percentage points for rectal cancer.

Description for Figure 2
| Cancer type | Stage I | Stage II | Stage III | Stage IV | Stage unknown | ||||||||||
|---|---|---|---|---|---|---|---|---|---|---|---|---|---|---|---|
| Net survival | 95% confidence interval— lower limit | 95% confidence interval— upper limit | Net survival | 95% confidence interval— lower limit | 95% confidence interval— upper limit | Net survival | 95% confidence interval— lower limit | 95% confidence interval— upper limit | Net survival | 95% confidence interval— lower limit | 95% confidence interval— upper limit | Net survival | 95% confidence interval— lower limit | 95% confidence interval— upper limit | |
| net survival (percent) | |||||||||||||||
| Colon | 92.4 | 91.3 | 93.4 | 88.0 | 87.0 | 89.0 | 68.1 | 67.1 | 69.1 | 11.1 | 10.5 | 11.7 | 32.1 | 29.7 | 34.6 |
| Rectum | 91.2 | 89.8 | 92.4 | 79.1 | 77.5 | 80.6 | 73.5 | 72.3 | 74.7 | 13.4 | 12.3 | 14.4 | 52.6 | 49.8 | 55.4 |
| Lung and bronchus | 61.5 | 60.5 | 62.4 | 39.3 | 38.0 | 40.6 | 16.3 | 15.7 | 16.9 | 3.1 | 2.9 | 3.3 | 14.0 | 12.2 | 15.8 |
| Female breast | 99.8 | 98.7 | 100.0 | 91.9 | 91.4 | 92.4 | 74.0 | 73.0 | 75.0 | 23.2 | 21.8 | 24.6 | 55.1 | 51.0 | 59.0 |
| Prostate | 101.2 | Note ..: not available for a specific reference period | Note ..: not available for a specific reference period | 99.1 | 98.5 | 99.4 | 99.6 | 97.7 | 99.9 | 41.1 | 39.7 | 42.4 | 78.8 | 76.6 | 80.8 |
|
.. not available for a specific reference period Notes: Quebec is excluded because cases diagnosed in that province from 2011 onward had not been submitted to the Canadian Cancer Registry. Follow-up of cases is available to the end of 2017. Sources: Statistics Canada, Canadian Cancer Registry death linked file (1992 to 2017) and life tables. |
|||||||||||||||
Stage-specific lung cancer net survival better among females than males
For lung cancer, five-year NS among females exceeded that among males at each known stage of diagnosis (Table 1). The largest difference, 10.2 percentage points, was observed among cases diagnosed at stage I. Differences of about 5 percentage points were seen at both stages II and III, while the difference at stage IV was smaller (1.2 percentage points). All noted differences were statistically significant (p < 0.001). For both colon and rectal cancers, there were no significant stage-specific differences in five-year NS between the sexes, except for a 2.7 percentage point advantage for females diagnosed with stage III rectal cancer (p = 0.034). Curiously, among colon cancer cases whose stage was recorded as unknown, NS for males exceeded that for females by 12 percentage points (38% versus 26%; p < 0.001). Relatively large sex-specific differences in survival point estimates in favour of females, ranging from 5.1 to 8.1 percentage points, were observed for the first three stages of breast cancer. While individually these differences were not statistically significant, perhaps owing to the rarity of cases among males, the difference was significant for stages I through III combined (p = 0.001) (data not shown).
| Cancer type / Stage | Female | Male | Difference (female versus male) | |||||||
|---|---|---|---|---|---|---|---|---|---|---|
| Net survival (%) | 95% Confidence interval |
Net survival (%) | 95% Confidence interval |
Percentage points | 95% Confidence interval |
p-value | ||||
| from | to | from | to | from | to | |||||
| Colon | ||||||||||
| I | 92 | 91 | 94 | 93 | 91 | 94 | -0.3 | -2.3 | 1.8 | 0.795 |
| II | 89 | 87 | 90 | 87 | 86 | 89 | 1.3 | -0.8 | 3.3 | 0.227 |
| III | 67 | 66 | 69 | 69 | 67 | 70 | -1.5 | -3.6 | 0.5 | 0.148 |
| IV | 12 | 11 | 13 | 11 | 10 | 12 | 1.0 | -0.2 | 2.3 | 0.108 |
| Unknown | 26 | 23 | 30 | 38 | 35 | 42 | -12.0 | -16.9 | -7.1 | < 0.001 |
| Rectum | ||||||||||
| I | 92 | 90 | 94 | 91 | 89 | 92 | 1.2 | -1.4 | 3.8 | 0.364 |
| II | 79 | 77 | 82 | 79 | 77 | 81 | 0.5 | -2.7 | 3.8 | 0.747 |
| III | 75 | 73 | 77 | 73 | 71 | 74 | 2.7 | 0.2 | 5.1 | 0.034 |
| IV | 13 | 12 | 15 | 13 | 12 | 15 | 0.0 | -2.2 | 2.2 | 0.999 |
| Unknown | 52 | 48 | 57 | 53 | 49 | 57 | -0.3 | -6.0 | 5.4 | 0.919 |
| Lung and bronchus | ||||||||||
| I | 66 | 65 | 67 | 56 | 54 | 57 | 10.2 | 8.3 | 12.2 | < 0.001 |
| II | 42 | 40 | 44 | 37 | 35 | 39 | 5.0 | 2.4 | 7.6 | < 0.001 |
| III | 19 | 18 | 20 | 14 | 13 | 15 | 5.3 | 4.0 | 6.5 | < 0.001 |
| IV | 4 | 3 | 4 | 3 | 2 | 3 | 1.2 | 0.8 | 1.6 | < 0.001 |
| Unknown | 15 | 13 | 18 | 13 | 10 | 15 | 2.7 | -0.9 | 6.4 | 0.138 |
| Breast | ||||||||||
| I | 100 | 99 | 100 | 95 | 83 | 98 | 5.1 | -1.3 | 11.4 | 0.121 |
| II | 92 | 91 | 92 | 87 | 78 | 92 | 5.4 | -1.5 | 12.2 | 0.126 |
| III | 74 | 73 | 75 | 66Note E: Use with caution | 53 | 76 | 8.1 | -3.5 | 19.6 | 0.171 |
| IV | 23 | 22 | 25 | 23Note E: Use with caution | 13 | 36 | -0.2 | -11.9 | 11.5 | 0.972 |
| Unknown | 55 | 51 | 59 | Note F: too unreliable to be published | Note F: too unreliable to be published | Note F: too unreliable to be published | Note F: too unreliable to be published | Note F: too unreliable to be published | Note F: too unreliable to be published | 0.315 |
|
E use with caution F too unreliable to be published Notes: Quebec is excluded because cases diagnosed in that province from 2011 onward had not been submitted to the Canadian Cancer Registry. Caution should be used in interpreting estimates associated with an unrounded standard error greater than 0.05 and smaller than or equal to 0.10; if the standard error was greater than 0.10, estimates were considered too unreliable to be published. Follow-up of cases is available to the end of 2017. Sources: Statistics Canada, Canadian Cancer Registry death linked file (1992 to 2017) and life tables. |
||||||||||
Stage-specific net survival generally decreases with age
Stage-specific, five-year NS generally decreased with age (Table 2). The largest absolute decreases with age were observed for early-stage lung cancer. For cases diagnosed at stage II, five-year NS decreased by 60 percentage points, from 74% among those aged 15 to 44 years to 14% among those aged 85 to 99 years. A corresponding decrease of 52 percentage points was observed among those diagnosed with lung cancer at stage I. Lung cancer survival also declined considerably with age at advanced stages, but the absolute differences were attenuated by the relatively poor survival among the youngest group.
| Cancer type / Age group (years) |
Cancer stage | ||||||||||||||
|---|---|---|---|---|---|---|---|---|---|---|---|---|---|---|---|
| I | II | III | IV | Unknown | |||||||||||
| Net survival (%) |
95% Confidence interval |
Net survival (%) |
95% Confidence interval |
Net survival (%) |
95% Confidence interval |
Net survival (%) |
95% Confidence interval |
Net survival (%) |
95% Confidence interval |
||||||
| from | to | from | to | from | to | from | to | from | to | ||||||
| Colon | |||||||||||||||
| 15 to 44 | 96 | 93 | 98 | 94 | 91 | 96 | 79 | 75 | 83 | 19 | 16 | 23 | 93 | 84 | 97 |
| 45 to 54 | 96 | 95 | 98 | 92 | 90 | 94 | 78 | 76 | 81 | 18 | 16 | 21 | 74 | 64 | 81 |
| 55 to 64 | 96 | 94 | 97 | 90 | 89 | 92 | 75 | 73 | 76 | 15 | 14 | 17 | 68 | 62 | 74 |
| 65 to 74 | 95 | 93 | 96 | 87 | 86 | 88 | 71 | 69 | 72 | 11 | 10 | 13 | 51 | 45 | 56 |
| 75 to 84 | 90 | 88 | 92 | 86 | 84 | 88 | 62 | 59 | 64 | 7 | 6 | 8 | 25 | 21 | 29 |
| 85 to 99 | 78 | 71 | 84 | 89 | 83 | 93 | 55 | 50 | 60 | 3 | 2 | 4 | 13 | 9 | 16 |
| Rectum | |||||||||||||||
| 15 to 44 | 98 | 95 | 99 | 88 | 82 | 92 | 82 | 78 | 85 | 23 | 17 | 28 | 93 | 86 | 96 |
| 45 to 54 | 97 | 94 | 98 | 87 | 84 | 89 | 80 | 78 | 83 | 23 | 20 | 26 | 86 | 81 | 91 |
| 55 to 64 | 94 | 93 | 96 | 85 | 82 | 87 | 78 | 76 | 80 | 15 | 13 | 17 | 78 | 73 | 82 |
| 65 to 74 | 94 | 92 | 96 | 83 | 81 | 86 | 75 | 73 | 77 | 14 | 12 | 16 | 64 | 58 | 70 |
| 75 to 84 | 86 | 83 | 90 | 70 | 66 | 73 | 63 | 60 | 66 | 6 | 4 | 8 | 36 | 31 | 42 |
| 85 to 99 | 72 | 61 | 80 | 63 | 53 | 71 | 49 | 40 | 58 | 2 | 1 | 5 | 15 | 10 | 21 |
| Lung and bronchus | |||||||||||||||
| 15 to 44 | 91 | 86 | 94 | 74Note E: Use with caution | 60 | 83 | 31 | 24 | 39 | 9 | 7 | 13 | Note F: too unreliable to be published | Note F: too unreliable to be published | Note F: too unreliable to be published |
| 45 to 54 | 79 | 76 | 82 | 59 | 54 | 64 | 28 | 25 | 30 | 6 | 5 | 7 | 34Note E: Use with caution | 21 | 47 |
| 55 to 64 | 71 | 69 | 72 | 51 | 49 | 54 | 22 | 20 | 23 | 4 | 3 | 4 | 32 | 26 | 38 |
| 65 to 74 | 65 | 64 | 67 | 41 | 39 | 43 | 17 | 16 | 18 | 3 | 3 | 3 | 17 | 14 | 21 |
| 75 to 84 | 52 | 50 | 54 | 31 | 29 | 33 | 10 | 9 | 11 | 2 | 2 | 2 | 10 | 7 | 13 |
| 85 to 99 | 39 | 34 | 44 | 14 | 10 | 19 | 8 | 6 | 11 | 2 | 1 | 3 | 4 | 1 | 7 |
| Female breast | |||||||||||||||
| 15 to 39 | 98 | 96 | 99 | 90 | 89 | 92 | 76 | 73 | 78 | 35 | 29 | 42 | 95 | 84 | 98 |
| 40 to 49 | 99 | 99 | 99 | 95 | 94 | 96 | 80 | 78 | 81 | 36 | 32 | 40 | 87 | 78 | 92 |
| 50 to 59 | 99 | 99 | 99 | 94 | 93 | 94 | 79 | 77 | 80 | 27 | 24 | 30 | 75 | 67 | 81 |
| 60 to 69 | 99 | 99 | 100 | 94 | 93 | 94 | 76 | 74 | 78 | 22 | 20 | 25 | 69 | 61 | 75 |
| 70 to 79 | 101 | Note ..: not available for a specific reference period | Note ..: not available for a specific reference period | 90 | 88 | 91 | 70 | 67 | 72 | 20 | 17 | 23 | 54 | 46 | 61 |
| 80 to 99 | 104 | Note ..: not available for a specific reference period | Note ..: not available for a specific reference period | 86 | 83 | 88 | 56 | 51 | 60 | 12 | 9 | 16 | 39 | 32 | 46 |
| Prostate | |||||||||||||||
| 15 to 54 | 100 | 97 | 100 | 100 | 97 | 100 | 100 | 96 | 100 | 51 | 46 | 56 | 96 | 90 | 98 |
| 55 to 64 | 101 | Note ..: not available for a specific reference period | Note ..: not available for a specific reference period | 100 | 99 | 100 | 100 | 98 | 100 | 57 | 54 | 59 | 96 | 93 | 97 |
| 65 to 74 | 102 | Note ..: not available for a specific reference period | Note ..: not available for a specific reference period | 100 | 90 | 100 | 102 | Note ..: not available for a specific reference period | Note ..: not available for a specific reference period | 49 | 47 | 51 | 89 | 86 | 92 |
| 75 to 84 | 101 | Note ..: not available for a specific reference period | Note ..: not available for a specific reference period | 100 | 71 | 100 | 92 | 86 | 95 | 32 | 30 | 35 | 74 | 70 | 78 |
| 85 to 99 | 97Note E: Use with caution | 10 | 100 | 80 | 73 | 85 | Note F: too unreliable to be published | Note F: too unreliable to be published | Note F: too unreliable to be published | 20 | 16 | 24 | 47 | 39 | 54 |
|
.. not available for a specific reference period E use with caution F too unreliable to be published Notes: Quebec is excluded because cases diagnosed in that province from 2011 onward had not been submitted to the Canadian Cancer Registry. Caution should be used in interpreting estimates associated with an unrounded standard error greater than 0.05 and smaller than or equal to 0.10; estimates associated with a standard error greater than 0.10 were considered too unreliable to be published. Follow-up of cases is available to the end of 2017. Confidence intervals are undefined for unrounded point estimates of 100% or greater. Sources: Statistics Canada, Canadian Cancer Registry death linked file (1992 to 2017) and life tables. |
|||||||||||||||
Decreases in five-year NS between the youngest and oldest age groups for rectal cancer ranged from 33 percentage points among those diagnosed at stage III to 21 percentage points among stage IV cases. At each stage, most of the overall decrease occurred in the older age groups (i.e., from 65 to 74 years to 85 to 99 years). Similar, but less pronounced, decreases in NS with age were observed among those diagnosed with colon cancer, especially at stage II. For prostate and female breast cancers, the largest decreases between the youngest and oldest age groups were observed at stage IV (31 and 23 percentage points, respectively) with a steeper decline between older age groups for prostate cancer.
Net survival generally worse for unknown stage and unstaged cases
Cancer-specific, five-year NS estimates among cases with unknown stage tended to be intermediate to those observed for stages III and IV, but closer to stage III (Figure 2). These cases were most frequently diagnosed at an advanced age, when NS is typically poorest (Table A.1; Table 2). Among unstaged cases, five-year NS was lower for all cancers apart from rectal cancer, for which there was no overall difference (Table A.2). Differences were greatest in the oldest age groups (75 years and older) for each cancer type. For breast cancer, much higher NS among staged versus unstaged cases was observed in individuals as young as 50 years. The age group-specific survival for unstaged cases generally tended to approximate most closely that of corresponding estimates for stage III for each cancer (Table A.2; Table 2).
Recent increases in lung cancer net survival across most stages
Significant increases in five-year lung cancer NS from the 2010-to-2012 period to the 2015-to-2017 period were observed for each stage group (p ≤ 0.001) except for stage II (Figure 3a). Increases ranged from 1.1 percentage points among cases diagnosed at stage IV to 2.9 percentage points among cases diagnosed at stage I. While the 2.1 percentage point increase among stage II cases was not statistically significant (p = 0.098), a relatively small proportion of lung cancer cases (8%) were diagnosed at this stage, resulting in diminished statistical power.
Significant stage-specific increases in five-year NS from the 2010-to-2012 period to the 2015-to-2017 period were observed only among stage IV cases for both prostate (4.4 percentage points, p < 0.001) and female breast (2.7 percentage points, p = 0.031) cancers. In contrast, there was a significant decrease in NS of 0.9 percentage points (p = 0.003) among prostate cancer cases diagnosed at stage I and II combined (data not shown). For cancers of the colon and rectum, no significant differences in five-year NS were observed between the reported periods for known stages of diagnosis (Figure 3b).

Description for Figure 3
| Cancer type and stage | 2010 to 2012 | 2015 to 2017 | 2010 to 2012 to 2015 to 2017 | |||||||
|---|---|---|---|---|---|---|---|---|---|---|
| Net survival | 95% confidence interval | Net survival | 95% confidence interval | Net survival change | 95% confidence interval | |||||
| lower | upper | lower | upper | lower | upper | |||||
| net survival (percent) | ||||||||||
| Lung and bronchus | ||||||||||
| I | 60.0 | 58.7 | 61.3 | 62.9 | 61.7 | 64.1 | 2.9 | 1.2 | 4.7 | 0.001 |
| II | 37.9 | 36.2 | 39.6 | 40.0 | 38.3 | 41.7 | 2.1 | -0.4 | 4.5 | 0.098 |
| III | 15.5 | 14.7 | 16.3 | 17.6 | 16.8 | 18.5 | 2.1 | 1.0 | 3.3 | |
| IV | 2.7 | 2.4 | 2.9 | 3.8 | 3.5 | 4.1 | 1.1 | 0.8 | 1.5 | < 0.001 |
| Female breast | ||||||||||
| I | 99.8 | 98.7 | 100.0 | 100.0 | Note ..: not available for a specific reference period | Note ..: not available for a specific reference period | 0.3 | -0.3 | 0.8 | 0.350 |
| II | 91.8 | 91.1 | 92.4 | 91.9 | 91.3 | 92.6 | 0.2 | -0.7 | 1.1 | 0.713 |
| III | 74.5 | 73.2 | 75.7 | 73.1 | 71.8 | 74.4 | -1.4 | -3.1 | 0.4 | 0.134 |
| IV | 21.5 | 19.9 | 23.2 | 24.2 | 22.5 | 26.0 | 2.7 | 0.2 | 5.1 | 0.031 |
| Prostate | ||||||||||
| I | 101.8 | Note ..: not available for a specific reference period | Note ..: not available for a specific reference period | 100.5 | Note ..: not available for a specific reference period | Note ..: not available for a specific reference period | -1.2 | -2.2 | -0.3 | 0.008 |
| II | 99.5 | 98.6 | 99.8 | 98.7 | 98.0 | 99.2 | -0.8 | -1.5 | 0.0 | 0.051 |
| III | 99.7 | 96.0 | 100.0 | 99.7 | 93.5 | 100.0 | 0.1 | -1.1 | 1.3 | 0.897 |
| IV | 38.5 | 36.8 | 40.2 | 42.9 | 41.2 | 44.6 | 4.4 | 2.1 | 6.8 | < 0.001 |
| Colon | ||||||||||
| I | 92.2 | 90.8 | 93.5 | 92.5 | 91.2 | 93.7 | 0.3 | -1.6 | 2.1 | 0.775 |
| II | 87.1 | 85.7 | 88.4 | 88.7 | 87.3 | 90.0 | 1.6 | -0.3 | 3.5 | 0.094 |
| III | 67.8 | 66.5 | 69.1 | 68.4 | 67.0 | 69.7 | 0.5 | -1.3 | 2.4 | 0.575 |
| IV | 11.1 | 10.3 | 11.9 | 11.2 | 10.3 | 12.0 | 0.0 | -1.1 | 1.2 | 0.952 |
| Rectum | ||||||||||
| I | 91.1 | 89.2 | 92.6 | 91.6 | 89.8 | 93.0 | 0.5 | -1.8 | 2.8 | 0.679 |
| II | 79.1 | 77.0 | 81.0 | 79.5 | 77.3 | 81.4 | 0.3 | -2.5 | 3.2 | 0.814 |
| III | 73.5 | 72.0 | 75.1 | 74.0 | 72.4 | 75.4 | 0.4 | -1.7 | 2.6 | 0.704 |
| IV | 13.0 | 11.8 | 14.4 | 13.7 | 12.4 | 15.0 | 0.6 | -1.2 | 2.5 | 0.514 |
|
.. not available for a specific reference period Notes: Quebec is excluded because cases diagnosed in that province from 2011 onward had not been submitted to the Canadian Cancer Registry. Estimates for 2015 to 2017 are predicted. Confidence intervals are undefined for unrounded point estimates of 100% or greater. Sources: Statistics Canada, Canadian Cancer Registry death linked file (1992 to 2017) and life tables. |
||||||||||
Discussion
This study presents the first Canadian (excluding Quebec) estimates of five-year survival by stage at diagnosis. An inverse relationship between five-year NS and stage at diagnosis was observed for each cancer, with the notable exception of prostate cancer, for which NS was consistently approximately 100% for the first three stages but declined substantially for stage IV. Sex differences were most pronounced for lung cancer, where NS among females exceeded that among males at each stage. Age was also an important predictor of survival as stage-specific NS generally decreased with advancing age, particularly for early-stage lung cancer. From the 2010-to-2012 period to the 2015-to-2017 period, significant increases in NS were observed among stage IV prostate and female breast cancer cases, and among both early- and late-stage disease for lung cancer.
Apart from lung cancer, stage I NS exceeded 90% for all cancers studied. This finding underscores the importance of detecting cancer at an early stage, when treatment is most effective. The recent recommendation to introduce lung cancer screening programs for individuals at high risk for lung cancer because of cigarette smoking historyNote 29 may be a positive step in this direction. Organized screening programs already exist for breast and colorectal cancers. Individuals diagnosed with breast cancer through mammography screening typically have their cancer detected earlier in disease progression than those diagnosed through other means. As a result, they tend to benefit more from therapy and have a reduced risk of dying from their diagnosis.Note 30Note 31 Screening is similarly important for the early detection and treatment of colorectal cancer, because symptoms for this disease typically develop later in its progression.Note 32
In contrast to patients diagnosed with colon cancer, many rectal cancer patients clinically identified as having late-stage disease would have received neoadjuvant therapy during the time of this study.Note 33 The shrinkage of tumours prior to surgery and pathological assessment would have likely led to the downstaging of some stage III rectal cancer cases to pathological stage II, resulting in a somewhat artificial decrease of the stage II NS estimate. Additionally, a small percentage of patients would likely have had a complete clinical response, no longer needing surgery.Note 33 Absent of a pathological report, and with only partial stage information available, these patients would have contributed to the unknown stage category; therefore, they may have artificially increased its estimated NS relative to the corresponding estimate for colon cancer.
Prostate cancer tends to be slow growing, and treatment is such that average survival outcomes are excellent and comparable among males diagnosed at stages I through III. Nonetheless, curative treatments can have repercussions that can diminish quality of life, including urinary incontinence and sexual dysfunction.Note 34 The substantial decline in five-year NS from stage III to stage IV prostate cancer observed in this study has been reported elsewhereNote 35 and reflects historical difficulties in treating this disease once it has reached this stage.
Improvement in survival for lung cancer has been shown to have played a leading role in recent improvements in the survival for all cancers combined in Canada.Note 27 The current study further revealed that recent progress in lung cancer survival is apparent in most, if not all, stage groups. Improvements in survival for this disease are attributable to advances in treatment and early diagnosis.Note 36 In addition, the accuracy of staging—fundamental for the selection of treatment—has improved.Note 37 Surgery is most often considered for early-stage lung cancer and usually leads to the best outcomes. While the proportion of patients eligible for surgery is still relatively small, it has increased recently with the introduction of less invasive surgical techniques.Note 36 Radiotherapy can be used in all stages of disease. Technological advancements have improved the radiotherapy targeting of tumours and allowed this treatment to be used more often and with greater success.Note 38 A third example is that advances in systemic therapies for non-small cell lung cancer have led to improved survival for patients diagnosed with late‑stage disease.Note 37Note 39 In the United Kingdom, early diagnosis efforts, such as increasing awareness through national media campaigns, have led to more lung cancer cases being diagnosed at earlier stages of the disease.Note 40
Similarly, the significant increase in five-year NS observed among stage IV prostate cancer cases from the 2010-to-2012 period to the 2015-to-2017 period likely reflects recent transformational breakthroughs in treatment.Note 34Note 41 These include the approval of several new chemotherapeutic agents since 2010, such as new hormone and antibody therapies, as well as new targeted therapies (e.g., androgen receptor blockers). Further improvement in survival for stage IV prostate cancer may be forthcoming as the optimal use and sequencing of these agents have yet to be determined.Note 42 Improvements in systemic therapies have also been reported to prolong life in females diagnosed with advanced breast cancer,Note 43 likely accounting for the recent increase in stage IV breast cancer survival observed in this study. However, as treatment goals remain restricted to extending life and reducing symptoms, metastatic breast cancer continues to be virtually incurable.Note 43
For lung cancer, the results reported suggest a clear five-year survival advantage among females at each stage relative to males. The findings support previous research indicating stage-specific advantages in shorter-term lung cancer survival among females, both in Canada and internationally.Note 9 For breast cancer, higher five-year survival among females has been reported for Canada and elsewhere.Note 44Note 45Note 46Note 47 In the United States, this advantage has been demonstrated to exist at each stage of disease.Note 45 The current results indicate that this may also be true in Canada for stages I to III as the magnitude of sex stage-specific survival differences was comparable with that in the United States. However, differences in Canada were not significant, possibly because of low statistical power (i.e., over 125 times more cases in the U.S. study). Furthermore, in contrast to the U.S. results, stage IV five-year breast cancer survival was virtually identical among males and females. The reason underlying these disparities in survival is not well understood.Note 45 For colon and rectal cancers, the absence of significant sex differences in survival could indicate that screening may provide similar benefits for both sexes.
Strengths and limitations
This study was conducted using incidence data from the CCR, one of the highest-quality national population-based cancer registries in the world.Note 48 Mortality follow-up was determined using three sources of death information, increasing the likelihood of capturing not only deaths occurring in the jurisdiction of diagnosis, but also those occurring in other jurisdictions, including those in and outside Canada. Thus, the file used in this study should be considered more complete than other files created by compiling data directly from provincial cancer registries.Note 49
The results of this study pertain to Canada excluding Quebec, as the CCR has not received data from this jurisdiction since the 2010 data year. Additionally, some cases were not staged or, if they were, were staged as unknown. While the overall percentage of such cases was relatively low, in both situations the cases were skewed towards older age groups, for which NS was typically poorest. As such, there may be some slight overestimation of stage-specific survival estimates for all ages combined. Given that the survival among cases with missing or unknown stage most closely resembled that seen among stage III cases, this effect may be more pronounced for later stages of disease. Finally, while NS may differ by histologic subtype within the cancers presented herein (e.g., small cell lung cancer versus non-small cell lung cancer
Conclusion
This study fills an important gap in providing Canadian, stage-specific, five-year NS estimates. The work showcases the stage at diagnosis as a key predictor of prognosis and highlights the importance of detecting cancer at an early stage, when treatment is most effective. It is also a good example of the use of low-cost data linkage to produce valuable evidence that informs health care delivery. The findings can be used by Canadian health professionals to better inform health policy and treatment evaluation. In addition, while these population-based results reflect average outcomes rather than individual prognoses, they may also be used to educate cancer patients on their disease and treatment options. Routine capture of the stage at diagnosis for an expanded list of cancer types would facilitate analyses to provide further valuable insights into cancer survival in Canada. Future studies should focus on stage-specific analyses by histologic subtype and geographical jurisdiction across Canada.
Appendix
| Cancer type / Age group (years) |
Both sexes | Male | Female | |||||||||||||||
|---|---|---|---|---|---|---|---|---|---|---|---|---|---|---|---|---|---|---|
| Number of cases | Cancer stage | Number of cases | Cancer stage | Number of cases | Cancer stage | |||||||||||||
| I | II | III | IV | Unk | I | II | III | IV | Unk | I | II | III | IV | Unk | ||||
| (%) | (%) | (%) | (%) | (%) | (%) | (%) | (%) | (%) | (%) | (%) | (%) | (%) | (%) | (%) | ||||
| Colon | 83,441 | 22 | 27 | 26 | 21 | 4 | 43,213 | 23 | 27 | 25 | 21 | 4 | 40,228 | 21 | 28 | 26 | 20 | 5 |
| 15 to 44 | 3,217 | 30 | 20 | 24 | 23 | 3 | 1,562 | 27 | 22 | 24 | 24 | 2 | 1,655 | 32 | 18 | 24 | 22 | 4 |
| 45 to 54 | 7,072 | 22 | 23 | 28 | 26 | 2 | 3,646 | 23 | 23 | 28 | 24 | 2 | 3,426 | 22 | 22 | 28 | 27 | 2 |
| 55 to 64 | 15,885 | 24 | 24 | 27 | 23 | 2 | 8,959 | 25 | 24 | 26 | 23 | 2 | 6,926 | 22 | 24 | 29 | 23 | 2 |
| 65 to 74 | 23,253 | 24 | 27 | 26 | 20 | 2 | 13,129 | 25 | 26 | 26 | 20 | 3 | 10,124 | 23 | 29 | 27 | 19 | 2 |
| 75 to 84 | 22,857 | 21 | 31 | 26 | 18 | 4 | 11,501 | 21 | 30 | 25 | 19 | 4 | 11,356 | 21 | 31 | 26 | 18 | 4 |
| 85 to 99 | 11,157 | 15 | 30 | 23 | 20 | 12 | 4,416 | 15 | 31 | 22 | 20 | 12 | 6,741 | 15 | 30 | 24 | 19 | 12 |
| Rectum | 42,118 | 24 | 19 | 33 | 18 | 6 | 26,363 | 23 | 19 | 33 | 19 | 5 | 15,755 | 25 | 19 | 32 | 17 | 7 |
| 15 to 44 | 2,094 | 20 | 13 | 39 | 21 | 7 | 1,096 | 16 | 13 | 41 | 23 | 7 | 998 | 24 | 13 | 37 | 20 | 6 |
| 45 to 54 | 5,745 | 22 | 15 | 38 | 20 | 5 | 3,396 | 21 | 15 | 39 | 21 | 4 | 2,349 | 24 | 15 | 36 | 19 | 5 |
| 55 to 64 | 10,620 | 23 | 18 | 36 | 18 | 5 | 7,000 | 22 | 18 | 36 | 19 | 4 | 3,620 | 25 | 18 | 35 | 16 | 6 |
| 65 to 74 | 11,675 | 26 | 19 | 33 | 17 | 4 | 7,877 | 26 | 19 | 34 | 17 | 4 | 3,798 | 27 | 20 | 32 | 17 | 5 |
| 75 to 84 | 8,555 | 24 | 23 | 29 | 17 | 7 | 5,294 | 24 | 23 | 29 | 18 | 7 | 3,261 | 24 | 22 | 30 | 17 | 7 |
| 85 to 99 | 3,429 | 22 | 22 | 21 | 18 | 17 | 1,700 | 22 | 23 | 22 | 18 | 15 | 1,729 | 23 | 21 | 20 | 18 | 18 |
| Lung and bronchus | 134,390 | 20 | 8 | 19 | 51 | 2 | 68,695 | 17 | 8 | 20 | 53 | 2 | 65,695 | 22 | 8 | 19 | 49 | 2 |
| 15 to 44 | 1,279 | 22 | 6 | 16 | 54 | 1 | 585 | 20 | 6 | 16 | 56 | 1 | 694 | 24 | 6 | 16 | 53 | 1 |
| 45 to 54 | 8,272 | 16 | 6 | 20 | 58 | 1 | 3,720 | 12 | 6 | 20 | 61 | 1 | 4,552 | 19 | 6 | 19 | 55 | 1 |
| 55 to 64 | 28,848 | 18 | 8 | 20 | 53 | 1 | 14,495 | 15 | 8 | 21 | 55 | 1 | 14,353 | 21 | 8 | 20 | 50 | 1 |
| 65 to 74 | 45,865 | 21 | 8 | 20 | 49 | 1 | 23,815 | 18 | 9 | 20 | 51 | 2 | 22,050 | 24 | 8 | 20 | 47 | 1 |
| 75 to 84 | 38,047 | 21 | 8 | 19 | 49 | 2 | 20,066 | 19 | 9 | 20 | 51 | 3 | 17,981 | 24 | 8 | 19 | 47 | 2 |
| 85 to 99 | 12,079 | 17 | 7 | 16 | 54 | 5 | 6,014 | 16 | 8 | 17 | 54 | 5 | 6,065 | 18 | 7 | 16 | 54 | 5 |
| Breast | 142,104 | 44 | 37 | 13 | 5 | 1 | 1,148 | 30 | 43 | 17 | 9 | 1 | 140,956 | 44 | 37 | 13 | 5 | 1 |
| 15 to 39 | 6,340 | 24 | 47 | 22 | 6 | 1 | 22 | 23 | 36 | 27 | 14 | 0 | 6,318 | 24 | 47 | 22 | 6 | 1 |
| 40 to 49 | 20,355 | 35 | 42 | 17 | 4 | 1 | 49 | 41 | 29 | 20 | 8 | 2 | 20,306 | 35 | 42 | 17 | 4 | 1 |
| 50 to 59 | 33,738 | 45 | 37 | 13 | 5 | 1 | 184 | 28 | 43 | 17 | 11 | 1 | 33,554 | 45 | 37 | 13 | 5 | 1 |
| 60 to 69 | 38,142 | 52 | 32 | 10 | 5 | 1 | 330 | 31 | 42 | 16 | 10 | 1 | 37,812 | 52 | 32 | 10 | 5 | 1 |
| 70 to 79 | 26,700 | 50 | 34 | 10 | 6 | 1 | 355 | 31 | 45 | 16 | 8 | 1 | 26,345 | 50 | 33 | 10 | 6 | 1 |
| 80 to 99 | 16,829 | 30 | 43 | 14 | 8 | 5 | 208 | 26 | 46 | 18 | 9 | 1 | 16,621 | 30 | 43 | 14 | 8 | 5 |
| Prostate | Note ...: not applicable | Note ...: not applicable | Note ...: not applicable | Note ...: not applicable | Note ...: not applicable | Note ...: not applicable | 129,679 | 21 | 51 | 13 | 11 | 4 | Note ...: not applicable | Note ...: not applicable | Note ...: not applicable | Note ...: not applicable | Note ...: not applicable | Note ...: not applicable |
| 15 to 54 | Note ...: not applicable | Note ...: not applicable | Note ...: not applicable | Note ...: not applicable | Note ...: not applicable | Note ...: not applicable | 9,532 | 29 | 47 | 15 | 7 | 2 | Note ...: not applicable | Note ...: not applicable | Note ...: not applicable | Note ...: not applicable | Note ...: not applicable | Note ...: not applicable |
| 55 to 64 | Note ...: not applicable | Note ...: not applicable | Note ...: not applicable | Note ...: not applicable | Note ...: not applicable | Note ...: not applicable | 37,970 | 26 | 47 | 16 | 8 | 3 | Note ...: not applicable | Note ...: not applicable | Note ...: not applicable | Note ...: not applicable | Note ...: not applicable | Note ...: not applicable |
| 65 to 74 | Note ...: not applicable | Note ...: not applicable | Note ...: not applicable | Note ...: not applicable | Note ...: not applicable | Note ...: not applicable | 50,469 | 21 | 53 | 14 | 9 | 3 | Note ...: not applicable | Note ...: not applicable | Note ...: not applicable | Note ...: not applicable | Note ...: not applicable | Note ...: not applicable |
| 75 to 84 | Note ...: not applicable | Note ...: not applicable | Note ...: not applicable | Note ...: not applicable | Note ...: not applicable | Note ...: not applicable | 25,201 | 14 | 57 | 6 | 17 | 6 | Note ...: not applicable | Note ...: not applicable | Note ...: not applicable | Note ...: not applicable | Note ...: not applicable | Note ...: not applicable |
| 85 to 99 | Note ...: not applicable | Note ...: not applicable | Note ...: not applicable | Note ...: not applicable | Note ...: not applicable | Note ...: not applicable | 6,507 | 8 | 39 | 3 | 36 | 14 | Note ...: not applicable | Note ...: not applicable | Note ...: not applicable | Note ...: not applicable | Note ...: not applicable | Note ...: not applicable |
|
... not applicable Notes: Unk = Unknown. Quebec is excluded because cases diagnosed in that province from 2011 onward had not been submitted to the Canadian Cancer Registry. Case counts and percentage distributions are based on cases included in survival analyses (see methods). Sex-specific row percentage totals may not sum to 100 because of rounding. Source: Statistics Canada, Canadian Cancer Registry death linked file (1992 to 2017). |
||||||||||||||||||
| Cancer type / Age group (years) | Distribution | Five-year net survival | ||||||
|---|---|---|---|---|---|---|---|---|
| Unstaged | Staged | Unstaged | Staged | |||||
| % | % | NS | 95% CI | NS | 95% CI | |||
| (%) | from | to | (%) | from | to | |||
| Colon | Note ...: not applicable | Note ...: not applicable | 58 | 56 | 60 | 65 | 65 | 66 |
| 15 to 44 | 5.7 | 3.9 | 83 | 76 | 88 | 73 | 71 | 75 |
| 45 to 54 | 11.7 | 8.5 | 71 | 65 | 77 | 70 | 69 | 71 |
| 55 to 64 | 21.4 | 19.1 | 68 | 63 | 72 | 69 | 68 | 70 |
| 65 to 74 | 25.0 | 27.9 | 64 | 59 | 68 | 68 | 68 | 69 |
| 75 to 84 | 22.4 | 27.4 | 48 | 42 | 53 | 63 | 62 | 65 |
| 85 to 99 | 13.9 | 13.3 | 30 | 22 | 38 | 53 | 51 | 55 |
| Rectum | Note ...: not applicable | Note ...: not applicable | 65 | 62 | 69 | 67 | 66 | 67 |
| 15 to 44 | 8.4 | 5.0 | 73Note E: Use with caution | 62 | 82 | 74 | 72 | 76 |
| 45 to 54 | 19.9 | 13.6 | 82 | 75 | 87 | 74 | 72 | 75 |
| 55 to 64 | 24.2 | 25.2 | 78 | 72 | 83 | 72 | 70 | 73 |
| 65 to 74 | 24.6 | 27.8 | 66 | 58 | 72 | 70 | 69 | 71 |
| 75 to 84 | 15.2 | 20.3 | 36 | 27 | 46 | 58 | 57 | 60 |
| 85 to 99 | 7.7 | 8.1 | 33Note E: Use with caution | 18 | 48 | 43 | 39 | 46 |
| Lung and bronchus | Note ...: not applicable | Note ...: not applicable | 16 | 15 | 17 | 20 | 20 | 20 |
| 15 to 44 | 1.6 | 1.0 | 45Note E: Use with caution | 34 | 55 | 37 | 34 | 40 |
| 45 to 54 | 5.6 | 6.2 | 28 | 23 | 33 | 25 | 24 | 26 |
| 55 to 64 | 17.9 | 21.5 | 21 | 18 | 24 | 24 | 23 | 24 |
| 65 to 74 | 30.1 | 34.1 | 19 | 17 | 22 | 22 | 22 | 23 |
| 75 to 84 | 29.5 | 28.3 | 12 | 10 | 14 | 17 | 16 | 17 |
| 85 to 99 | 15.3 | 9.0 | 4 | 2 | 7 | 10 | 9 | 11 |
| Breast | Note ...: not applicable | Note ...: not applicable | 76 | 74 | 78 | 89 | 88 | 89 |
| 15 to 39 | 5.1 | 4.5 | 86 | 79 | 91 | 86 | 84 | 87 |
| 40 to 49 | 14.8 | 14.4 | 89 | 86 | 92 | 91 | 91 | 92 |
| 50 to 59 | 20.6 | 23.8 | 82 | 78 | 85 | 91 | 90 | 91 |
| 60 to 69 | 23.8 | 26.8 | 78 | 74 | 82 | 91 | 91 | 92 |
| 70 to 79 | 18.7 | 18.7 | 72 | 67 | 76 | 89 | 88 | 89 |
| 80 to 99 | 17.0 | 11.8 | 56 | 48 | 63 | 78 | 76 | 80 |
| Prostate | Note ...: not applicable | Note ...: not applicable | 82 | 80 | 84 | 93 | 92 | 93 |
| 15 to 54 | 7.4 | 7.4 | 95 | 91 | 97 | 96 | 96 | 97 |
| 55 to 64 | 25.8 | 29.3 | 94 | 92 | 96 | 97 | 97 | 97 |
| 65 to 74 | 33.3 | 38.9 | 94 | 91 | 95 | 96 | 96 | 97 |
| 75 to 84 | 22.9 | 19.4 | 73 | 68 | 76 | 87 | 86 | 88 |
| 85 to 99 | 10.6 | 5.0 | 32 | 25 | 40 | 56 | 53 | 60 |
|
... not applicable E use with caution Notes: NS = net survival. CI = confidence interval. Quebec is excluded because cases diagnosed in that province from 2011 onward had not been submitted to the Canadian Cancer Registry. Caution should be used in interpreting estimates associated with an unrounded standard error greater than 0.05 and smaller than or equal to 0.10. Distribution percentages are based on cases otherwise eligible for survival analysis (see methods). Staged cases include those staged as unknown. Cancer-specific column percentage totals may not sum to 100 because of rounding. Sources: Statistics Canada, Canadian Cancer Registry death linked file (1992 to 2017) and life tables. |
||||||||
- Date modified: