
Health Reports
The influence of removing the 10-minute bout requirement on the demographic, behaviour and health profiles of Canadian adults who meet the physical activity recommendations
by Stephanie A. Prince, Karen C. Roberts, Justin J. Lang, Gregory P. Butler and Rachel C. Colley

DOI: https://www.doi.org/10.25318/82-003-x202200800001-eng
Abstract
Background
Recently, the Canadian 24-Hour Movement Guidelines for Adults were released, and included a revised physical activity (PA) recommendation. The recommendation of 150 minutes per week of moderate-to-vigorous intensity PA (MVPA) was revised, from requiring that MVPA be accrued in bouts of 10 minutes or more (bouted) to having no bout requirement (non-bouted). The objective of this study was to assess whether there were differences in sociodemographic, health and fitness characteristics of Canadians who met the bouted and non-bouted PA recommendations.
Data and methods
Using adult (aged 18 to 79 years) accelerometer data from three combined cycles of the nationally representative Canadian Health Measures Survey (N = 7,102), this study compared adherence to the bouted and non-bouted recommendations. Differences in sociodemographic, health and fitness measures were assessed using independent t-tests and chi-squares. Multivariate linear and logistic regressions controlling for age, sex, household education and smoking examined associations with health and fitness measures.
Results
More adults met the PA recommendation using the non-bouted versus bouted (45.3% vs. 18.5%) requirement. Characteristics of those who met the bouted and only the non-bouted recommendations were similar. Exceptions among those who met only the non-bouted recommendation compared with meeting the bouted recommendation included fewer adults aged 65 years and older; lower MVPA, recreation PA and transport PA; and higher sedentary time, light PA and grip strength.
Interpretation
Although the removal of the 10-minute bout requirement increased the proportion of Canadian adults who met the PA recommendation, there were no substantial differences in the sociodemographic and health characteristics of the populations captured by the bouted and non-bouted definitions. Results help to inform the transition in reporting for PA surveillance.
Keywords
physical activity, self-report, accelerometer, guidelines, surveillance, motor activity.
Authors
Stephanie A. Prince is with the Centre for Surveillance and Applied Research, Public Health Agency of Canada, Ottawa, as well as the School of Epidemiology and Public Health, Faculty of Medicine, University of Ottawa, Ottawa. Karen C. Roberts and Gregory P. Butler are with the Centre for Surveillance and Applied Research, Public Health Agency of Canada, Ottawa. Justin J. Lang is with the Centre for Surveillance and Applied Research, Public Health Agency of Canada, Ottawa, as well as the School of Mathematics and Statistics, Faculty of Sciences, Carleton University, Ottawa. Rachel C. Colley is with the Health Analysis Division, Statistics Canada, Ottawa.
What is already known on this subject?
- The majority of adults do not meet the recommendation of 150 minutes per week of moderate-to-vigorous intensity physical activity (PA).
- Accelerometer studies have shown that a linear dose-response relationship exists between PA and health outcomes, such that PA accrued in any amount of time promotes health.
- Removal of the 10-minute bout requirement more than doubled the proportion of Canadians who met the PA recommendations.
What does this study add?
- This study confirms findings from previous work showing that the removal of the 10-minute bout requirement for assessing PA recommendation adherence with accelerometers more than doubled the proportion of Canadian adults meeting the recommendation.
- The removal of the 10-minute bout requirement did not result in a substantial difference in sociodemographic, fitness and health characteristics among Canadian adults who met the recommendation.
Introduction
Regular physical activity (PA) can prevent many chronic conditions and premature all-cause mortality.Note 1Note 2 PA guidelines help to promote healthy targets and support policy frameworks and public health action.Note 3 Until recently, adult PA recommendations in Canada, the United States and internationally, called for a minimum of 150 minutes per week of moderate-to-vigorous intensity physical activity (MVPA) accrued in bouts of 10 minutes or more.Note 4Note 5Note 6 This threshold was established based on evidence suggesting that a minimum of 150 minutes of MVPA per week is needed to reduce chronic disease risk.Note 7 Recently the United States, Canada and the World Health Organization (WHO) released updated PA recommendations (Canada and WHO in combination with 24-hour movement behaviour guidelines), which maintain the recommendation of ≥ 150 minutes per week of MVPA, but remove the requirement of 10-minute bouts. This is consistent with the messaging that any amount of MVPA counts.Note 8
In Canada, the Public Health Agency of Canada’s Physical Activity, Sedentary Behaviour and Sleep (PASS) Indicators provide important surveillance information on the PA levels of adults.Note 9Note 10 As part of the PASS Indicators, the proportion of Canadian adults meeting the former PA recommendation (“…should accumulate at least 150 minutes of moderate- to vigorous-intensity aerobic PA per week, in bouts of 10 minutes or more”)Note 11 has been reported using bouted device-measured (accelerometer) PA data collected as part of the Canadian Health Measures Survey (CHMS).10 Moving from a bouted to a non-bouted recommendation will result in more Canadians identified as adherent because of a more inclusive definition. As Canada’s PA surveillance shifts to reporting on the adherence of Canadians to the new, non-bouted PA recommendation, it is important to understand how estimates of Canadian adults meeting PA recommendation increase following the removal of the 10-minute bout requirement, and how this change affects the sociodemographic and health characteristics of those who meet the PA recommendation. This is particularly important to verify since there are health promotion advantages for recommendations that are not dependent on bouts (i.e., promoting all PA counts).Note 12
The objectives of this study were to (1) confirm and compare estimates of meeting the PA recommendation based on bouted and non-bouted accelerometer data, and (2) compare the sociodemographic characteristics, health behaviours and markers of health status of Canadian adults categorized as meeting the 150 minutes per week PA recommendation using bouted and non-bouted definitions.
Methods
Data source
This study combined all adult (aged 18 to 79 years) data with complete and valid self-reported and accelerometer-measured PA values from cycles 4 (2014 and 2015), 5 (2016 and 2017) and 6 (2018 and 2019) of the CHMS. All data were collected before the COVID-19 pandemic. The CHMS is an ongoing cross-sectional survey conducted by Statistics Canada that collects self-reported and directly measured health information from a representative sample of the Canadian household-dwelling population aged 3 to 79 years living in the provinces. From a total of 17,377 respondents of the household questionnaire, 5,070 were removed for not having valid accelerometer data (< 4 days with ≥ 10 hours of wear time per day), 5,182 were removed for being younger than 18 years, and 23 were removed because of missing or incomplete self-reported PA. The analyzed sample included 2,390 adults from Cycle 4, 2,343 adults from Cycle 5 and 2,369 adults from Cycle 6.
Accelerometer measured physical activity
In the CHMS, respondents who attended a clinic visit were asked to wear an Actical accelerometer (Philips Respironics, Oregon, United States) over their right hip on an elasticized belt during waking hours for seven consecutive days. To be considered complete and valid, respondents were required to have a minimum of four valid days with valid days defined as having 10 or more hours of wear time. Previously validated movement intensity thresholdsNote 13Note 14 were applied to the data to derive sedentary time and time spent in light (LPA), moderate (MPA) and vigorous (VPA) intensity PA. MPA and VPA were summed to provide MVPA. Average daily steps were also extracted. For the purpose of this study, PA recommendation adherence (≥ 150 minutes per week) was assessed using both bouted (i.e., accrued in bouts of ≥ 10 minutes) and non-bouted (i.e., any minute counts) MVPA. For the purpose of comparative analyses in which groups must be mutually exclusive and independent, those who met the PA recommendations using bouted data are labelled as “met bouted”, whereas those who only met non-bouted recommendations were labelled as “met only non-bouted”. Additionally, to compare those meeting the PA recommendations with those who do not, “met bouted” was compared with “did not meet bouted”, and “met non-bouted” was compared with “did not meet non-bouted”.
Population characteristic measures
The following demographic characteristics were examined: age (18 to 64 years vs. 65 years and older), sex (male vs. female), household education level (some postsecondary or less vs. postsecondary graduate), marital status (married or common law vs. widowed, separated, divorced, single or never married), immigrant status (landed immigrant vs. non-immigrant) and Indigenous status (First Nations, Métis or Inuit vs. non-Indigenous).
Health behaviour measures
We examined total minutes per week of self-reported PA in the transport, recreation, and household and occupation domains separately, as well as the total from all domains. Adherence to recreational screen time (≤ 3 vs. > 3 hours per day of self-reported screen use) and sedentary time (≤ 9 vs. > 9 hours per day of accelerometer-measured timeNote 15) recommendations were examined using self-report and accelerometer measures, respectively. Smoking status was assessed by self-report and examined as current smokers vs. current non-smokers.
Health and fitness measures
The following self-reported measures of health were examined: self-rated mental health (excellent and very good vs. good, fair and poor), perceived health (excellent and very good vs. good, fair and poor), and presence of two or more select chronic conditions (i.e., arthritis, chronic obstructive pulmonary disease, diabetes, heart disease, cancer, stroke or mood disorder).Note 16 We also examined objective measures of body mass index (BMI; underweight and normal [< 25.0 kg/m2] vs. overweight and obese [≥ 25.0 kg/m2]),Note 17 waist circumference using the National Institutes of Health protocol (low risk [male < 102.0 cm, female < 88.0 cm] vs. at risk [male ≥ 102.0 cm, female ≥ 88.0 cm]Note 18), hypertension status (systolic blood pressure ≥ 140 mmHg or diastolic blood pressure ≥ 90 mmHg or self-report use of blood pressure controlling medications),Note 19 diabetes status (HbA1c ≥ 6.5% or self-reported diabetes diagnosis),Note 20 high cholesterol (fasted total cholesterol-to-high-density lipoprotein ratio [TC:HDL] ≥ 5 or self-reported high cholesterol),Note 21 aerobic fitness score, sit and reach distance (in centimetres), and hand grip strength (in kilograms). Aerobic fitness and flexibility measures were only assessed in cycles 5 and 6. Indicator thresholds were aligned with the Canadian Chronic Disease IndicatorsNote 21 where possible.
Statistical analyses
Statistical analyses were performed using SAS Enterprise Guide v.7.1 (SAS Institute Inc., Cary, North Carolina). Proportions and 95% confidence intervals (CIs) were used to describe the population captured as meeting the PA recommendation using bouted and non-bouted accelerometer data, combined and by sex and age (18 to 64 years vs. 65 years and older). Characteristics of adults identified as meeting the PA recommendation are presented using means or proportions and 95% CIs. Differences in characteristic, behaviour, health and fitness measures between those meeting the recommendation by bouted versus non-bouted data were assessed using chi-square for categorical outcomes or independent samples t-tests for continuous outcomes. Accelerometer-measured steps, MPA and VPA were log transformed, and self-report PA variables were log 10 transformed to meet the assumption of normality of residuals in regression models. The association between meeting the PA recommendation using bouted and non-bouted data and measures of health and fitness were assessed using multivariate linear or logistic regression models controlling for age, sex, household education and smoking status.
All analyses were weighted using combined cycle accelerometer subsample survey weights.Note 22 Degrees of freedom were set at 33 (or 22 for measures fitness and flexibility measures only included in only two cycles). To account for survey design effects, 95% CIs were estimated using the bootstrap balanced repeated replication (BRR) technique with 500 replicate weights. Statistical significance was set at p < 0.05.
Results
Comparing bouted and non-bouted physical activity recommendations
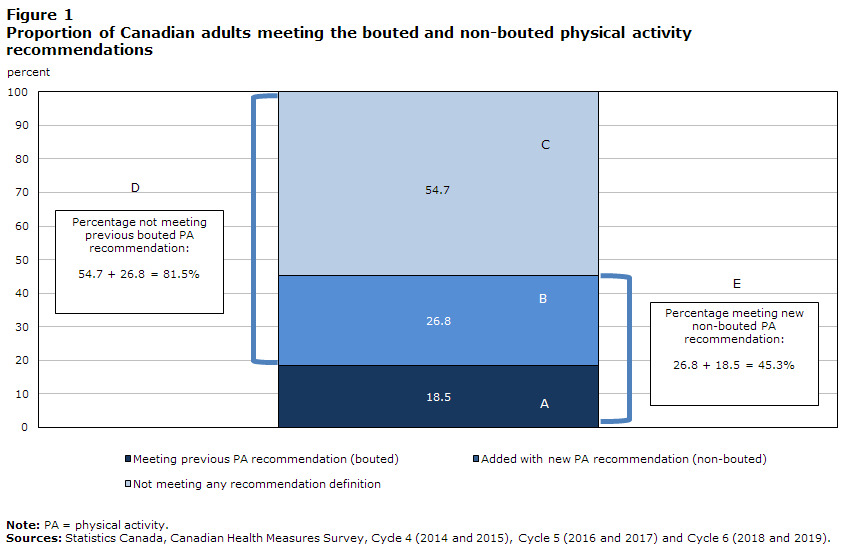
Figure 1 presents the proportions of Canadian adults aged 18 to 79 years meeting the bouted and non-bouted PA recommendations. A total of 18.5% (A) met the bouted recommendation, while 45.3% (E) met the non-bouted recommendation (26.8% [B] met based on only non-bouted data).
Description for Figure 1
| Meeting previous PA recommendation (bouted) | Added with new PA recommendation (non-bouted) | Not meeting any recommendation definition | |
|---|---|---|---|
| Total (18 years and older ) | 18.5 | 26.8 | 54.7 |
|
Note: PA = physical activity. Sources: Statistics Canada, Canadian Health Measures Survey, Cycle 4 (2014 and 2015), Cycle 5 (2016 and 2017) and Cycle 6 (2018 and 2019). |
|||
Sociodemographics and meeting the bouted and non-bouted physical activity recommendations
Comparisons of sociodemographics between those who met the bouted (Figure 1, Group A) and only the non-bouted recommendation (Figure 1, Group B) are shown in Figure 2A (Appendix Table A.1, Comparison 1). Those who met the bouted PA recommendation compared with those who met only the non-bouted PA recommendation are similar except for being of older age (65 years and older: 13.5% vs. 4.5%, p < 0.0001) and more likely to be male (50.5% vs. 42.0%, p = 0.04).

Description for Figure 2A-C
Figure 2A-C
Comparison of sociodemographics by meeting the bouted and non-bouted physical activity recommendations
The figure uses arrows to indicate whether meeting versus not-meeting different PA recommendations was associated with sociodemographic characteristics.
Meeting the bouted PA recommendation versus meeting only the non-bouted PA recommendation was...
- associated with greater likelihood of increased age
- associated with reduced likelihood of being female
- not significantly associated with marital status, immigrant status, Indigenous identity, education level, smoking status
Meeting the bouted PA recommendation versus not meeting the bouted PA recommendation was...
- associated with reduced likelihood of being a smoker
- not significantly associated with age, sex, marital status, immigrant status, Indigenous identity, education level
Meeting the non-bouted PA recommendation versus not meeting the non-bouted PA recommendation was...
- associated with greater likelihood of higher education
- associated with reduced likelihood of increased age, being female, being married/common law, being a smoker
- not significantly associated with immigrant status, Indigenous identity
Sources: Statistics Canada, Canadian Health Measures Survey, Cycle 4 (2014 and 2015), Cycle 5 (2016 and 2017) and Cycle 6 (2018 and 2019).
Comparisons of sociodemographics between those meeting and not meeting the bouted recommendation are shown in Figure 2B (Appendix Table A.1, Comparison 2). When looking at those who met the bouted recommendation compared with those who did not, characteristics were similar, except for fewer smokers (11.8% vs. 17.3%, p = 0.002) among those that met the bouted recommendation.
Comparisons of sociodemographics between those meeting and not meeting the non-bouted recommendation are shown in Figure 2C (Appendix Table A.1, Comparison 3). Compared with those who did not meet the non-bouted recommendation, those that met them were younger (18 to 64 years: 91.8% vs. 80.3%, p < 0.0001), were less likely to be female (45.0% vs. 55.0%, p = 0.0009), were less likely to be married or common law (59.2% vs. 67.3%, p = 0.0005), had higher household education (86.1% vs. 79.9%, p = 0.0003) and were less likely to be smokers (13.8% vs. 18.4%, p = 0.01).
PA levels and meeting bouted and non-bouted physical activity recommendations
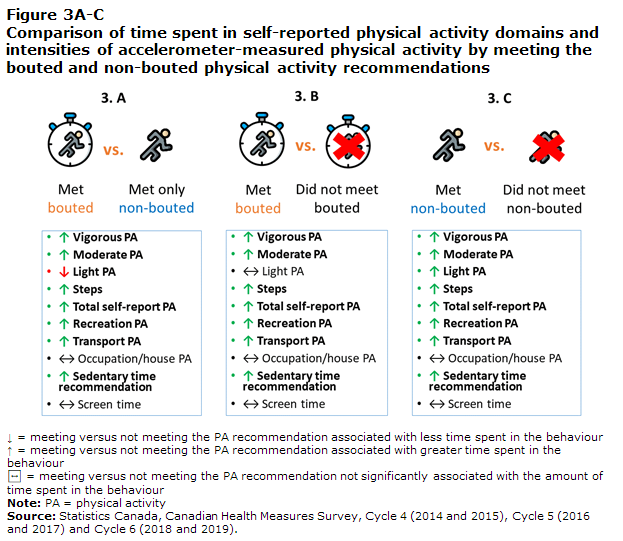
Comparisons of PA levels between those who met the bouted (Figure 1, Group A) and only the non-bouted recommendation (Figure 1, Group B) are shown in Figure 3A (Appendix Table A.2, Comparison 1). The distribution of time spent in different intensities and domains of PA differed between those who met the bouted PA recommendation and those who met with only non-bouted recommendation. Those who met the bouted PA recommendation reported more recreational PA (166.8 vs. 121.5 minutes per week, p = 0.006) and transport PA (149.7 vs. 101.6 minutes per week, p = 0.0004). They also accrued more device-measured MPA (48.5 vs. 30.6 minutes per week, p < 0.0001), VPA (13.2 vs. 3.9 minutes per day, p < 0.0001) and steps (11,883 vs. 9,764 steps per day, p < 0.0001), but less LPA (213.1 vs. 233.3 minutes per day, p = 0.001). They were also more likely to meet the sedentary time recommendation (45.1% vs. 35.5%, p = 0.01).
Description for Figure 3A-C
Figure 3A-C
Comparison of time spent in self-reported physical activity domains and intensities of accelerometer-measured physical activity by meeting the bouted and non-bouted physical activity recommendations
The figure uses arrows to indicate whether meeting versus not-meeting different PA recommendations was associated with time spent in self-reported physical activity domains and intensities of accelerometer-measured physical activity.
Meeting the bouted PA recommendation versus meeting only the non-bouted PA recommendation was...
- associated with greater time spent in vigorous PA , moderate PA , total self-report PA , recreation PA , transport PA ; more steps; meeting the sedentary time recommendation
- associated with less time spent in light PA
- not significantly associated with time spent in occupation/house PA , screen time
Meeting the bouted PA recommendation versus not meeting the bouted PA recommendation was...
- associated with greater time spent in vigorous PA , moderate PA , total self-report PA , recreation PA , transport PA ; more steps; meeting the sedentary time recommendation
- not significantly associated with time spent in light PA , occupation/house PA , screen time
Meeting the non-bouted PA recommendation versus not meeting the non-bouted PA recommendation was...
- associated with greater time spent in vigorous PA , time spent in moderate PA , time spent in light PA , total self-report PA , recreation PA , transport PA ; more steps; meeting the sedentary time recommendation
- not significantly associated with time spent in occupation/house PA , screen time
Note: PA = physical activity.
Sources: Statistics Canada, Canadian Health Measures Survey, Cycle 4 (2014 and 2015), Cycle 5 (2016 and 2017) and Cycle 6 (2018 and 2019).
Comparisons of PA levels between those meeting and not meeting the bouted recommendation are shown in Figure 3B (Appendix Table A.2, Comparison 2). Compared with those who did not meet the bouted recommendation, those who met them reported having a higher average time in active transport (149.7 vs. 71.1 minutes per day, p < 0.0001), recreation PA (166.8 vs. 96.4 minutes per day, p < 0.0001) and overall PA (405.3 vs. 325.5 minutes per day, p < 0.0001). They spent more time in device-measured MPA (48.5 vs. 16.1 minutes per day, p < 0.0001) and VPA (13.2 vs. 1.6 minutes per day, p < 0.0001). They also took more device-measured steps (11,883 vs. 7,545, p < 0.0001), and were more likely to meet the sedentary time recommendation (45.1% vs. 27.0%, p < 0.0001).
Comparisons of PA levels between those meeting and not meeting the non-bouted recommendation are shown in Figure 3C (Appendix Table A.1, Comparison 3). Compared with those who did not meet the non-bouted recommendation, those who met them reported having a higher average time in active transport (121.2 vs. 56.2 minutes per day, p = 0.0012), recreation PA (140.0 vs. 84.2 minutes per day, p = 0.0006) and overall PA (388.3 vs. 300.5 minutes per day, p < 0.0001). They also spent more time in device-measured LPA (225.1 vs. 203.9 minutes per day, p < 0.0001), MPA (37.9 vs. 9.0 minutes per day, p < 0.0001) and VPA (7.7 vs. 0.5 minutes per day, p < 0.0001). Finally, they took more device-measured steps (10,626 vs. 6,460, p < 0.0001), and were more likely to meet the sedentary time recommendation (39.4% vs. 22.9%, p < 0.0001).
Health and fitness and meeting bouted and non-bouted physical activity recommendations
Comparisons of health and fitness indicators between those who met the bouted (Figure 1, Group A) and only the non-bouted recommendation (Figure 1, Group B) are shown in Figure 4A (Appendix Table A.3, Comparison 1). Health and fitness indicators were largely similar between those who met the PA recommendation using bouted PA and those who met only non-bouted PA data. The only difference was that, compared with those who met based on bouted data, those who met the PA recommendation using only non-bouted data had a significantly higher average grip strength (adjusted beta coefficient (aβ) = 2.57, 95% CI: 0.82 to 4.32), even after adjusting for age, sex, household education and smoking status.

Description for Figure 4A-C
Figure 4A-C
Comparison of health and fitness indicators by meeting the bouted and non-bouted physical activity recommendations after adjustment for age, sex, smoking status and household education
The figure uses arrows to indicate whether meeting versus not-meeting different PA recommendations was associated with reduced likelihood, increased likelihood or not significantly associated with health and fitness indicators after adjustment for age, sex, smoking status and household education.
Meeting the bouted PA recommendation versus meeting only the non-bouted PA recommendation was...
- not signficantly associated with obesity (BMI/WC), chronic conditions, mental health, general health, high cholesterol, diabetes or flexibility.
- associated with reduced likelihood of higher average grip strength.
- associated with increased likelihood of hypertension, however after adjustment for age, sex, smoking status and household education this result was not statistically significant.
- associated with reduced likelihood of aerobic fitness, however after adjustment for age, sex, smoking status and household education this result was not statistically significant.
Meeting the bouted PA recommendation versus not meeting the bouted PA recommendation was...
- not significantly associated with mental health, flexibility.
- associated with increased likelihood of general health, aerobic fitness.
- associated with reduced likelihood of obesity, chronic conditions.
- associated with reduced likelihood of hypertension, high cholesterol and diabetes, however after adjustment for age, sex, smoking status and household education these results were not statistically significant
- associated with reduced likelihood of higher average grip strength after adjustment for age, sex, smoking status and household education;
Meeting the non-bouted PA recommendation versus not meeting the non-bouted PA recommendation was...
- not significantly associated with mental health
- associated with increased likelihood of general health, aerobic fitness, flexibility, higher average grip strength
- associated with reduced likelihood of obesity (BMI/WC), chronic conditions, hypertension, diabetes
- associated with reduced likelihood of high cholesterol, however after adjustment for age, sex, smoking status and household education these results were not statistically significant
Notes: BMI = body mass index, WC = waist circumference.
Sources: Statistics Canada, Canadian Health Measures Survey, Cycle 4 (2014 and 2015), Cycle 5 (2016 and 2017) and Cycle 6 (2018 and 2019).
Comparisons of health and fitness indicators between those meeting and not meeting the bouted recommendation are shown in Figure 4B (Appendix Table A.3, Comparison 2). Compared with those who did not meet the bouted PA recommendation, those who met the bouted PA recommendation were less likely to have an at-risk waist circumference (adjusted odds ratio (aOR) = 0.58, 95% CI: 0.45 to 0.75), have a BMI considered overweight or obese (aOR = 0.65, 95% CI: 0.48 to 0.88), have two or more chronic conditions (aOR = 0.58, 95% CI: 0.42 to 0.80), and report poorer health (aOR = 0.65, 95% CI: 0.51 to 0.83). Additionally, they had lower grip strength (aβ = -2.59, 95% CI: -4.10 to -1.07) and higher aerobic fitness (aβ = 14.4, 95% CI: 4.12 to 24.70). No statistically significant differences were observed for the likelihood of hypertension, poor mental health, diabetes, high cholesterol or low flexibility.
Comparisons of health and fitness indicators between those meeting and not meeting the non-bouted recommendation are shown in Figure 4C (Appendix Table A.3, Comparison 3). Using non-bouted PA, a greater number of differences were observed between those who met the recommendation and those who did not meet it. Compared with individuals who did not meet it, those who met the non-bouted PA recommendation were less likely to have an at-risk waist circumference (aOR = 0.45, 95% CI: 0.37 to 0.55), have a BMI considered overweight or obese (aOR = 0.46, 95% CI: 0.39 to 0.55), have two or more chronic conditions (aOR = 0.62, 95% CI: 0.43 to 0.89), report poorer health (aOR = 0.63, 95% CI: 0.52 to 0.77), have hypertension (aOR = 0.64, 95% CI: 0.49 to 0.84), and have diabetes (aOR = 0.56, 95% CI: 0.31 to 0.93). Those who met the non-bouted PA recommendation also had higher aerobic fitness (aβ = 24.62, 95% CI: 16.41 to 32.83) and flexibility (aβ = 1.70, 95% CI: 0.50 to 2.90), but lower grip strength (aβ = -1.57, 95% CI: -2.82 to -0.31) compared with those who did not meet the non-bouted PA recommendation. No differences were observed for mental health, and high cholesterol was only statistically different between groups before controlling for age, sex, smoking status and household education.
Discussion
Using a representative sample of Canadian adults aged 18 to 79 years, the present study examined how the removal of the 10-minute bout requirement changed the number and characteristics of those who met the PA recommendation (≥ 150 minutes per week of MVPA). More adults met the PA recommendation using the less strict non-bouted data. The characteristics of those who met the bouted and met with only non-bouted definitions were relatively similar—except the non-bouted group accrued more steps, LPA and sedentary time, but engaged in less accelerometer MVPA, and self-reported less recreation PA, active transport and total PA. Health indicators were also similar between groups, with the exception of grip strength, which was higher among those who met with only non-bouted PA. When comparing individuals who did not meet each of the respective recommendations, those meeting the non-bouted recommendation had statistically significant better health and fitness indicators compared with those who met the bouted recommendation.
Findings from this study are similar to those observed using accelerometer data from the US nationally representative National Health and Nutrition Examination Survey (2003/2004 and 2005/2006 NHANES).Note 23 The proportion of US adults meeting the guidelines quadrupled with the removal of the 10-minute bout requirement from 9.7% to 44.8%. Additionally, no differences in the patterns of meeting the PA recommendation using bouted or non-bouted data were observed across age groups, sex, ethnicity and race, or BMI category.Note 23 This finding contrasts another analysis of US data from the 2017 Behavioral Risk Factor Surveillance System that found that the removal of the bout requirement had little effect on overall PA estimates using self-reported data.Note 24 Additionally, comparable characteristics of meeting the bouted and non-bouted definitions for sex, age group, race and ethnicity, education level, and census region were found. This result suggests that the removal of the bout requirement may have less of an impact when examining self-reported data compared with accelerometer data.
The removal of the 10-minute bout stipulation in the newly released Canadian, US and WHO PA recommendations poses a challenge for PA surveillance. For example, there may be a perception that insufficient PA is less of a concern because of an increase in adherence that has resulted from a change in the definition of how guideline adherence is operationalized (i.e., removal of 10-minute bouts), rather than to actual behavioural change. “As guidelines change, population surveillance systems must adapt to provide relevant and useful knowledge.”Note 25 The objective of this study was to better understand if the removal of the bout requirement would result in a different segment of the population being categorized as meeting the PA recommendation. Based on this analysis of device-based data, the use of the non-bouted data classified a relatively similar population, in terms of sociodemographics and health and fitness indicators, as meeting the PA recommendation as bouted data. While the non-bouted recommendation captured a population with lower volumes of total MVPA, it appeared to capture a population with greater total movement (i.e., daily step counts and LPA). Research largely based on accelerometers has revealed that any amount of MVPA contributes to health benefits associated with the accumulation of total volumes of PA.Note 7Note 26Note 27Note 28 The removal of the 10-minute bout requirement is based on mounting evidence that shows a positive linear relationship between all minutes of device-assessed MVPA and good health.Note 7Note 26Note 27Note 28 Since the publication of the updated 2018 Physical Activity Guidelines for Americans, there has been an emergence of large epidemiologic studiesNote 12Note 29 and meta-analysesNote 30Note 31 that continue to support the removal of the 10-minute bout requirement—though all are based on studies that measured PA using accelerometry.
Some have called for a re-examination of the messaging around the 150-minutes-per-week threshold given that the evidence base used to inform the recommendation was largely from studies that measured PA using self-reported instruments. It is likely that the recommendation would be lower if objectively measured PA made up the majority of the evidence informing the recommendation.Note 32 Others have commented that the evaluation of PA recommendation adherence with accelerometer data is inappropriate since the metrics used to develop the recommendation differ conceptually from device-based measures of MVPA.Note 33 Much of the historical evidence supporting the ≥ 150-minutes-per-week threshold was based on self-reported PA data.Note 7Note 32 While the idea of developing a recommendation based on device measures has been suggested,Note 25 a single PA recommendation with guidance on surveillance thresholds using device measures may be more feasible for public health messaging. Although, assessing PA using both device and self-report measures contributes to our understanding of PA behaviours and their relationships with health by providing complimentary information.Note 34 Accelerometers provide a robust quantification of movement at various intensities, while questionnaire data are important for understanding the contexts within which individuals are active.
Strengths and limitations
The strengths of this study include the use of a large, nationally representative sample of Canadian adults with accelerometer-measured PA and a diverse set of objective and self-reported indicators of health and fitness. All comparison groups were mutually exclusive of each other to ensure effects were independent. While associations between meeting the bouted and only non-bouted recommendation and health outcomes were adjusted for age, sex, smoking and household education, it is possible that results are influenced by residual confounding from variables not included in the regression models. This study is cross-sectional and, as such, is unable to examine causal associations between meeting the PA recommendation using bouted versus non-bouted data and indicators of health and fitness. Longitudinal studies are needed to assess causality.
Conclusion
The use of the non-bouted accelerometer data more than doubled the proportion of Canadian adults meeting the PA recommendation of 150 minutes or more per week of MVPA. Findings from this study suggest that the removal of the 10-minute bout requirement from the previous recommendation captures a segment of the population with relatively similar sociodemographic and health profiles. Results help inform Canadian and global surveillance by informing the transition to reporting non-bouted PA. This information is critical to understanding observed results across the population and trends over time, as well as for the development of effective policies, programs and interventions.
Acknowledgements
The content and views expressed in this article are those of the authors and do not necessarily reflect those of the Government of Canada.
Appendix
| Comparison 1 | Comparison 2 | Comparison 3 | ||||||||||||||||||||||
|---|---|---|---|---|---|---|---|---|---|---|---|---|---|---|---|---|---|---|---|---|---|---|---|---|
| Met bouted | Met only non-bouted | Met bouted | Did not meet bouted | Met non-bouted | Did not meet non-bouted | |||||||||||||||||||
| number | % | 95% Confidence interval |
number | % | 95% Confidence interval |
number | % | 95% Confidence interval |
number | % | 95% Confidence interval |
number | % | 95% Confidence interval |
number | % | 95% Confidence interval |
|||||||
| Lower | Upper | Lower | Upper | Lower | Upper | Lower | Upper | Lower | Upper | Lower | Upper | |||||||||||||
| Age | ||||||||||||||||||||||||
| 18 to 64 years | 1,063 | 86.5 | 84.2 | 86.7 | 1,565 | 95.5Note * | 94.3 | 96.6 | 1,063 | 86.5 | 84.2 | 88.7 | 4,748 | 85.3 | 84.3 | 86.2 | 2,628 | 91.8 | 90.7 | 92.8 | 3,183 | 80.3Note * | 78.6 | 82.0 |
| 65 years and older | 226 | 13.5 | 11.3 | 15.8 | 107 | 4.5Note * | 3.4 | 5.7 | 226 | 13.5 | 11.3 | 15.8 | 1,065 | 14.7 | 13.8 | 15.7 | 333 | 8.2 | 7.2 | 9.3 | 958 | 19.7Note * | 18.0 | 21.4 |
| Sex | ||||||||||||||||||||||||
| Female | 643 | 49.5 | 44.2 | 54.8 | 986 | 58.0Note * | 53.3 | 62.7 | 643 | 49.5 | 44.2 | 54.8 | 2,948 | 50.7 | 49.5 | 52.0 | 1,329 | 45.0 | 41.7 | 48.4 | 2,262 | 55.0Note * | 52.1 | 57.9 |
| Male | 646 | 50.5 | 45.2 | 55.8 | 686 | 42.0Note * | 37.3 | 46.7 | 646 | 50.5 | 45.2 | 55.8 | 2,865 | 49.3 | 48.0 | 50.5 | 1,632 | 55.0 | 51.6 | 58.3 | 1,879 | 45.00Note * | 42.1 | 47.9 |
| Marital status | ||||||||||||||||||||||||
| Married or common law | 812 | 59.2 | 53.8 | 64.5 | 1,162 | 59.1 | 54.1 | 64.2 | 812 | 59.2 | 53.8 | 64.5 | 4,077 | 64.6 | 62.0 | 67.3 | 1,974 | 59.2 | 55.9 | 62.4 | 2,915 | 67.3Note * | 64.0 | 70.5 |
| Single | 477 | 40.8 | 35.5 | 46.2 | 508 | 40.9 | 35.8 | 45.9 | 477 | 40.8 | 35.5 | 46.2 | 1,731 | 35.4 | 32.7 | 38.0 | 985 | 40.8 | 37.6 | 44.1 | 1,223 | 32.7Note * | 29.5 | 36.0 |
| Immigration status | ||||||||||||||||||||||||
| Landed immigrant | 307 | 26.9 | 20.2 | 33.6 | 423 | 28.6 | 21.2 | 36.0 | 307 | 26.9 | 20.2 | 33.6 | 1,431 | 26.9 | 20.7 | 33.0 | 730 | 27.9 | 21.6 | 34.2 | 1,008 | 26.1 | 19.9 | 32.2 |
| Non-immigrant | 982 | 73.1 | 66.4 | 79.8 | 1,249 | 71.4 | 64.0 | 78.8 | 982 | 73.1 | 66.4 | 79.5 | 4,380 | 73.1 | 67.0 | 79.3 | 2,127 | 94.5 | 91.7 | 97.2 | 3,131 | 73.9 | 67.8 | 80.1 |
| Indigenous status | ||||||||||||||||||||||||
| Indigenous | 45 | 5.2Note E: Use with caution | 2.1 | 8.4 | 55 | 5.7Note E: Use with caution | 1.9 | 9.6 | 45 | 5.2Note E: Use with caution | 2.1 | 8.4 | 223 | 5.4 | 3.8 | 7.0 | 100 | 5.5Note E: Use with caution | 2.8 | 8.3 | 168 | 5.3Note E: Use with caution | 3.3 | 7.3 |
| Non-Indigenous | 937 | 94.8 | 91.6 | 97.9 | 1,190 | 94.3 | 90.4 | 98.1 | 937 | 94.8 | 91.6 | 97.9 | 4,172 | 94.6 | 93.0 | 96.2 | 2,127 | 94.5 | 91.7 | 97.2 | 2,982 | 94.7 | 92.7 | 96.7 |
| Education level | ||||||||||||||||||||||||
| Some postsecondary or less | 151 | 15.2 | 11.4 | 19.0 | 189 | 13.1 | 10.3 | 15.8 | 151 | 15.2 | 11.4 | 19.0 | 906 | 17.8 | 15.8 | 19.8 | 340 | 13.9 | 11.5 | 16.3 | 717 | 20.1Note * | 17.5 | 22.7 |
| Postsecondary graduate | 1,113 | 84.8 | 81.0 | 88.6 | 1,450 | 86.9 | 84.2 | 89.7 | 1,113 | 84.8 | 81.0 | 88.6 | 4,761 | 82.2 | 80.2 | 84.2 | 2,563 | 86.1 | 83.7 | 88.5 | 3,311 | 79.9Note * | 77.3 | 82.5 |
| Smoking status | ||||||||||||||||||||||||
| Smoker | 140 | 11.8 | 8.1 | 15.4 | 225 | 15.2 | 11.5 | 18.8 | 140 | 11.8 | 8.1 | 15.4 | 915 | 17.3Note * | 15.7 | 19.0 | 365 | 13.8 | 11.1 | 16.4 | 690 | 18.4Note * | 16.1 | 20.7 |
| Non-smoker | 1,148 | 88.2 | 84.6 | 91.9 | 1,444 | 84.8 | 81.2 | 88.5 | 1,148 | 88.2 | 84.6 | 91.9 | 4,880 | 82.7Note * | 81.0 | 84.3 | 2,592 | 86.2 | 83.6 | 88.9 | 3,436 | 81.6Note * | 79.3 | 83.9 |
E use with caution
|
||||||||||||||||||||||||
| Comparison 1 | Comparison 2 | Comparison 3 | ||||||||||||||||||||||
|---|---|---|---|---|---|---|---|---|---|---|---|---|---|---|---|---|---|---|---|---|---|---|---|---|
| Met bouted | Met only non-bouted | Met bouted | Did not meet bouted | Met non-bouted | Did not meet non-bouted | |||||||||||||||||||
| number | mean or % |
95% Confidence interval |
number | mean or % |
95% Confidence interval |
number | mean or % |
95% Confidence interval |
number | mean or % |
95% Confidence interval |
number | mean or % |
95% Confidence interval | number | mean or % |
95% Confidence interval |
|||||||
| Lower | Upper | Lower | Upper | Lower | Upper | Lower | Upper | Lower | Upper | Lower | Upper | |||||||||||||
| Screen time guideline adherence | ||||||||||||||||||||||||
| Not meeting guideline, > 3 hours per day | 511 | 42.1 | 35.7 | 48.4 | 554 | 37.8 | 32.4 | 43.2 | 511 | 42.1 | 35.7 | 48.4 | 2,175 | 40.8 | 38.0 | 43.6 | 1,065 | 39.5 | 35.3 | 43.8 | 1,621 | 42.3 | 39.0 | 45.6 |
| Meeting guidelines (≤ 3 hours per day) | 778 | 57.9 | 51.6 | 64.3 | 1,118 | 62.2 | 56.8 | 67.6 | 778 | 57.9 | 51.6 | 64.3 | 3,638 | 59.2 | 56.4 | 62.0 | 1,896 | 60.5 | 56.2 | 64.7 | 2,520 | 57.7 | 54.4 | 61.0 |
| Sedentary time guideline adherence | ||||||||||||||||||||||||
| Not meeting guideline (> 9 hours per day) | 703 | 54.9 | 49.1 | 60.7 | 1,042 | 64.5Note * | 59.9 | 69.0 | 703 | 54.9 | 49.1 | 60.7 | 4,239 | 73.0Note * | 70.5 | 75.5 | 1,745 | 60.6 | 57.2 | 63.9 | 3,197 | 77.1Note * | 74.4 | 79.9 |
| Meeting guideline (≤ 9 hours per day) | 586 | 45.1 | 39.3 | 50.9 | 630 | 35.5Note * | 31.0 | 40.1 | 586 | 45.1 | 39.3 | 50.9 | 1,574 | 27.0Note * | 24.5 | 29.5 | 1,216 | 39.4 | 36.1 | 42.8 | 944 | 22.9Note * | 20.1 | 25.6 |
| Self-reported physical activity, minutes per week | ||||||||||||||||||||||||
| Transportation | 1,289 | 149.7 | 129.4 | 170.0 | 1,672 | 101.6Note * | 78.7 | 124.6 | 1,289 | 149.7 | 129.4 | 170.0 | 5,813 | 71.1Note * | 57.2 | 85.1 | 2,961 | 121.2 | 103.9 | 138.6 | 4,141 | 56.2Note * | 39.5 | 72.9 |
| Recreation | 1,289 | 166.8 | 147.1 | 186.4 | 1,672 | 121.5Note * | 103.4 | 139.7 | 1,289 | 166.8 | 147.1 | 186.4 | 5,813 | 96.4Note * | 83.1 | 109.8 | 2,961 | 140.0 | 123.6 | 156.4 | 4,141 | 84.2Note * | 66.7 | 101.6 |
| Household and occupation | 1,289 | 88.8 | 66.2 | 111.4 | 1,672 | 153.4 | 98.8 | 208.0 | 1,289 | 88.8 | 66.2 | 111.4 | 5,813 | 158.0 | 131.2 | 184.7 | 2,961 | 127.0 | 92.7 | 161.4 | 4,141 | 160.2 | 133.4 | 186.9 |
| Total | 1,289 | 405.3 | 374.5 | 436.0 | 1,672 | 376.6Note * | 311.3 | 441.8 | 1,289 | 405.3 | 374.5 | 436.0 | 5,813 | 325.5Note * | 288.5 | 362.5 | 2,961 | 388.3 | 344.9 | 431.6 | 4,141 | 300.5Note * | 265.5 | 335.5 |
| Accelerometer-measured physical activity | ||||||||||||||||||||||||
| Steps per day (number) | 1,284 | 11,883 | 11,477 | 12,288 | 1,667 | 9,764Note * | 9,401 | 10,128 | 1,284 | 11,883 | 11,477 | 12,288 | 5,798 | 7,545Note * | 7,287 | 7,804 | 2,951 | 10,626 | 10,318 | 10,935 | 4,131 | 6460.0Note * | 6,203 | 6,716 |
| Light intensity physical activity, minutes per day | 1,289 | 213.1 | 205.5 | 220.8 | 1,672 | 233.3Note * | 223.6 | 242.9 | 1,289 | 213.1 | 205.5 | 220.8 | 5,813 | 213.6 | 207.5 | 219.7 | 2,961 | 225.1 | 218.3 | 231.8 | 4,141 | 203.9Note * | 197.3 | 210.6 |
| Moderate intensity physical activity, minutes per day | 1,289 | 48.5 | 46.1 | 51.0 | 1,672 | 30.6Note * | 29.5 | 31.7 | 1,289 | 48.5 | 46.1 | 51.0 | 5,813 | 16.1Note * | 15.1 | 17.1 | 2,961 | 37.9 | 36.6 | 39.2 | 4,141 | 9.0Note * | 8.5 | 9.5 |
| Vigorous intensity physical activity, minutes per day | 1,289 | 13.2 | 11.7 | 14.7 | 1,672 | 3.9Note * | 3.6 | 4.3 | 1,289 | 13.2 | 11.7 | 14.7 | 5,813 | 1.6Note * | 1.4 | 1.9 | 2,961 | 7.7 | 7.0 | 8.4 | 4,141 | 0.5Note * | 0.4 | 0.6 |
|
||||||||||||||||||||||||
| Comparison 1 | Comparison 2 | Comparison 3 | ||||||||||||||||||||||
|---|---|---|---|---|---|---|---|---|---|---|---|---|---|---|---|---|---|---|---|---|---|---|---|---|
| Met bouted | Met only non-bouted | Met bouted | Did not meet bouted | Met non-bouted | Did not meet non-bouted | |||||||||||||||||||
| number | mean or % |
95% Confidence interval |
number | mean or % |
95% Confidence interval |
number | mean or % |
95% Confidence interval |
number | mean or % |
95% Confidence interval |
number | mean or % |
95% Confidence interval |
number | mean or % |
95% Confidence interval |
|||||||
| Lower | Upper | Lower | Upper | Lower | Upper | Lower | Upper | Lower | Upper | Lower | Upper | |||||||||||||
| Waist circumference | ||||||||||||||||||||||||
| At risk (male ≥ 102.0, female ≥88.0 cm) | 398 | 30.8 | 25.9 | 35.6 | 484 | 26.9 | 22.7 | 31.1 | 398 | 30.8 | 25.9 | 35.6 | 2,585 | 43.8Appendix Table A.3 Note † Appendix Table A.3 Note †† | 40.2 | 47.4 | 882 | 28.5 | 24.9 | 32.2 | 2,101 | 52.1Appendix Table A.3 Note † Appendix Table A.3 Note †† | 48.3 | 55.8 |
| Low risk WC (male < 102.0, female < 88.0 cm) | 887 | 69.2 | 64.4 | 74.1 | 1,176 | 73.1 | 68.9 | 77.3 | 887 | 69.2 | 64.4 | 74.1 | 3,182 | 56.2Appendix Table A.3 Note † Appendix Table A.3 Note †† | 52.6 | 59.8 | 2,063 | 71.5 | 67.8 | 75.1 | 2,006 | 47.9Appendix Table A.3 Note † Appendix Table A.3 Note †† | 44.2 | 51.7 |
| Body mass index | ||||||||||||||||||||||||
| Underweight or normal BMI (< 25.0 kg/m2) | 628 | 48.3 | 43.3 | 53.3 | 730 | 50.6 | 45.6 | 55.6 | 628 | 48.3 | 43.3 | 53.3 | 2,012 | 37.2Appendix Table A.3 Note † Appendix Table A.3 Note †† | 33.9 | 40.4 | 1,358 | 49.7 | 46.5 | 52.8 | 1,282 | 30.6Appendix Table A.3 Note † Appendix Table A.3 Note †† | 27.6 | 33.5 |
| Overweight or obese BMI (≥ 25.0 kg/m2) | 656 | 51.7 | 46.7 | 56.7 | 933 | 49.4 | 44.4 | 54.4 | 656 | 51.7 | 46.7 | 56.7 | 3,752 | 62.8Appendix Table A.3 Note † Appendix Table A.3 Note †† | 59.6 | 66.1 | 1,589 | 50.3 | 47.2 | 53.5 | 2,819 | 69.4Appendix Table A.3 Note † Appendix Table A.3 Note †† | 66.5 | 72.4 |
| Chronic conditions | ||||||||||||||||||||||||
| < 2 chronic conditions | 1,192 | 93.6 | 91.9 | 95.4 | 1,577 | 94.5 | 92.2 | 96.7 | 1,192 | 93.6 | 91.9 | 95.4 | 5,120 | 89.4Appendix Table A.3 Note † Appendix Table A.3 Note †† | 87.5 | 91.2 | 2,769 | 94.1 | 92.5 | 95.7 | 3,543 | 86.9Appendix Table A.3 Note † Appendix Table A.3 Note †† | 84.3 | 89.5 |
| 2 or more conditions | 97 | 6.4 | 4.6 | 8.1 | 95 | 5.5Note E: Use with caution | 3.3 | 7.8 | 97 | 6.4 | 4.6 | 8.1 | 693 | 10.6Appendix Table A.3 Note † Appendix Table A.3 Note †† | 8.8 | 12.5 | 192 | 5.9 | 4.3 | 7.5 | 598 | 13.1Appendix Table A.3 Note † Appendix Table A.3 Note †† | 10.5 | 15.7 |
| Self-reported mental health | ||||||||||||||||||||||||
| Excellent or very good mental health | 926 | 68.9 | 64.3 | 73.6 | 1,152 | 64.2 | 58.4 | 97.0 | 926 | 68.9 | 64.3 | 73.6 | 3,932 | 66.0 | 62.8 | 69.2 | 2,078 | 66.1 | 62.6 | 69.6 | 2,780 | 66.9 | 63.2 | 70.5 |
| Good, fair or poor mental health | 353 | 31.1 | 26.4 | 35.7 | 516 | 35.8 | 30.0 | 41.6 | 353 | 31.1 | 26.4 | 35.7 | 1,862 | 34.0 | 30.8 | 37.2 | 869 | 33.9 | 30.4 | 37.4 | 1,346 | 33.1 | 29.5 | 36.8 |
| Self-reported general health | ||||||||||||||||||||||||
| Excellent or very good general health | 870 | 61.7 | 56.5 | 66.9 | 1,013 | 57.9 | 52.8 | 63.0 | 870 | 61.7 | 56.5 | 66.9 | 3,083 | 51.5Appendix Table A.3 Note † Appendix Table A.3 Note †† | 48.7 | 54.3 | 1,883 | 59.5 | 55.7 | 63.2 | 2,070 | 48.4Appendix Table A.3 Note † Appendix Table A.3 Note †† | 45.0 | 51.8 |
| Good, fair or poor health | 419 | 38.3 | 33.1 | 43.5 | 659 | 42.1 | 37.0 | 47.2 | 419 | 38.3 | 33.1 | 43.5 | 2,729 | 48.5Appendix Table A.3 Note † Appendix Table A.3 Note †† | 45.7 | 51.3 | 1,078 | 40.5 | 36.8 | 44.3 | 2,070 | 51.6Appendix Table A.3 Note † Appendix Table A.3 Note †† | 48.2 | 55.0 |
| Blood pressure (BP) > 140/90 or self-report medication) | ||||||||||||||||||||||||
| Hypertensive | 222 | 16.8 | 13.4 | 20.2 | 196 | 10.8Appendix Table A.3 Note § Appendix Table A.3 Note †† | 7.9 | 13.7 | 222 | 16.8 | 13.4 | 20.2 | 1,295 | 21.6Appendix Table A.3 Note § Appendix Table A.3 Note †† | 19.2 | 24.1 | 418 | 13.2 | 10.9 | 15.5 | 1,099 | 27Appendix Table A.3 Note † Appendix Table A.3 Note †† | 24.2 | 29.7 |
| Normal blood pressure | 1,061 | 83.2 | 79.8 | 86.6 | 1,473 | 89.2Appendix Table A.3 Note § Appendix Table A.3 Note †† | 86.3 | 92.1 | 1,061 | 83.2 | 79.8 | 86.6 | 4,497 | 78.4Appendix Table A.3 Note § Appendix Table A.3 Note †† | 75.9 | 80.8 | 2,534 | 86.8 | 84.5 | 89.1 | 3,024 | 73Appendix Table A.3 Note † Appendix Table A.3 Note †† | 70.3 | 75.8 |
| High cholesterol (self-reported high cholesterol or TC:HDL ratio > 5) | ||||||||||||||||||||||||
| High cholesterol | 238 | 18.1 | 14.8 | 21.4 | 266 | 15.6 | 12.5 | 18.8 | 238 | 18.1 | 14.8 | 21.4 | 1,273 | 22.5Appendix Table A.3 Note § Appendix Table A.3 Note †† | 20.2 | 24.8 | 504 | 16.7 | 14.9 | 18.4 | 1,007 | 25.8Appendix Table A.3 Note § Appendix Table A.3 Note †† | 22.6 | 29.0 |
| Healthy cholesterol | 971 | 81.9 | 78.6 | 85.2 | 1,293 | 84.4 | 81.2 | 87.5 | 971 | 81.9 | 78.6 | 85.2 | 4,155 | 77.5Appendix Table A.3 Note § Appendix Table A.3 Note †† | 75.2 | 79.8 | 2,264 | 83.3 | 81.6 | 85.1 | 2,862 | 74.2Appendix Table A.3 Note § Appendix Table A.3 Note †† | 71.0 | 77.4 |
| Diabetes (HbA1c > 6.5 or self-report) | ||||||||||||||||||||||||
| Diabetic | 60 | 4.9Note E: Use with caution | 2.4 | 7.4 | 65 | 3.4Note E: Use with caution | 2.0 | 4.8 | 60 | 4.9Note E: Use with caution | 2.4 | 7.4 | 446 | 7.5Appendix Table A.3 Note § Appendix Table A.3 Note †† | 6.4 | 8.7 | 125 | 4.0 | 2.8 | 5.2 | 381 | 9.6Appendix Table A.3 Note † Appendix Table A.3 Note †† | 8.0 | 11.1 |
| Non-diabetic | 1,229 | 95.1 | 92.6 | 98.2 | 1,607 | 96.6 | 95.2 | 98.0 | 1,229 | 95.1 | 92.6 | 97.6 | 5,367 | 92.5Appendix Table A.3 Note § Appendix Table A.3 Note †† | 91.3 | 93.6 | 2,836 | 96.0 | 94.8 | 97.2 | 3,760 | 90.4Appendix Table A.3 Note † Appendix Table A.3 Note †† | 88.9 | 92.0 |
| Measures of fitness | ||||||||||||||||||||||||
| Grip strength, in kilograms | 1,270 | 70.1 | 68.1 | 72.2 | 1,651 | 76Appendix Table A.3 Note † Appendix Table A.3 Note †† | 73.3 | 78.7 | 1,270 | 70.1 | 68.1 | 72.2 | 5,707 | 71.9Appendix Table A.3 Note ‡ | 70.7 | 73.2 | 2,921 | 73.6 | 71.7 | 75.5 | 4,056 | 69.9Appendix Table A.3 Note † Appendix Table A.3 Note †† | 68.5 | 71.4 |
| Aerobic fitness, score | 680 | 359.9 | 345.9 | 373.9 | 925 | 380.3Appendix Table A.3 Note § Appendix Table A.3 Note †† | 370.9 | 389.6 | 680 | 359.9 | 345.9 | 373.9 | 2.594 | 345.6Appendix Table A.3 Note † Appendix Table A.3 Note †† | 339.6 | 351.7 | 1,605 | 372.9 | 364.9 | 380.9 | 1,669 | 322.8Appendix Table A.3 Note † Appendix Table A.3 Note †† | 315.8 | 329.8 |
| Sit-and-reach, in centimetres | 795 | 27.4 | 25.9 | 28.9 | 1,072 | 27.0 | 25.8 | 28.3 | 795 | 27.4 | 25.9 | 28.9 | 3,238 | 26.1 | 25.3 | 27.0 | 1,867 | 27.2 | 26.2 | 28.2 | 2,166 | 25.6Appendix Table A.3 Note † Appendix Table A.3 Note †† | 24.5 | 26.6 |
E use with caution
Sources: Statistics Canada, Canadian Health Measures Survey, Cycle 4 (2014 and 2015), Cycle 5 (2016 and 2017) and Cycle 6 (2018 and 2019). |
||||||||||||||||||||||||
- Date modified: