
Health Reports
Measuring progress in cancer survival across Canadian provinces: Extending the cancer survival index to further evaluate cancer control efforts

DOI: https://www.doi.org/10.25318/82-003-x202200600002-eng
Correction Notice
In the article “Measuring progress in cancer survival across Canadian provinces: Extending the cancer survival index to further evaluate cancer control efforts” published on June 15, 2022, an error was found in Table 2.
The following correction has been made:
In Table 2 , row titles under “Males” section, the provinces of New Brunswick, British Columbia and Manitoba were reversed.
In Table 2 , row titles under “Females” section, the provinces of Saskatchewan, Manitoba, New Brunswick were reversed.
Abstract
Background
A comprehensive evaluation of progress in cancer survival for all cancer types combined in Canada has recently been accomplished. An analogous evaluation across Canadian provinces has yet to be conducted.
Data and methods
Data from 1992 to 2017 are from the population-based Canadian Cancer Registry death-linked analytic file. Provincial cancer survival index (CSI) estimates were calculated as the weighted sum of the sex- and cancer-specific age-standardized provincial net survival estimates. Provincial sex-specific CSI estimates were calculated separately using sex-specific cancer type weights. Data availability (Quebec) and sufficiency (Prince Edward Island and the territories) issues precluded CSI calculations for all jurisdictions.
Results
For the most recent period, 2013 to 2017, the five-year CSI was highest in Ontario (64.1%) and Alberta (63.3%), and lowest in Nova Scotia (60.8%). Significant progress in the five-year CSI since the period from 1992 to 1996 was observed in each province; the largest increases occurred in Alberta (8.7 percentage points) and Ontario (8.6 percentage points). Alberta’s increase improved its relative provincial ranking from eighth to second. The influence of prostate cancer on provincial changes in the CSI since the period from 2003 to 2007 varied considerably from strongly counterproductive in New Brunswick, Saskatchewan and Nova Scotia because of decreasing prostate cancer survival, to strongly productive in Manitoba.
Interpretation
Significant progress has been made in five-year cancer survival for all cancers combined since the early 1990s in each Canadian province studied. However, the magnitude of the progress has not been uniform across the provinces, and the cancer and sex combinations that have most influenced it have varied by province and period.
Key words
all cancers, cancer survival index, malignant neoplasms, population surveillance, registries, survival analysis
Author
Larry F. Ellison (larry.ellison@statcan.gc.ca) is with the Centre for Population Health Data at Statistics Canada, Ottawa, Ontario.
What is already known on this subject?
- Public health professionals and policy makers often desire an overall summary measure of progress in cancer survival to assist them in evaluating the effectiveness of cancer control plans. The cancer survival index (CSI) has become the preferred metric for this purpose.
- Using the CSI, a recent study reported that relatively steady progress has been made in five-year cancer survival in Canada for all cancers combined since the early 1990s.
- A comprehensive evaluation of progress in cancer survival for all cancer types combined has not previously been conducted at the provincial level for Canada.
What does this study add?
- Significant progress in the five-year CSI was observed in each Canadian province studied. Alberta and Ontario experienced the largest increases since the early 1990s, of 8.7 and 8.6 percentage points, respectively.
- Progress in the CSI has not been uniform across the provinces, and there are currently significant differences in CSI estimates between some provinces. The five-year CSI is currently highest in Ontario (64.1%) and lowest in Nova Scotia (60.8%).
- The increase in Alberta’s CSI over the study period improved its relative provincial ranking from the lowest, at eighth, to second. Ontario’s increase improved its ranking from fifth to first. The relative rankings of Newfoundland and Labrador, and Saskatchewan both dropped three places.
- The cancer and sex combinations that most influenced changes in the CSI since the period from 1992 to 1996 were generally female breast cancer and prostate cancer, though results varied by province. More recently, it has generally been male and female lung and bronchus cancer, followed by prostate cancer, the impact of which varied considerably by province.
- Continued monitoring of the CSI, on both the national and provincial levels, is recommended to help measure ongoing progress in the diagnosis and management of cancer in Canada.
Introduction
When combined with other metrics, population-based cancer survival estimates provide an indication of progress in cancer control.Note 1 Important insight can be gained by studying and tracking improvements in survival on a cancer-by-cancer basis. Nonetheless, public health professionals and policy makers often desire an overall summary measure of progress in cancer survival to assist them in evaluating the effectiveness of cancer control plans. For this purpose, the recently developed cancer survival index (CSI) has become the preferred measure.Note 2Note 3Note 4Note 5Note 6 In addition to age, it adjusts for the potential confounding effects of changes in the distribution of incident cancer cases by cancer type (case-mix) and for sex, whether over time within a population or between populations during a given time period.
An evaluation of progress in cancer survival in Canada for all cancer types combined was recently conducted using the CSI.Note 2 This study reported that relatively steady progress has been made in overall five-year cancer survival since the early 1990s—the earliest years of data collection for the Canadian Cancer Registry (CCR).Note 7 By examining the component contributions to the CSI, it was revealed that female breast, prostate and female lung and bronchus (lung) were the most consequential cancer and sex combinations on progress. Analogous provincial-level analyses would extend knowledge on the progress of cancer survival in Canada to a more detailed geographic level, but have yet to be published.
The current study provides a comprehensive evaluation of provincial-level progress in cancer survival for all cancer types combined in Canada. Specifically, predicted CSI estimates for the five-year period from 2013 to 2017 are compared across provinces, and within provinces across time, dating as far back as the period from 1992 to 1996. Comparisons are made for males and females jointly and separately. Further insight is provided by the province-specific determination of the most influential cancer and sex combinations, in regard to changes in the CSI over time.
Data and methods
Data sources and definitions
Canadian Cancer Registry death-linked analytic file
The data source was a pre-existing analytic file created by linking CCR cases diagnosed from 1992 to 2017 to mortality information complete through December 31, 2017, via Statistics Canada’s Social Data Linkage Environment.Note 8 The mortality information was obtained from the CCR itself, the Canadian Vital Statistics Death database and the T1 personal master file (as reported on tax returns). The advantages of integrating death information on tax returns has been explained elsewhere.Note 2 The analytic file followed the multiple primary coding rules of the International Agency for Research on Cancer (IARC).Note 9 Cases were defined based on the International Classification of Diseases for Oncology, Third Edition,Note 10 and classified using Surveillance, Epidemiology, and End Results (SEER) Program grouping definitions.Note 11
Expected survival
Expected survival probabilities, necessary for the calculation of net survival (NS) in a relative-survival framework, were obtained from sex-specific complete annual provincial life tables.Note 12 Expected survival probabilities used in the calculation of NS for prostate and female breast cancer were adjusted for cancer-specific mortality rates in the general population.Note 13Note 14Note 15 More detail on the general approach for this adjustment can be found elsewhere.Note 16
Inclusion and exclusions
All new primary cancers diagnosed in individuals aged 15 to 99 were initially included. Ages 15 to 19 were excluded for cancers of the bones and joints because they tend to more closely resemble cancers diagnosed among children than adults.Note 17 Cases from Quebec were excluded because cancer incidence data from this province had not been submitted to the CCR since the 2010 data year. Cases from Prince Edward Island and the three territories were excluded because there were insufficient data to create CSIs comparable to the other provinces for these lightly populated jurisdictions. Next, cases with an undefined survival time—specifically, those for which the diagnosis had been established through autopsy only or death certificate only, or for which a death had been established but the year of death was unknown—were excluded (1.5%). The dataset was then further restricted to first primary cancers per person, per cancer or cancer group,Note 18Note 19Note 20Note 21 resulting in an additional exclusion of 0.25% of cases.
Statistical analysis
Net survival
NS is used as the underlying measure of cancer survival. NS estimates were derived using an algorithmNote 22 that has been augmented by Ron Dewar of the Nova Scotia Cancer Care Program (Dewar R, 2020, email communication, June 22) to include the Pohar Perme estimator of NSNote 23 using the hazard transformation approach. NS is the preferred method for comparing cancer survival in population-based cancer studies because it adjusts for the fact that different populations may have different levels of background risk of death.Note 24
Calculating cancer survival index estimates
Provincial CSI estimates were calculated as the weighted sum of the unrounded sex- and cancer-specific age-standardized provincial NS estimates.Note 2Note 5 Sex-specific provincial CSI estimates were calculated separately as the weighted sum of the unrounded cancer-specific age-standardized provincial NS estimates for each sex. Provincial age-standardized NS estimates were calculated as the weighted sum of the age-specific provincial estimates for a given cancer. The 55 cancers included in the derivation of the Canadian CSINote 2 are herein encompassed in 22 cancer categories.
The set of 22 cancer categories was determined by an iterative procedure that sought to jointly optimize several factors. One main consideration was to maximize the number of cancer categories and minimize the cardinality of cancer groupings to enhance face validity and reduce the number of cases excluded as second or higher order cancers. A competing consideration was to ensure that the necessary input sex- and age group-specific survival estimates were calculable for each cancer, for nearly all provinces. Five-year periods were used to help facilitate these goals rather than the three-year periods used for the national CSI.Note 2
As a validation exercise, national (excluding Quebec) CSI estimates were calculated using the current set of weights based on 22 cancer categories and compared with previously published corresponding estimates based on 55 cancers.Note 2 The recalculated national estimates were maximally 0.15 percentage points higher in the period from 1992 to 1994, reducing to 0.03 in the period from 2015 to 2017 (data not shown). Among males, the difference diminished from 0.25 to 0.00 percentage points over the same period. Among females, the difference was a fairly consistent 0.05 percentage points throughout.
The 22 cancer categories are composed of 16 of the most commonly diagnosed cancers—including female breast cancer, which was considered separately from male breast cancer—as well as a cancer group for oral cavity and pharynx, and a group for leukemias. The remaining individual cancers were grouped into one of four “other” categories. The grouping was based on the predicted NS associated with these cancers (i.e., 70% or more, 50% to 69%, 20% to 49% and less than 20%) for Canada excluding Quebec, for the period from 2015 to 2017. This period was chosen because stability in the composition of the other categories into the future is desired, and estimates for the period from 2015 to 2017 most closely reflect the latest estimates currently available. Cancers such as that of the pancreas, liver, brain and esophagus, which are not necessarily uncommon, were not individually considered because CSI component survival estimates were unavailable in a varying number of places. While there were also missing survival estimates for myeloma, the nature and limited scope of the issue permitted a feasible solution. Specifically, national (Canada, excluding Quebec) sex-specific estimates of NS for myeloma for those aged 15 to 44 were used instead of corresponding provincial estimates.
Weights
The sex- and cancer-specific weights used in the construction of provincial CSI estimates (Table 1) were derived from the proportionate distribution of incident cases diagnosed from 2010 to 2014, using the IARC version of the CCR tabulation file (excluding cases diagnosed in Quebec) released on January 29, 2018. This version of the CCR file has previously been used to construct other CSI type weights,Note 2Note 25 as well as for the Canadian cancer survival standard weights.Note 16 For 16 cancers, the weights are identical to those used in the derivation of the national CSI estimates. Note, however, that the weights corresponding to corpus uteri and uterus not otherwise specified in Table 1 do not match those previously published.Note 2 While the correct weights were used in the national study, the weights for this cancer and other female genital organs were inadvertently displayed in an inverted fashion. The Canadian cancer survival standard weightsNote 16 were used for age-standardization where possible; otherwise, weights for cancer groups were specifically derived following the same methodology. See Appendix Table A.1.
| Cancer | Males and females jointly | Sex-specific | ||
|---|---|---|---|---|
| Male | Female | Male | Female | |
| Oral cavity and pharynx | 0.01676 | 0.00729 | 0.03258 | 0.01502 |
| Stomach | 0.01152 | 0.00637 | 0.02240 | 0.01312 |
| Colon | 0.04088 | 0.03899 | 0.07949 | 0.08027 |
| Rectum | 0.02505 | 0.01519 | 0.04870 | 0.03128 |
| Lung and bronchus | 0.06658 | 0.06265 | 0.12944 | 0.12900 |
| Melanoma of the skin | 0.02046 | 0.01751 | 0.03978 | 0.03606 |
| Female breast | Note ...: not applicable | 0.12772 | Note ...: not applicable | 0.26298 |
| Cervix uteri | Note ...: not applicable | 0.00791 | Note ...: not applicable | 0.01628 |
| Ovary | Note ...: not applicable | 0.01477 | Note ...: not applicable | 0.03040 |
| Corpus uteri and uterus not otherwise specified | Note ...: not applicable | 0.03200 | Note ...: not applicable | 0.06589 |
| Prostate | 0.12348 | Note ...: not applicable | 0.24008 | Note ...: not applicable |
| Bladder (including in situ) | 0.03639 | 0.01155 | 0.07076 | 0.02378 |
| Kidney and renal pelvis | 0.01891 | 0.01061 | 0.03677 | 0.02185 |
| Thyroid | 0.00793 | 0.02498 | 0.01541 | 0.05143 |
| Non-Hodgkin lymphoma | 0.02433 | 0.01987 | 0.04730 | 0.04091 |
| Multiple myeloma | 0.00813 | 0.00619 | 0.01581 | 0.01276 |
| Leukemias | 0.01691 | 0.01168 | 0.03288 | 0.02405 |
| Miscellaneous (including ill-defined and unknown primary sites) | 0.01937 | 0.01719 | 0.03765 | 0.03540 |
| Other cancers with high net survival (≥ 70%) | 0.01333 | 0.00481 | 0.02591 | 0.00991 |
| Other cancers with medium net survival (50% to 69%) | 0.01573 | 0.01561 | 0.03058 | 0.03213 |
| Other cancers with low net survival (20% to 49%) | 0.01864 | 0.00980 | 0.03625 | 0.02017 |
| Other cancers with very low net survival (< 20%) | 0.02994 | 0.02297 | 0.05821 | 0.04731 |
| Total | Note ...: not applicable | Note ...: not applicable | 1.00000 | 1.00000 |
|
... not applicable Notes: Cancers, including miscellaneous, were classified using Surveillance, Epidemiology, and End Results Program grouping definitions (Howlader N, Noone AM, Krapcho M, et al.). The categorization of "other cancers" into high, medium, low and very low net survival categories was based on predicted net survival for Canada, excluding Quebec, for the period from 2015 to 2017. Categories were high net survival: other non-epithelial skin, male breast, testis, other male genital organs, eye and orbit, Hodgkin lymphoma, Kaposi sarcoma; medium net survival: small intestine, anus, larynx, bones and joints, soft tissue (including heart), other female genital organs, penis, cranial nerves and other nervous system, other endocrine including thymus; low net survival: liver, other respiratory organs, ureter, other urinary organs, brain; very low net survival: esophagus, gallbladder, pancreas, other digestive organs, mesothelioma. The sum total of the weights in the two columns associated with males and females considered jointly is 1.00000. Source: Statistics Canada’s Canadian Cancer Registry International Agency for Research on Cancer multiple primary rules version tabulation file (1992 to 2015) released on January 29, 2018. |
||||
Measuring component contributions to changes in the cancer survival index over time
The component contribution of a sex- and cancer-specific combination to the overall change in the CSI over time was calculated as the product of the change in its sex- and cancer-specific age-standardized NS estimate and its corresponding CSI weight. The component percentage contribution of each sex- and cancer-specific combination to the overall change in the CSI over time was then determined as the absolute value of the quotient of the component sex- and cancer-specific combination contribution to the change, divided by the total change. Component percentage contributions must be non-negative and sum to 100%; however, if survival has decreased in the period under consideration for a given component, its percentage contribution to the change in the CSI will be counterproductive to the goal of improved overall survival.
Cancer survival index analyses
The period method was used to determine predicted five-year NS estimates for 2013 to 2017. The cohort method was used to derive non-predictive (actual) estimates of five-year NS from the periods from 1992 to 1996, to 2008 to 2012, using five-year overlapping periods. Time series of provincial estimates are displayed in two separate groups to avoid excessive overlay of results. CSI estimates for the five-year period from 2013 to 2017 are compared with corresponding estimates for the periods from 1992 to 1996 and from 2003 to 2007. Changes over time were calculated using unrounded CSI estimates and expressed as percentage point differences. The Z-test was used to determine P-values for differences between periods; the standard errors of differences were estimated by the square root of the sum of the variances associated with the two-point estimates. P-values correspond to two-sided tests of the null hypothesis that the change in CSI is zero, with a significance level of 0.05.
Results
Provincial five-year cancer survival index rankings for the most recent period
Survival highest in Ontario and Alberta
Predicted five-year CSI estimates for the period from 2013 to 2017 were highest in Ontario, at 64.1% (95% confidence interval [CI] = 63.9 to 64.2), followed by Alberta, at 63.3% (95% CI = 62.9 to 63.6) (Table 2). Ontario ranked first among males (62.2%, 95% CI = 62.0 to 62.4) and females (66.0%, 95% CI = 65.8 to 66.3). Alberta ranked second among females, at 65.4% (95% CI = 64.9 to 65.9). At 61.2% (95% CI = 60.7 to 61.7), it virtually tied with New Brunswick (61.0%, 95% CI = 60.0 to 61.9) for second among males. The lowest CSI point estimate was observed in Nova Scotia, at 60.8% (95% CI = 60.2 to 61.4), though this estimate was not statistically significantly different (p = 0.085) from the next lowest, in Saskatchewan (61.6%, 95% CI = 61.0 to 62.2).
| Sex / province | Time period | ||||||||||
|---|---|---|---|---|---|---|---|---|---|---|---|
| 2013 to 2017 | 1992 to 1996, to 2013 to 2017 | 2003 to 2007, to 2013 to 2017 | |||||||||
| Net CSI (%) |
95% Confidence interval |
Change (% points) |
95% Confidence interval |
P-value | Change (% points) |
95% Confidence interval |
P-value | ||||
| from | to | from | to | from | to | ||||||
| Both sexes | |||||||||||
| Ontario | 64.1 | 63.9 | 64.2 | 8.6 | 8.3 | 8.9 | < 0.001 | 3.1 | 2.9 | 3.4 | < 0.001 |
| Alberta | 63.3 | 62.9 | 63.6 | 8.7 | 8.1 | 9.3 | < 0.001 | 3.4 | 2.9 | 4.0 | < 0.001 |
| British Columbia | 62.5 | 62.3 | 62.8 | 6.1 | 5.7 | 6.6 | < 0.001 | 2.7 | 2.3 | 3.1 | < 0.001 |
| Manitoba | 62.2 | 61.6 | 62.8 | 6.0 | 5.1 | 6.9 | < 0.001 | 2.5 | 1.7 | 3.4 | < 0.001 |
| New Brunswick | 62.1 | 61.5 | 62.8 | 6.9 | 5.8 | 8.0 | < 0.001 | 1.1 | 0.1 | 2.1 | 0.027 |
| Newfoundland and Labrador | 61.8 | 60.9 | 62.6 | 5.8 | 4.3 | 7.3 | < 0.001 | 1.9 | 0.6 | 3.2 | 0.005 |
| Saskatchewan | 61.6 | 61.0 | 62.2 | 5.9 | 5.0 | 6.9 | < 0.001 | 2.0 | 1.2 | 2.9 | < 0.001 |
| Nova Scotia | 60.8 | 60.2 | 61.4 | 6.0 | 5.0 | 6.9 | < 0.001 | 1.1 | 0.2 | 2.0 | 0.013 |
| Males | |||||||||||
| Ontario | 62.2 | 62.0 | 62.4 | 9.0 | 8.6 | 9.5 | < 0.001 | 3.1 | 2.7 | 3.4 | < 0.001 |
| Alberta | 61.2 | 60.7 | 61.7 | 9.5 | 8.6 | 10.4 | < 0.001 | 3.5 | 2.7 | 4.2 | < 0.001 |
| New Brunswick | 61.0 | 60.0 | 61.9 | 7.3 | 5.7 | 8.9 | < 0.001 | 2.0 | 0.6 | 3.4 | 0.006 |
| British Columbia | 60.4 | 60.0 | 60.8 | 6.5 | 5.8 | 7.2 | < 0.001 | 2.9 | 2.3 | 3.6 | < 0.001 |
| Manitoba | 60.4 | 59.5 | 61.2 | 6.0 | 4.7 | 7.3 | < 0.001 | 3.2 | 1.9 | 4.4 | < 0.001 |
| Newfoundland and Labrador | 60.1 | 58.9 | 61.3 | 5.7 | 3.5 | 7.9 | < 0.001 | 2.0 | 0.1 | 3.9 | 0.037 |
| Saskatchewan | 58.9 | 58.1 | 59.8 | 6.4 | 5.0 | 7.8 | < 0.001 | 1.8 | 0.5 | 3.1 | 0.007 |
| Nova Scotia | 58.8 | 57.9 | 59.6 | 5.8 | 4.3 | 7.2 | < 0.001 | 0.7 | -0.6 | 2.0 | 0.266 |
| Females | |||||||||||
| Ontario | 66.0 | 65.8 | 66.3 | 8.2 | 7.8 | 8.6 | < 0.001 | 3.2 | 2.9 | 3.6 | < 0.001 |
| Alberta | 65.4 | 64.9 | 65.9 | 7.9 | 7.1 | 8.8 | < 0.001 | 3.4 | 2.6 | 4.1 | < 0.001 |
| British Columbia | 64.8 | 64.4 | 65.2 | 5.7 | 5.1 | 6.4 | < 0.001 | 2.5 | 1.9 | 3.1 | < 0.001 |
| Saskatchewan | 64.4 | 63.5 | 65.2 | 5.3 | 4.1 | 6.6 | < 0.001 | 2.3 | 1.1 | 3.6 | < 0.001 |
| Manitoba | 64.1 | 63.3 | 64.9 | 5.9 | 4.7 | 7.1 | < 0.001 | 1.8 | 0.7 | 3.0 | 0.002 |
| Newfoundland and Labrador | 63.6 | 62.4 | 64.7 | 5.9 | 3.9 | 7.9 | < 0.001 | 1.7 | -0.1 | 3.5 | 0.058 |
| New Brunswick | 63.3 | 62.4 | 64.2 | 6.6 | 5.0 | 8.1 | < 0.001 | 0.2 | -1.2 | 1.5 | 0.817 |
| Nova Scotia | 63.0 | 62.2 | 63.8 | 6.2 | 4.9 | 7.5 | < 0.001 | 1.5 | 0.3 | 2.7 | 0.012 |
|
Notes: CSI = cancer survival index. For each sex category, provinces are listed in descending order of CSI estimates for the period from 2013 to 2017. Quebec is excluded because cases diagnosed from 2011 onward have not been submitted to the Canadian Cancer Registry. There were insufficient data to create a comparable CSI for Prince Edward Island and for the three territories. CSI estimates for both sexes combined were calculated as a weighted average of sex- and cancer-specific age-standardized net survival estimates. Sex-specific CSI estimates were calculated as a weighted average of cancer-specific age-standardized net survival estimates for each sex separately. Sources: Statistics Canada, Canadian Cancer Registry death-linked file (1992 to 2017) and life tables. |
|||||||||||
Changes in provincial five-year cancer survival indexes over time
Cancer survival gains are largest in Alberta and Ontario
Whether males and females were considered jointly or separately, the five-year CSI increased for each province from the period from 1992 to 1996 to that from 2013 to 2017 (p < 0.001). The largest increases were observed for Alberta and Ontario, of 8.7 and 8.6 percentage points, respectively. Among males, Alberta’s five-year CSI increase of 9.5 percentage points over the entire study period was the largest observed, and Ontario’s increase of 9.0 percentage points was second largest. Among females, the order was reversed, with Ontario’s 8.2 percentage point increase first, and Alberta’s 7.9 percentage point increase second.
All provincial five-year CSI increases since the period from 2003 to 2007 were statistically significant, with the exception of males in Nova Scotia (p = 0.266) and females in New Brunswick (p = 0.817), and Newfoundland and Labrador (p = 0.058). Ontario and Alberta fared favourably relative to other provinces over this most recent period.
Changes in provincial five-year cancer survival index rankings over time
Alberta’s five-year CSI increase over the study period resulted in a considerable improvement in its relative provincial ranking, from eighth and lowest in the period from 1992 to 1996, to second in that from 2013 to 2017 (Figure 1). Ontario’s CSI increase over the same time improved the province’s ranking from fifth to first. The relative ranking of Newfoundland and Labrador dropped from third to sixth, while that of Saskatchewan also dropped three places, from fourth to seventh.
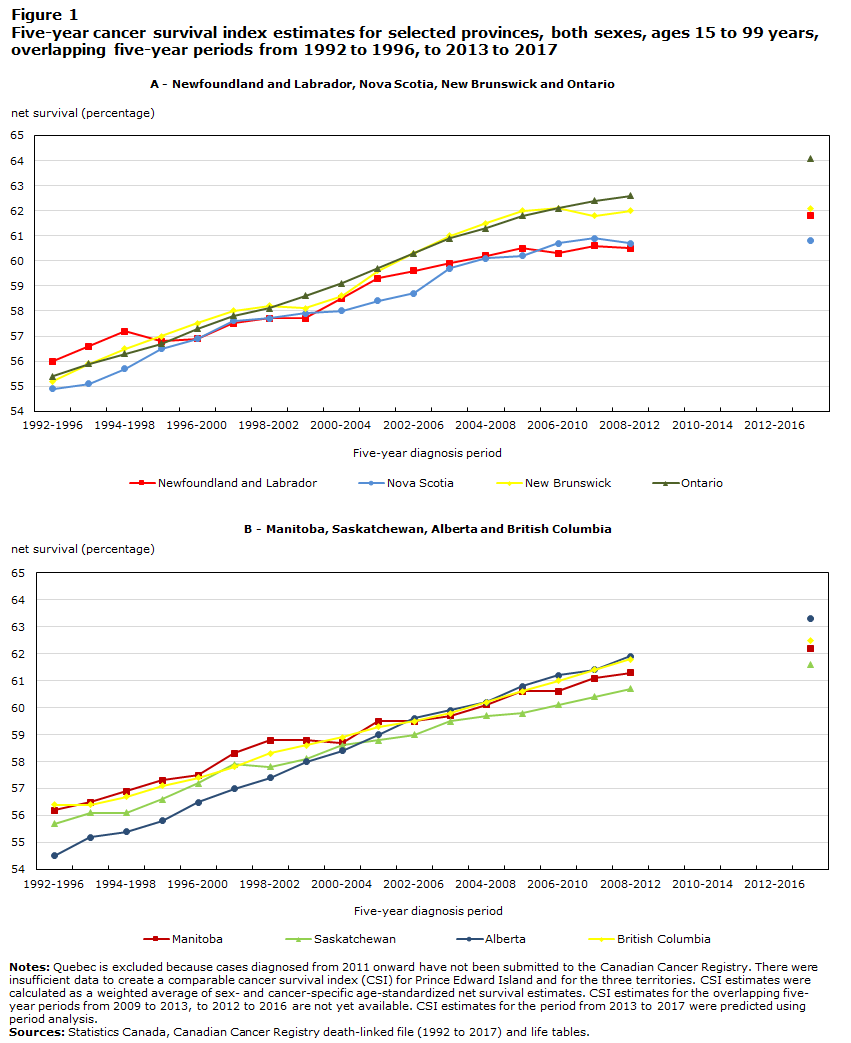
Description for Figure 1
| Five-year diagnosis period | Newfoundland and Labrador | Nova Scotia | New Brunswick | Ontario | Manitoba | Saskatchewan | Alberta | British Columbia | ||||||||||||||||
|---|---|---|---|---|---|---|---|---|---|---|---|---|---|---|---|---|---|---|---|---|---|---|---|---|
| net survival (percentage) | 95 percent confidence intervals - lower limit | 95 percent confidence intervals - upper limit | net survival (percentage) | 95 percent confidence intervals - lower limit | 95 percent confidence intervals - upper limit | net survival (percentage) | 95 percent confidence intervals - lower limit | 95 percent confidence intervals - upper limit | net survival (percentage) | 95 percent confidence intervals - lower limit | 95 percent confidence intervals - upper limit | net survival (percentage) | 95 percent confidence intervals - lower limit | 95 percent confidence intervals - upper limit | net survival (percentage) | 95 percent confidence intervals - lower limit | 95 percent confidence intervals - upper limit | net survival (percentage) | 95 percent confidence intervals - lower limit | 95 percent confidence intervals - upper limit | net survival (percentage) | 95 percent confidence intervals - lower limit | 95 percent confidence intervals - upper limit | |
| 1992 to 1996 | 56.0 | 54.7 | 57.2 | 54.9 | 54.1 | 55.7 | 55.2 | 54.3 | 56.1 | 55.4 | 55.2 | 55.7 | 56.2 | 55.5 | 56.9 | 55.7 | 54.9 | 56.4 | 54.5 | 54.0 | 55.1 | 56.4 | 56.0 | 56.8 |
| 1993 to 1997 | 56.6 | 55.3 | 57.8 | 55.1 | 54.3 | 55.9 | 55.9 | 55.1 | 56.8 | 55.9 | 55.6 | 56.1 | 56.5 | 55.8 | 57.1 | 56.1 | 55.4 | 56.8 | 55.2 | 54.7 | 55.7 | 56.4 | 56.1 | 56.8 |
| 1994 to 1998 | 57.2 | 55.9 | 58.4 | 55.7 | 54.9 | 56.4 | 56.5 | 55.6 | 57.3 | 56.3 | 56.0 | 56.5 | 56.9 | 56.2 | 57.5 | 56.1 | 55.4 | 56.9 | 55.4 | 54.9 | 55.9 | 56.7 | 56.3 | 57.1 |
| 1995 to 1999 | 56.8 | 55.6 | 58.0 | 56.5 | 55.8 | 57.2 | 57.0 | 56.2 | 57.8 | 56.7 | 56.5 | 57.0 | 57.3 | 56.6 | 57.9 | 56.6 | 55.9 | 57.4 | 55.8 | 55.4 | 56.3 | 57.1 | 56.7 | 57.5 |
| 1996 to 2000 | 56.9 | 55.7 | 58.1 | 56.9 | 56.2 | 57.6 | 57.5 | 56.6 | 58.3 | 57.3 | 57.1 | 57.6 | 57.5 | 56.9 | 58.2 | 57.2 | 56.5 | 57.9 | 56.5 | 56.1 | 57.0 | 57.4 | 57.1 | 57.8 |
| 1997 to 2001 | 57.5 | 56.3 | 58.7 | 57.6 | 56.9 | 58.3 | 58.0 | 57.2 | 58.8 | 57.8 | 57.5 | 58.0 | 58.3 | 57.6 | 59.0 | 57.9 | 57.2 | 58.6 | 57.0 | 56.5 | 57.4 | 57.8 | 57.5 | 58.2 |
| 1998 to 2002 | 57.7 | 56.5 | 58.9 | 57.7 | 57.0 | 58.3 | 58.2 | 57.4 | 59.0 | 58.1 | 57.8 | 58.3 | 58.8 | 58.1 | 59.4 | 57.8 | 57.1 | 58.5 | 57.4 | 57.0 | 57.9 | 58.3 | 57.9 | 58.6 |
| 1999 to 2003 | 57.7 | 56.5 | 58.9 | 57.9 | 57.2 | 58.5 | 58.1 | 57.3 | 58.9 | 58.6 | 58.4 | 58.8 | 58.8 | 58.1 | 59.4 | 58.1 | 57.4 | 58.8 | 58.0 | 57.5 | 58.4 | 58.6 | 58.3 | 58.9 |
| 2000 to 2004 | 58.5 | 57.3 | 59.6 | 58.0 | 57.3 | 58.7 | 58.6 | 57.8 | 59.3 | 59.1 | 58.9 | 59.3 | 58.7 | 58.1 | 59.3 | 58.6 | 58.0 | 59.3 | 58.4 | 58.0 | 58.9 | 58.9 | 58.5 | 59.2 |
| 2001 to 2005 | 59.3 | 58.2 | 60.4 | 58.4 | 57.7 | 59.0 | 59.6 | 58.8 | 60.3 | 59.7 | 59.4 | 59.9 | 59.5 | 58.9 | 60.2 | 58.8 | 58.2 | 59.5 | 59.0 | 58.5 | 59.4 | 59.3 | 58.9 | 59.6 |
| 2002 to 2006 | 59.6 | 58.5 | 60.7 | 58.7 | 58.1 | 59.4 | 60.3 | 59.6 | 61.1 | 60.3 | 60.1 | 60.5 | 59.5 | 58.9 | 60.2 | 59.0 | 58.3 | 59.6 | 59.6 | 59.2 | 60.0 | 59.5 | 59.1 | 59.8 |
| 2003 to 2007 | 59.9 | 58.9 | 60.9 | 59.7 | 59.1 | 60.4 | 61.0 | 60.3 | 61.7 | 60.9 | 60.7 | 61.1 | 59.7 | 59.1 | 60.3 | 59.5 | 58.9 | 60.2 | 59.9 | 59.5 | 60.2 | 59.8 | 59.5 | 60.1 |
| 2004 to 2008 | 60.2 | 59.2 | 61.1 | 60.1 | 59.4 | 60.7 | 61.5 | 60.8 | 62.2 | 61.3 | 61.1 | 61.5 | 60.1 | 59.5 | 60.7 | 59.7 | 59.1 | 60.4 | 60.2 | 59.8 | 60.6 | 60.2 | 59.9 | 60.5 |
| 2005 to 2009 | 60.5 | 59.6 | 61.4 | 60.2 | 59.6 | 60.8 | 62.0 | 61.3 | 62.7 | 61.8 | 61.6 | 62.0 | 60.6 | 60.0 | 61.2 | 59.8 | 59.1 | 60.4 | 60.8 | 60.4 | 61.2 | 60.6 | 60.3 | 60.9 |
| 2006 to 2010 | 60.3 | 59.4 | 61.2 | 60.7 | 60.1 | 61.3 | 62.1 | 61.4 | 62.8 | 62.1 | 61.9 | 62.3 | 60.6 | 60.0 | 61.2 | 60.1 | 59.5 | 60.7 | 61.2 | 60.8 | 61.6 | 61.0 | 60.7 | 61.3 |
| 2007 to 2011 | 60.6 | 59.7 | 61.4 | 60.9 | 60.3 | 61.5 | 61.8 | 61.1 | 62.5 | 62.4 | 62.2 | 62.6 | 61.1 | 60.5 | 61.7 | 60.4 | 59.8 | 61.1 | 61.4 | 61.0 | 61.7 | 61.4 | 61.1 | 61.7 |
| 2008 to 2012 | 60.5 | 59.6 | 61.3 | 60.7 | 60.1 | 61.3 | 62.0 | 61.3 | 62.7 | 62.6 | 62.5 | 62.8 | 61.3 | 60.7 | 61.9 | 60.7 | 60.1 | 61.3 | 61.9 | 61.5 | 62.2 | 61.8 | 61.5 | 62.1 |
| 2009 to 2013 | Note ..: not available for a specific reference period | Note ..: not available for a specific reference period | Note ..: not available for a specific reference period | Note ..: not available for a specific reference period | Note ..: not available for a specific reference period | Note ..: not available for a specific reference period | Note ..: not available for a specific reference period | Note ..: not available for a specific reference period | Note ..: not available for a specific reference period | Note ..: not available for a specific reference period | Note ..: not available for a specific reference period | Note ..: not available for a specific reference period | Note ..: not available for a specific reference period | Note ..: not available for a specific reference period | Note ..: not available for a specific reference period | Note ..: not available for a specific reference period | Note ..: not available for a specific reference period | Note ..: not available for a specific reference period | Note ..: not available for a specific reference period | Note ..: not available for a specific reference period | Note ..: not available for a specific reference period | Note ..: not available for a specific reference period | Note ..: not available for a specific reference period | Note ..: not available for a specific reference period |
| 2010 to 2014 | Note ..: not available for a specific reference period | Note ..: not available for a specific reference period | Note ..: not available for a specific reference period | Note ..: not available for a specific reference period | Note ..: not available for a specific reference period | Note ..: not available for a specific reference period | Note ..: not available for a specific reference period | Note ..: not available for a specific reference period | Note ..: not available for a specific reference period | Note ..: not available for a specific reference period | Note ..: not available for a specific reference period | Note ..: not available for a specific reference period | Note ..: not available for a specific reference period | Note ..: not available for a specific reference period | Note ..: not available for a specific reference period | Note ..: not available for a specific reference period | Note ..: not available for a specific reference period | Note ..: not available for a specific reference period | Note ..: not available for a specific reference period | Note ..: not available for a specific reference period | Note ..: not available for a specific reference period | Note ..: not available for a specific reference period | Note ..: not available for a specific reference period | Note ..: not available for a specific reference period |
| 2011 to 2015 | Note ..: not available for a specific reference period | Note ..: not available for a specific reference period | Note ..: not available for a specific reference period | Note ..: not available for a specific reference period | Note ..: not available for a specific reference period | Note ..: not available for a specific reference period | Note ..: not available for a specific reference period | Note ..: not available for a specific reference period | Note ..: not available for a specific reference period | Note ..: not available for a specific reference period | Note ..: not available for a specific reference period | Note ..: not available for a specific reference period | Note ..: not available for a specific reference period | Note ..: not available for a specific reference period | Note ..: not available for a specific reference period | Note ..: not available for a specific reference period | Note ..: not available for a specific reference period | Note ..: not available for a specific reference period | Note ..: not available for a specific reference period | Note ..: not available for a specific reference period | Note ..: not available for a specific reference period | Note ..: not available for a specific reference period | Note ..: not available for a specific reference period | Note ..: not available for a specific reference period |
| 2012 to 2016 | Note ..: not available for a specific reference period | Note ..: not available for a specific reference period | Note ..: not available for a specific reference period | Note ..: not available for a specific reference period | Note ..: not available for a specific reference period | Note ..: not available for a specific reference period | Note ..: not available for a specific reference period | Note ..: not available for a specific reference period | Note ..: not available for a specific reference period | Note ..: not available for a specific reference period | Note ..: not available for a specific reference period | Note ..: not available for a specific reference period | Note ..: not available for a specific reference period | Note ..: not available for a specific reference period | Note ..: not available for a specific reference period | Note ..: not available for a specific reference period | Note ..: not available for a specific reference period | Note ..: not available for a specific reference period | Note ..: not available for a specific reference period | Note ..: not available for a specific reference period | Note ..: not available for a specific reference period | Note ..: not available for a specific reference period | Note ..: not available for a specific reference period | Note ..: not available for a specific reference period |
| 2013 to 2017 | 61.8 | 60.9 | 62.6 | 60.8 | 60.2 | 61.4 | 62.1 | 61.5 | 62.8 | 64.1 | 63.9 | 64.2 | 62.2 | 61.6 | 62.8 | 61.6 | 61.0 | 62.2 | 63.3 | 62.9 | 63.6 | 62.5 | 62.3 | 62.8 |
|
.. not available for a specific reference period Notes: Quebec is excluded because cases diagnosed from 2011 onward have not been submitted to the Canadian Cancer Registry. There were insufficient data to create a comparable CSI for Prince Edward Island and for the three territories. Net cancer survival index (CSI) estimates were calculated as a weighted average of sex- and cancer-specific age-standardized net survival estimates. CSI estimates for the overlapping five-year periods from 2009 to 2013, to 2012 to 2016 are not yet available. CSI estimates for the period from 2013 to 2017 were predicted using period analysis. Sources: Statistics Canada, Canadian Cancer Registry death-linked file (1992 to 2017) and life tables. |
||||||||||||||||||||||||
Increases in survival among males in Alberta and Ontario since the early 1990s improved their CSI provincial relative rankings (Figure 2), identical to those described above for males and females considered jointly. Slightly less dramatic ranking improvements for these provinces were observed among females (Figure 3).

Description for Figure 2
| Five-year diagnosis period | Newfoundland and Labrador | Nova Scotia | New Brunswick | Ontario | Manitoba | Saskatchewan | Alberta | British Columbia | ||||||||||||||||
|---|---|---|---|---|---|---|---|---|---|---|---|---|---|---|---|---|---|---|---|---|---|---|---|---|
| net survival (percentage) | 95 percent confidence intervals - lower limit | 95 percent confidence intervals - upper limit | net survival (percentage) | 95 percent confidence intervals - lower limit | 95 percent confidence intervals - upper limit | net survival (percentage) | 95 percent confidence intervals - lower limit | 95 percent confidence intervals - upper limit | net survival (percentage) | 95 percent confidence intervals - lower limit | 95 percent confidence intervals - upper limit | net survival (percentage) | 95 percent confidence intervals - lower limit | 95 percent confidence intervals - upper limit | net survival (percentage) | 95 percent confidence intervals - lower limit | 95 percent confidence intervals - upper limit | net survival (percentage) | 95 percent confidence intervals - lower limit | 95 percent confidence intervals - upper limit | net survival (percentage) | 95 percent confidence intervals - lower limit | 95 percent confidence intervals - upper limit | |
| 1992 to 1996 | 54.4 | 52.5 | 56.2 | 53.0 | 51.9 | 54.2 | 53.7 | 52.4 | 54.9 | 53.2 | 52.8 | 53.5 | 54.3 | 53.4 | 55.3 | 52.5 | 51.4 | 53.6 | 51.7 | 51.0 | 52.5 | 53.9 | 53.3 | 54.4 |
| 1993 to 1997 | 54.6 | 52.7 | 56.4 | 53.3 | 52.1 | 54.4 | 53.9 | 52.6 | 55.1 | 53.6 | 53.2 | 53.9 | 54.2 | 53.2 | 55.2 | 52.8 | 51.7 | 53.8 | 52.7 | 52.0 | 53.4 | 53.9 | 53.3 | 54.4 |
| 1994 to 1998 | 55.1 | 53.3 | 56.9 | 53.8 | 52.7 | 54.9 | 53.7 | 52.5 | 54.9 | 53.9 | 53.5 | 54.2 | 54.3 | 53.3 | 55.3 | 53.0 | 51.9 | 54.0 | 52.9 | 52.2 | 53.7 | 54.2 | 53.6 | 54.7 |
| 1995 to 1999 | 54.1 | 52.4 | 55.8 | 54.3 | 53.2 | 55.4 | 54.5 | 53.3 | 55.6 | 54.4 | 54.1 | 54.8 | 54.2 | 53.2 | 55.2 | 53.4 | 52.4 | 54.5 | 53.4 | 52.7 | 54.1 | 54.6 | 54.1 | 55.1 |
| 1996 to 2000 | 54.6 | 52.8 | 56.3 | 54.8 | 53.7 | 55.8 | 55.2 | 54.1 | 56.4 | 55.1 | 54.8 | 55.4 | 54.5 | 53.5 | 55.5 | 54.2 | 53.1 | 55.2 | 54.0 | 53.4 | 54.7 | 54.8 | 54.3 | 55.3 |
| 1997 to 2001 | 55.0 | 53.2 | 56.7 | 55.5 | 54.5 | 56.5 | 55.9 | 54.8 | 57.1 | 55.6 | 55.3 | 55.9 | 55.5 | 54.5 | 56.5 | 54.9 | 53.9 | 55.9 | 54.5 | 53.9 | 55.2 | 55.5 | 55.0 | 56.0 |
| 1998 to 2002 | 55.6 | 53.9 | 57.2 | 55.7 | 54.7 | 56.7 | 56.3 | 55.2 | 57.5 | 56.1 | 55.8 | 56.4 | 56.3 | 55.4 | 57.3 | 55.0 | 54.0 | 56.0 | 54.9 | 54.3 | 55.5 | 56.0 | 55.5 | 56.5 |
| 1999 to 2003 | 55.7 | 53.9 | 57.3 | 55.8 | 54.8 | 56.8 | 56.5 | 55.3 | 57.6 | 56.7 | 56.4 | 57.0 | 56.5 | 55.5 | 57.4 | 55.5 | 54.5 | 56.4 | 55.6 | 55.0 | 56.2 | 56.3 | 55.8 | 56.8 |
| 2000 to 2004 | 56.8 | 55.1 | 58.5 | 56.4 | 55.4 | 57.3 | 57.0 | 55.9 | 58.1 | 57.4 | 57.1 | 57.7 | 56.6 | 55.7 | 57.6 | 56.3 | 55.3 | 57.2 | 56.2 | 55.6 | 56.8 | 56.6 | 56.1 | 57.0 |
| 2001 to 2005 | 57.1 | 55.5 | 58.7 | 57.0 | 56.0 | 57.9 | 58.0 | 56.9 | 59.1 | 58.0 | 57.7 | 58.3 | 57.4 | 56.5 | 58.3 | 56.4 | 55.5 | 57.4 | 56.9 | 56.3 | 57.5 | 57.1 | 56.6 | 57.5 |
| 2002 to 2006 | 57.8 | 56.2 | 59.3 | 57.0 | 56.1 | 58.0 | 58.5 | 57.4 | 59.5 | 58.6 | 58.3 | 58.9 | 57.4 | 56.5 | 58.3 | 56.6 | 55.6 | 57.5 | 57.6 | 57.0 | 58.2 | 57.1 | 56.7 | 57.6 |
| 2003 to 2007 | 58.1 | 56.6 | 59.5 | 58.1 | 57.1 | 59.0 | 59.0 | 57.9 | 60.0 | 59.2 | 58.9 | 59.4 | 57.2 | 56.3 | 58.1 | 57.2 | 56.2 | 58.1 | 57.8 | 57.2 | 58.3 | 57.5 | 57.0 | 57.9 |
| 2004 to 2008 | 58.6 | 57.2 | 60.0 | 58.3 | 57.4 | 59.3 | 59.7 | 58.6 | 60.7 | 59.6 | 59.3 | 59.9 | 57.7 | 56.8 | 58.6 | 57.3 | 56.4 | 58.2 | 58.0 | 57.5 | 58.6 | 58.0 | 57.5 | 58.4 |
| 2005 to 2009 | 58.9 | 57.6 | 60.2 | 58.5 | 57.6 | 59.4 | 60.1 | 59.1 | 61.1 | 59.9 | 59.7 | 60.2 | 58.3 | 57.4 | 59.2 | 57.1 | 56.2 | 58.0 | 58.7 | 58.1 | 59.2 | 58.4 | 58.0 | 58.9 |
| 2006 to 2010 | 58.9 | 57.6 | 60.1 | 59.0 | 58.1 | 59.9 | 60.3 | 59.3 | 61.3 | 60.4 | 60.1 | 60.6 | 58.5 | 57.6 | 59.3 | 57.6 | 56.7 | 58.5 | 59.0 | 58.4 | 59.5 | 58.9 | 58.5 | 59.3 |
| 2007 to 2011 | 59.4 | 58.1 | 60.6 | 59.2 | 58.3 | 60.1 | 60.4 | 59.4 | 61.4 | 60.7 | 60.5 | 61.0 | 58.7 | 57.8 | 59.5 | 58.0 | 57.1 | 59.0 | 59.2 | 58.7 | 59.8 | 59.4 | 59.0 | 59.8 |
| 2008 to 2012 | 59.5 | 58.2 | 60.7 | 58.8 | 57.9 | 59.6 | 60.8 | 59.8 | 61.8 | 60.9 | 60.6 | 61.1 | 59.1 | 58.2 | 59.9 | 58.5 | 57.6 | 59.3 | 59.7 | 59.1 | 60.2 | 59.9 | 59.5 | 60.3 |
| 2009 to 2013 | Note ..: not available for a specific reference period | Note ..: not available for a specific reference period | Note ..: not available for a specific reference period | Note ..: not available for a specific reference period | Note ..: not available for a specific reference period | Note ..: not available for a specific reference period | Note ..: not available for a specific reference period | Note ..: not available for a specific reference period | Note ..: not available for a specific reference period | Note ..: not available for a specific reference period | Note ..: not available for a specific reference period | Note ..: not available for a specific reference period | Note ..: not available for a specific reference period | Note ..: not available for a specific reference period | Note ..: not available for a specific reference period | Note ..: not available for a specific reference period | Note ..: not available for a specific reference period | Note ..: not available for a specific reference period | Note ..: not available for a specific reference period | Note ..: not available for a specific reference period | Note ..: not available for a specific reference period | Note ..: not available for a specific reference period | Note ..: not available for a specific reference period | Note ..: not available for a specific reference period |
| 2010 to 2014 | Note ..: not available for a specific reference period | Note ..: not available for a specific reference period | Note ..: not available for a specific reference period | Note ..: not available for a specific reference period | Note ..: not available for a specific reference period | Note ..: not available for a specific reference period | Note ..: not available for a specific reference period | Note ..: not available for a specific reference period | Note ..: not available for a specific reference period | Note ..: not available for a specific reference period | Note ..: not available for a specific reference period | Note ..: not available for a specific reference period | Note ..: not available for a specific reference period | Note ..: not available for a specific reference period | Note ..: not available for a specific reference period | Note ..: not available for a specific reference period | Note ..: not available for a specific reference period | Note ..: not available for a specific reference period | Note ..: not available for a specific reference period | Note ..: not available for a specific reference period | Note ..: not available for a specific reference period | Note ..: not available for a specific reference period | Note ..: not available for a specific reference period | Note ..: not available for a specific reference period |
| 2011 to 2015 | Note ..: not available for a specific reference period | Note ..: not available for a specific reference period | Note ..: not available for a specific reference period | Note ..: not available for a specific reference period | Note ..: not available for a specific reference period | Note ..: not available for a specific reference period | Note ..: not available for a specific reference period | Note ..: not available for a specific reference period | Note ..: not available for a specific reference period | Note ..: not available for a specific reference period | Note ..: not available for a specific reference period | Note ..: not available for a specific reference period | Note ..: not available for a specific reference period | Note ..: not available for a specific reference period | Note ..: not available for a specific reference period | Note ..: not available for a specific reference period | Note ..: not available for a specific reference period | Note ..: not available for a specific reference period | Note ..: not available for a specific reference period | Note ..: not available for a specific reference period | Note ..: not available for a specific reference period | Note ..: not available for a specific reference period | Note ..: not available for a specific reference period | Note ..: not available for a specific reference period |
| 2012 to 2016 | Note ..: not available for a specific reference period | Note ..: not available for a specific reference period | Note ..: not available for a specific reference period | Note ..: not available for a specific reference period | Note ..: not available for a specific reference period | Note ..: not available for a specific reference period | Note ..: not available for a specific reference period | Note ..: not available for a specific reference period | Note ..: not available for a specific reference period | Note ..: not available for a specific reference period | Note ..: not available for a specific reference period | Note ..: not available for a specific reference period | Note ..: not available for a specific reference period | Note ..: not available for a specific reference period | Note ..: not available for a specific reference period | Note ..: not available for a specific reference period | Note ..: not available for a specific reference period | Note ..: not available for a specific reference period | Note ..: not available for a specific reference period | Note ..: not available for a specific reference period | Note ..: not available for a specific reference period | Note ..: not available for a specific reference period | Note ..: not available for a specific reference period | Note ..: not available for a specific reference period |
| 2013 to 2017 | 60.1 | 58.9 | 61.3 | 58.8 | 57.9 | 59.6 | 61.0 | 60.0 | 61.9 | 62.2 | 62.0 | 62.4 | 60.4 | 59.5 | 61.2 | 58.9 | 58.1 | 59.8 | 61.2 | 60.7 | 61.7 | 60.4 | 60.0 | 60.8 |
|
.. not available for a specific reference period Notes: Quebec is excluded because cases diagnosed from 2011 onward have not been submitted to the Canadian Cancer Registry. There were insufficient data to create a comparable CSI for Prince Edward Island and for the three territories. Net cancer survival index (CSI) estimates were calculated as a weighted average of cancer-specific age-standardized net survival estimates among males. CSI estimates for the overlapping five-year periods from 2009 to 2013, to 2012 to 2016 are not yet available. CSI estimates for the period from 2013 to 2017 were predicted using period analysis. Sources: Statistics Canada, Canadian Cancer Registry death-linked file (1992 to 2017) and life tables. |
||||||||||||||||||||||||
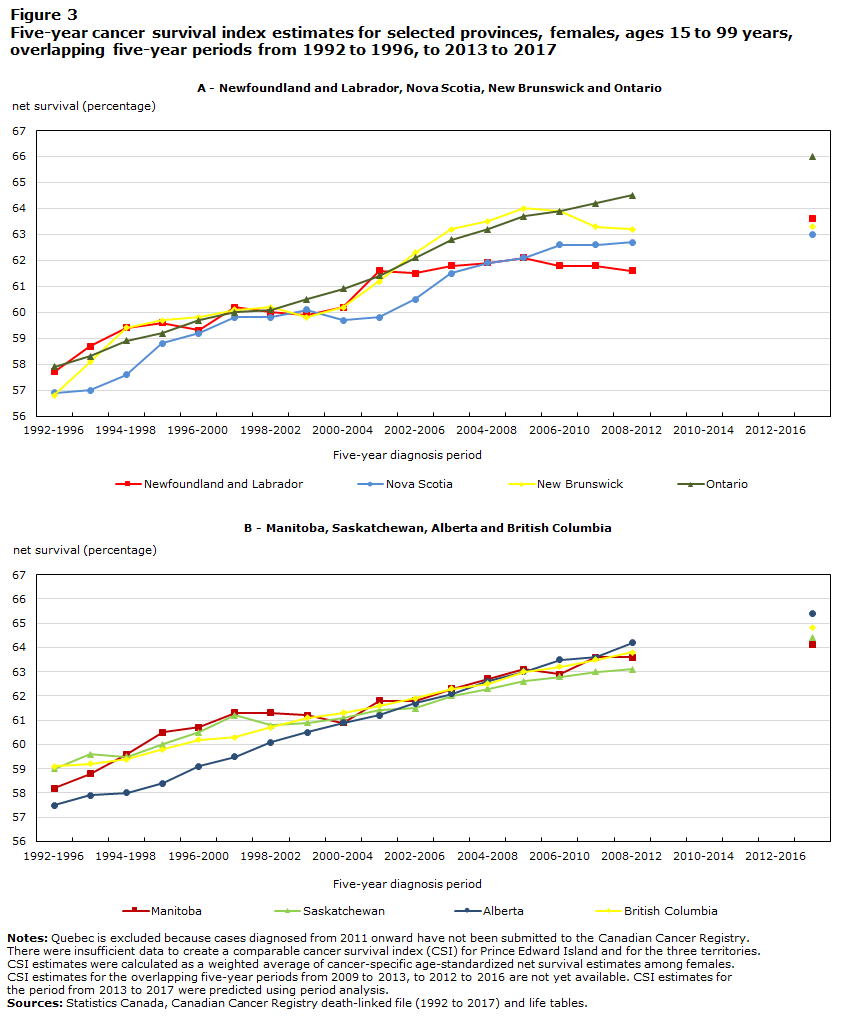
Description for Figure 3
| Five-year diagnosis period | Newfoundland and Labrador | Nova Scotia | New Brunswick | Ontario | Manitoba | Saskatchewan | Alberta | British Columbia | ||||||||||||||||
|---|---|---|---|---|---|---|---|---|---|---|---|---|---|---|---|---|---|---|---|---|---|---|---|---|
| net survival (percentage) | 95 percent confidence intervals - lower limit | 95 percent confidence intervals - upper limit | net survival (percentage) | 95 percent confidence intervals - lower limit | 95 percent confidence intervals - upper limit | net survival (percentage) | 95 percent confidence intervals - lower limit | 95 percent confidence intervals - upper limit | net survival (percentage) | 95 percent confidence intervals - lower limit | 95 percent confidence intervals - upper limit | net survival (percentage) | 95 percent confidence intervals - lower limit | 95 percent confidence intervals - upper limit | net survival (percentage) | 95 percent confidence intervals - lower limit | 95 percent confidence intervals - upper limit | net survival (percentage) | 95 percent confidence intervals - lower limit | 95 percent confidence intervals - upper limit | net survival (percentage) | 95 percent confidence intervals - lower limit | 95 percent confidence intervals - upper limit | |
| 1992 to 1996 | 57.7 | 56.0 | 59.3 | 56.9 | 55.8 | 57.9 | 56.8 | 55.5 | 58.0 | 57.9 | 57.5 | 58.2 | 58.2 | 57.3 | 59.1 | 59.0 | 58.0 | 60.0 | 57.5 | 56.8 | 58.2 | 59.1 | 58.5 | 59.6 |
| 1993 to 1997 | 58.7 | 57.0 | 60.3 | 57.0 | 56.0 | 58.0 | 58.1 | 56.9 | 59.2 | 58.3 | 58.0 | 58.6 | 58.8 | 57.9 | 59.7 | 59.6 | 58.6 | 60.6 | 57.9 | 57.3 | 58.6 | 59.2 | 58.6 | 59.7 |
| 1994 to 1998 | 59.4 | 57.7 | 61.0 | 57.6 | 56.6 | 58.6 | 59.4 | 58.3 | 60.6 | 58.9 | 58.5 | 59.2 | 59.6 | 58.7 | 60.5 | 59.5 | 58.5 | 60.5 | 58.0 | 57.4 | 58.7 | 59.4 | 58.9 | 59.9 |
| 1995 to 1999 | 59.6 | 58.0 | 61.3 | 58.8 | 57.8 | 59.8 | 59.7 | 58.5 | 60.8 | 59.2 | 58.9 | 59.5 | 60.5 | 59.6 | 61.4 | 60.0 | 59.1 | 61.0 | 58.4 | 57.8 | 59.0 | 59.8 | 59.3 | 60.3 |
| 1996 to 2000 | 59.3 | 57.7 | 60.9 | 59.2 | 58.2 | 60.1 | 59.8 | 58.7 | 60.9 | 59.7 | 59.4 | 60.0 | 60.7 | 59.9 | 61.6 | 60.5 | 59.5 | 61.4 | 59.1 | 58.5 | 59.8 | 60.2 | 59.7 | 60.7 |
| 1997 to 2001 | 60.2 | 58.5 | 61.8 | 59.8 | 58.8 | 60.7 | 60.1 | 59.0 | 61.2 | 60.0 | 59.7 | 60.3 | 61.3 | 60.4 | 62.1 | 61.2 | 60.2 | 62.1 | 59.5 | 58.9 | 60.1 | 60.3 | 59.8 | 60.8 |
| 1998 to 2002 | 60.0 | 58.4 | 61.7 | 59.8 | 58.8 | 60.7 | 60.2 | 59.1 | 61.2 | 60.1 | 59.8 | 60.4 | 61.3 | 60.4 | 62.2 | 60.8 | 59.9 | 61.7 | 60.1 | 59.5 | 60.7 | 60.7 | 60.2 | 61.1 |
| 1999 to 2003 | 59.9 | 58.2 | 61.4 | 60.1 | 59.2 | 61.0 | 59.8 | 58.7 | 60.9 | 60.5 | 60.3 | 60.8 | 61.2 | 60.3 | 62.1 | 60.9 | 59.9 | 61.8 | 60.5 | 59.9 | 61.0 | 61.1 | 60.6 | 61.6 |
| 2000 to 2004 | 60.2 | 58.6 | 61.8 | 59.7 | 58.8 | 60.6 | 60.2 | 59.2 | 61.3 | 60.9 | 60.6 | 61.1 | 60.9 | 60.0 | 61.7 | 61.1 | 60.2 | 62.0 | 60.9 | 60.3 | 61.4 | 61.3 | 60.9 | 61.8 |
| 2001 to 2005 | 61.6 | 60.1 | 63.2 | 59.8 | 58.9 | 60.7 | 61.2 | 60.2 | 62.2 | 61.4 | 61.2 | 61.7 | 61.8 | 60.9 | 62.6 | 61.4 | 60.4 | 62.3 | 61.2 | 60.6 | 61.7 | 61.6 | 61.2 | 62.1 |
| 2002 to 2006 | 61.5 | 60.1 | 63.0 | 60.5 | 59.7 | 61.4 | 62.3 | 61.3 | 63.3 | 62.1 | 61.9 | 62.4 | 61.8 | 61.0 | 62.7 | 61.5 | 60.6 | 62.4 | 61.7 | 61.2 | 62.3 | 61.9 | 61.5 | 62.4 |
| 2003 to 2007 | 61.8 | 60.4 | 63.2 | 61.5 | 60.7 | 62.4 | 63.2 | 62.2 | 64.1 | 62.8 | 62.5 | 63.1 | 62.3 | 61.5 | 63.1 | 62.0 | 61.1 | 62.9 | 62.1 | 61.5 | 62.6 | 62.3 | 61.9 | 62.8 |
| 2004 to 2008 | 61.9 | 60.6 | 63.2 | 61.9 | 61.0 | 62.7 | 63.5 | 62.5 | 64.4 | 63.2 | 62.9 | 63.4 | 62.7 | 61.9 | 63.5 | 62.3 | 61.4 | 63.2 | 62.6 | 62.0 | 63.1 | 62.5 | 62.1 | 63.0 |
| 2005 to 2009 | 62.1 | 60.8 | 63.3 | 62.1 | 61.3 | 62.9 | 64.0 | 63.0 | 65.0 | 63.7 | 63.5 | 64.0 | 63.1 | 62.3 | 63.9 | 62.6 | 61.7 | 63.5 | 63.0 | 62.5 | 63.6 | 63.0 | 62.5 | 63.4 |
| 2006 to 2010 | 61.8 | 60.6 | 63.1 | 62.6 | 61.8 | 63.4 | 63.9 | 63.0 | 64.9 | 63.9 | 63.7 | 64.2 | 62.9 | 62.1 | 63.7 | 62.8 | 61.9 | 63.6 | 63.5 | 63.0 | 64.0 | 63.2 | 62.8 | 63.6 |
| 2007 to 2011 | 61.8 | 60.6 | 63.0 | 62.6 | 61.8 | 63.5 | 63.3 | 62.3 | 64.2 | 64.2 | 64.0 | 64.4 | 63.6 | 62.9 | 64.4 | 63.0 | 62.1 | 63.8 | 63.6 | 63.1 | 64.1 | 63.5 | 63.1 | 63.9 |
| 2008 to 2012 | 61.6 | 60.4 | 62.7 | 62.7 | 61.8 | 63.5 | 63.2 | 62.3 | 64.2 | 64.5 | 64.2 | 64.7 | 63.6 | 62.9 | 64.4 | 63.1 | 62.2 | 63.9 | 64.2 | 63.7 | 64.7 | 63.8 | 63.3 | 64.2 |
| 2009 to 2013 | Note ..: not available for a specific reference period | Note ..: not available for a specific reference period | Note ..: not available for a specific reference period | Note ..: not available for a specific reference period | Note ..: not available for a specific reference period | Note ..: not available for a specific reference period | Note ..: not available for a specific reference period | Note ..: not available for a specific reference period | Note ..: not available for a specific reference period | Note ..: not available for a specific reference period | Note ..: not available for a specific reference period | Note ..: not available for a specific reference period | Note ..: not available for a specific reference period | Note ..: not available for a specific reference period | Note ..: not available for a specific reference period | Note ..: not available for a specific reference period | Note ..: not available for a specific reference period | Note ..: not available for a specific reference period | Note ..: not available for a specific reference period | Note ..: not available for a specific reference period | Note ..: not available for a specific reference period | Note ..: not available for a specific reference period | Note ..: not available for a specific reference period | Note ..: not available for a specific reference period |
| 2010 to 2014 | Note ..: not available for a specific reference period | Note ..: not available for a specific reference period | Note ..: not available for a specific reference period | Note ..: not available for a specific reference period | Note ..: not available for a specific reference period | Note ..: not available for a specific reference period | Note ..: not available for a specific reference period | Note ..: not available for a specific reference period | Note ..: not available for a specific reference period | Note ..: not available for a specific reference period | Note ..: not available for a specific reference period | Note ..: not available for a specific reference period | Note ..: not available for a specific reference period | Note ..: not available for a specific reference period | Note ..: not available for a specific reference period | Note ..: not available for a specific reference period | Note ..: not available for a specific reference period | Note ..: not available for a specific reference period | Note ..: not available for a specific reference period | Note ..: not available for a specific reference period | Note ..: not available for a specific reference period | Note ..: not available for a specific reference period | Note ..: not available for a specific reference period | Note ..: not available for a specific reference period |
| 2011 to 2015 | Note ..: not available for a specific reference period | Note ..: not available for a specific reference period | Note ..: not available for a specific reference period | Note ..: not available for a specific reference period | Note ..: not available for a specific reference period | Note ..: not available for a specific reference period | Note ..: not available for a specific reference period | Note ..: not available for a specific reference period | Note ..: not available for a specific reference period | Note ..: not available for a specific reference period | Note ..: not available for a specific reference period | Note ..: not available for a specific reference period | Note ..: not available for a specific reference period | Note ..: not available for a specific reference period | Note ..: not available for a specific reference period | Note ..: not available for a specific reference period | Note ..: not available for a specific reference period | Note ..: not available for a specific reference period | Note ..: not available for a specific reference period | Note ..: not available for a specific reference period | Note ..: not available for a specific reference period | Note ..: not available for a specific reference period | Note ..: not available for a specific reference period | Note ..: not available for a specific reference period |
| 2012 to 2016 | Note ..: not available for a specific reference period | Note ..: not available for a specific reference period | Note ..: not available for a specific reference period | Note ..: not available for a specific reference period | Note ..: not available for a specific reference period | Note ..: not available for a specific reference period | Note ..: not available for a specific reference period | Note ..: not available for a specific reference period | Note ..: not available for a specific reference period | Note ..: not available for a specific reference period | Note ..: not available for a specific reference period | Note ..: not available for a specific reference period | Note ..: not available for a specific reference period | Note ..: not available for a specific reference period | Note ..: not available for a specific reference period | Note ..: not available for a specific reference period | Note ..: not available for a specific reference period | Note ..: not available for a specific reference period | Note ..: not available for a specific reference period | Note ..: not available for a specific reference period | Note ..: not available for a specific reference period | Note ..: not available for a specific reference period | Note ..: not available for a specific reference period | Note ..: not available for a specific reference period |
| 2013 to 2017 | 63.6 | 62.4 | 64.7 | 63.0 | 62.2 | 63.8 | 63.3 | 62.4 | 64.2 | 66.0 | 65.8 | 66.3 | 64.1 | 63.3 | 64.9 | 64.4 | 63.5 | 65.2 | 65.4 | 64.9 | 65.9 | 64.8 | 64.4 | 65.2 |
|
.. not available for a specific reference period Notes: Quebec is excluded because cases diagnosed from 2011 onward have not been submitted to the Canadian Cancer Registry. There were insufficient data to create a comparable CSI for Prince Edward Island and for the three territories. Net cancer survival index (CSI) estimates were calculated as a weighted average of cancer-specific age-standardized net survival estimates among females. CSI estimates for the overlapping five-year periods from 2009 to 2013, to 2012 to 2016 are not yet available. CSI estimates for the period from 2013 to 2017 were predicted using period analysis. Sources: Statistics Canada, Canadian Cancer Registry death-linked file (1992 to 2017) and life tables. |
||||||||||||||||||||||||
Contributions to changes in provincial cancer survival indexes over time
Female breast cancer was found to be the most influential cancer type and sex combination on five-year CSI increases since the period from 1992 to 1996 in Nova Scotia (14.9%), New Brunswick (12.5%) and Manitoba (12.2%). It was the second most influential in the other five provinces (Table 3). Prostate cancer was the most influential in Newfoundland and Labrador (15.8%), Saskatchewan (11.5%), Alberta (11.4%), and Ontario (9.9%), and the second most influential in two more provinces. However, prostate cancer was not among the top five in New Brunswick and British Columbia. Female lung and bronchus (lung) cancer (7.7%) was the most influential cancer type and sex combination on the CSI increase in British Columbia. Female lung cancer and male non-Hodgkin lymphoma were both among the top five influential combinations in seven of the eight provinces considered. No other cancer type and sex combination appeared more than three times.
| Province/cancer/sex | Contribution (%) |
|---|---|
| Period from 1992 to 1996, to period from 2013 to 2017 | |
| Newfoundland and Labrador | |
| Prostate - male | 15.8 |
| Breast - female | 9.0 |
| Lung and bronchus - female | 6.9 |
| Non-Hodgkin lymphoma - female | 5.1 |
| Lung and bronchus - male | 4.9 |
| Nova Scotia | |
| Breast - female | 14.9 |
| Prostate - male | 13.3 |
| Lung and bronchus - female | 7.6 |
| Non-Hodgkin lymphoma - male | 6.1 |
| Colon - female | 5.6 |
| New Brunswick | |
| Breast - female | 12.5 |
| Lung and bronchus - female | 8.3 |
| Lung and bronchus - male | 6.3 |
| Non-Hodgkin lymphoma - male | 6.2 |
| Colon - female | 5.9 |
| Ontario | |
| Prostate - male | 9.9 |
| Breast - female | 9.5 |
| Lung and bronchus - female | 7.0 |
| Non-Hodgkin lymphoma - male | 6.7 |
| Miscellaneous - female | 5.2 |
| Manitoba | |
| Breast - female | 12.2 |
| Prostate - male | 9.3 |
| Non-Hodgkin lymphoma - male | 8.6 |
| Lung and bronchus - female | 7.5 |
| Lung and bronchus - male | 4.8 |
| Saskatchewan | |
| Prostate - male | 11.5 |
| Breast - female | 10.2 |
| Colon - male | 7.6 |
| Miscellaneous - male | 7.4 |
| Non-Hodgkin lymphoma - male | 6.7 |
| Alberta | |
| Prostate - male | 11.4 |
| Breast - female | 9.8 |
| Lung and bronchus - female | 6.9 |
| Non-Hodgkin lymphoma - male | 5.9 |
| Colon - male | 5.2 |
| British Columbia | |
| Lung and bronchus - female | 7.7 |
| Breast - female | 7.4 |
| Colon - male | 7.0 |
| Non-Hodgkin lymphoma - male | 6.8 |
| Miscellaneous - female | 5.7 |
| Period from 2003 to 2007, to period from 2013 to 2017 | |
| Newfoundland and Labrador | |
| Lung and bronchus - male | 14.1 |
| Breast - female | 11.5 |
| Lung and bronchus - female | 11.4 |
| Leukemias - male | 4.1 |
| Other cancers high NS (≥ 70%) - male | 4.0Table 3 Note ‡ |
| Nova Scotia | |
| Prostate - male | 14.1Table 3 Note ‡ |
| Lung and bronchus - female | 11.7 |
| Lung and bronchus - male | 7.5 |
| Kidney and renal pelvis - male | 6.5 |
| Oral cavity and pharynx - female | 5.7 |
| New Brunswick | |
| Prostate - male | 14.8Table 3 Note ‡ |
| Lung and bronchus - female | 11.2 |
| Lung and bronchus - male | 10.5 |
| Leukemias - male | 6.5 |
| Colon - male | 6.5 |
| Ontario | |
| Lung and bronchus - female | 10.6 |
| Bladder (including in situ) - male | 8.4 |
| Miscellaneous - female | 8.2 |
| Lung and bronchus - male | 7.8 |
| Miscellaneous - male | 7.6 |
| Manitoba | |
| Prostate - male | 8.1 |
| Breast - female | 7.2 |
| Lung and bronchus - male | 6.3 |
| Non-Hodgkin lymphoma - male | 5.8 |
| Corpus uteri and uterus NOS - female | 5.2Table 3 Note ‡ |
| Saskatchewan | |
| Prostate - male | 14.6Table 3 Note ‡ |
| Miscellaneous - male | 9.0 |
| Lung and bronchus - male | 8.4 |
| Colon - female | 7.8 |
| Lung and bronchus - female | 6.4 |
| Alberta | |
| Lung and bronchus - female | 11.2 |
| Lung and bronchus - male | 8.6 |
| Breast - female | 6.7 |
| Bladder (including in situ) - male | 4.9 |
| Colon - female | 4.7 |
| British Columbia | |
| Lung and bronchus - male | 10.8 |
| Lung and bronchus - female | 9.9 |
| Miscellaneous - male | 9.0 |
| Miscellaneous - female | 8.6 |
| Colon - male | 5.9 |
Sources: Statistics Canada, Canadian Cancer Registry death-linked file (1992 to 2017) and life tables. |
|
In regard to five-year CSI increases since the period from 2003 to 2007, male lung cancer was among the top five most influential cancer type and sex combinations in each province. In Newfoundland and Labrador (14.1%), and British Columbia (10.8%), it was the most influential combination. With the exception of Manitoba, female lung cancer was also among the top five most influential cancer type and sex combinations in each province. In Alberta (11.2%) and Ontario (10.6%), female lung cancer was the most influential, though the greatest contribution was observed in Nova Scotia (11.7%). In four provinces, changes in prostate cancer survival have had the largest impact on five-year CSI increases since the same period. In New Brunswick (14.8%), Saskatchewan (14.6%) and Nova Scotia (14.1%), the contribution was counterproductive to the goal of improving the CSI because of recent decreases in five-year age-standardized NS in these provinces. A productive contribution to the CSI by prostate cancer was observed in Manitoba (8.1%), while in the remaining provinces it did not rank among the top five contributors.
Discussion
Significant progress has been made since the early 1990s in five-year cancer survival for all cancers combined, in each Canadian province studied. During this time, the largest five-year CSI increases occurred in Alberta and Ontario. In the most recent period from 2013 to 2017, five-year CSI estimates were highest in Ontario and lowest in Nova Scotia. In general, the most influential cancer and sex combinations on provincial changes in the CSI were female breast cancer and prostate cancer, though the influence of the latter has varied considerably by province since the period from 2003 to 2007.
The five-year CSI provides a summary measure of overall cancer survival in a population. It can be used to determine interprovincial differences and examine province-specific trends in progress over time. Changes over time in the CSI across Canadian provinces reflect a composite of inputs from 39 different cancer and sex combinations. In turn, the influence of a particular cancer and sex combination is determined by both the fixed weight assigned to the component and the changes in age-standardized NS for the component over the given period. Consequently, the key cancer and sex components underlying provincial CSI differences, whether at a fixed period or over time, are typically very challenging to elucidate. Indeed, differences may simply be caused by a number of minor differences. Nonetheless, some general observations in these areas are possible. The key component contributors to within-province changes over time are more easily discernable.
Significant differences between provinces in five-year CSI estimates were observed. For example, there were over three percentage points separating the highest-ranking (Ontario) and lowest-ranking (Nova Scotia) provinces for the period from 2013 to 2017. This range is considerable in the context of relatively tight CSI confidence intervals. The relatively high current five-year CSI estimate in Ontario reflects the fact that this province ranks highly compared with other provinces, regarding five-year age-standardized NS for many commonly diagnosed cancers.Note 26 By contrast, Nova Scotia ranks particularly low for cancers such as colorectal, lung, uterine and non-Hodgkin lymphoma.Note 26 Provincial differences in CSI estimates reflect the interplay between many factors. These may include variations in screening practices, genetics, early diagnosis, treatment approach and practices, and patterns of disparity in social determinants of health, as well as the extent to which effective control measures are being adopted and implemented. All of these can have profound effects on cancer outcomes. Differences in registration practices between the provincial cancer registries may also play a role, though this is somewhat mitigated by the use of data from the centralized CCR.
Five-year CSI increases over time were largest in Alberta and Ontario. The leading component contributors to increases in both provinces were prostate and female breast cancer. These components were also the leading contributors to corresponding increases at the national level, though in reverse order.Note 2 Gains in prostate cancer survival have been attributed to changes in early detection and improvements in treatment.Note 27 Improved survival for breast cancer has been attributed to advances in treatment, particularly adjuvant therapy, and the success of population-based mammography screening programs, which have improved the early detection of cases.Note 28Note 29 Apart from such improvements in survival, the relatively large weights assigned to prostate and female breast cancer—each twice that of female lung cancer, which was assigned the third-highest weight—played a major role in their high-ranking component contributions to CSI increases.
The smallest increases since the period from 2003 to 2007 were experienced by residents of Nova Scotia and New Brunswick. In both provinces, the leading component contributor was prostate cancer, which impacted the CSI in a counterproductive manner because of recent decreases in survival. Efforts to reduce the overdiagnosis of prostate cancer likely played an indirect role in the recent survival reduction of this cancer.Note 2 A comparison of recent trends in stage-specific prostate cancer incidence and survival across provinces may provide further insight.
Strengths and limitations
The use of the CSI to measure provincial changes in cancer survival over time and compare survival across provinces is a major strength of this study. The CSI is unaffected by differences in the age, sex and cancer type distribution of cancer cases across populations, or within populations over time. It may serve as a useful summary indicator of progress in cancer control efforts when interpreted in conjunction with cancer incidence and mortality time trends. However, it does not itself provide insight into the reasons for changes in survival estimates over time.Note 2
While the underlying methodology is inherently the same, there were two modifications to the approach used in the recently published national-level analysis.Note 2 First, considerably fewer cancer categories were incorporated in the provincial analysis, though all primary cancers were included in some way. A validation exercise indicated that the impact of this change was likely minimal. Secondly, provincial estimates are based on five-year periods, rather than three-year periods. Any comparisons between provincial and national CSI estimates should take these differences into consideration. Additionally, as provincial data naturally contribute to the calculation of national estimates, comparisons will not be between two independent entities.
The modifications were necessary to permit the derivation of CSI estimates for as many provinces as possible because of the reduced number of cancer cases available for analysis at the provincial level. Despite these efforts, this study does not provide results for all of Canada. The CCR has not received data from Quebec since the 2010 data year, and data that were submitted up to 2010 were based primarily on hospital data (i.e., hospitalizations or day surgeries). Because of small population sizes in Prince Edward Island and the three territories, there was an insufficient number of cancer cases to create a CSI comparable with other provinces.
While the Canadian Council of Cancer Registries strives to achieve uniformity in data collection for the CCR, there are inconsistencies between provinces and within provinces over time. For example, several years ago Ontario implemented a new cancer reporting system, retroactive to 2010, that facilitated the identification of cases—such as in situ bladder—that previously went unrecorded. As a result, the increase in bladder cancer NS for Ontario in recent years will be overstated to some extent. Another example involves the underreporting of cases to the CCR from Newfoundland and Labrador prior to the 2006 diagnosis year. These issues are outlined in more detail elsewhere.Note 26
Conclusion
This study provides the first provincial-level comprehensive evaluation of progress in cancer survival for all cancer types combined in Canada. As measured by the CSI, significant progress has been made in five-year cancer survival for all cancers combined since the early 1990s in each Canadian province studied. However, this progress has not been uniform across the provinces, and there are significant CSI differences between some of them. Continued monitoring of this index, on both the national and provincial levels, is recommended to help measure ongoing progress in the diagnosis and management of cancer in Canada, including the effects of the COVID-19 pandemic. Also recommended are studies designed to elucidate cancer-specific, and possibly systemic, differences in provincial approaches along the cancer care spectrum.
| Cancer | Age group (years) | |||||
|---|---|---|---|---|---|---|
| 15 to 44 | 45 to 54 | 55 to 64 | 65 to 74 | 75 to 99 | 15 to 99 | |
| Oral cavity and pharynx | 0.068 | 0.178 | 0.298 | 0.237 | 0.219 | 1.000 |
| Stomach | 0.044 | 0.105 | 0.197 | 0.263 | 0.391 | 1.000 |
| Colon excluding rectum | 0.036 | 0.084 | 0.191 | 0.271 | 0.418 | 1.000 |
| Rectum | 0.049 | 0.135 | 0.251 | 0.272 | 0.293 | 1.000 |
| Lung and bronchus | 0.010 | 0.067 | 0.212 | 0.331 | 0.380 | 1.000 |
| Melanoma of the skin | 0.138 | 0.165 | 0.227 | 0.218 | 0.252 | 1.000 |
| Female breast | 0.099 | 0.211 | 0.253 | 0.235 | 0.202 | 1.000 |
| Cervix uteri | 0.418 | 0.225 | 0.169 | 0.100 | 0.088 | 1.000 |
| Corpus uteri and uterus not otherwise specified | 0.050 | 0.169 | 0.353 | 0.261 | 0.167 | 1.000 |
| Ovary | 0.104 | 0.185 | 0.237 | 0.230 | 0.244 | 1.000 |
| Urinary bladder (including in situ) | 0.019 | 0.065 | 0.184 | 0.296 | 0.436 | 1.000 |
| Kidney and renal pelvis | 0.067 | 0.160 | 0.263 | 0.270 | 0.240 | 1.000 |
| Thyroid | 0.351 | 0.256 | 0.204 | 0.127 | 0.062 | 1.000 |
| Non-Hodgkin lymphoma | 0.089 | 0.122 | 0.212 | 0.252 | 0.325 | 1.000 |
| Multiple myeloma | 0.024 | 0.088 | 0.199 | 0.292 | 0.397 | 1.000 |
| Leukemias | 0.086 | 0.105 | 0.197 | 0.249 | 0.363 | 1.000 |
| Miscellaneous (including ill-defined and unknown primary sites) | 0.044 | 0.074 | 0.149 | 0.229 | 0.504 | 1.000 |
| Other cancers with high net survival (≥ 70%) | 0.447 | 0.127 | 0.122 | 0.124 | 0.180 | 1.000 |
| Other cancers with medium net survival (50% to 69%) | 0.107 | 0.149 | 0.234 | 0.237 | 0.273 | 1.000 |
| Other cancers with low net survival (20% to 49%) | 0.102 | 0.122 | 0.261 | 0.243 | 0.272 | 1.000 |
| Other cancers with very low net survival (< 20%) | 0.026 | 0.086 | 0.212 | 0.284 | 0.392 | 1.000 |
| 15 to 54 | 55 to64 | 65 to 74 | 75 to 84 | 85 to 99 | 15 to 99 | |
| Prostate | 0.079 | 0.299 | 0.373 | 0.195 | 0.054 | 1.000 |
|
Notes: Cancers, including miscellaneous, were classified using Surveillance, Epidemiology, and End Results Program grouping definitions (Howlader N, Noone AM, Krapcho M, et al.). The categorization of "other cancers" into high, medium, low and very low net survival categories was based on predicted net survival for Canada, excluding Quebec, for the period from 2015 to 2017. Categories were high net survival: other non-epithelial skin, male breast, testis, other male genital organs, eye and orbit, Hodgkin lymphoma, Kaposi sarcoma; medium net survival: small intestine, anus, larynx, bones and joints, soft tissue (including heart), other female genital organs, penis, cranial nerves and other nervous system, other endocrine including thymus; low net survival: liver, other respiratory organs, ureter, other urinary organs, brain; very low net survival: esophagus, gallbladder, pancreas, other digestive organs, mesothelioma. Sources: Canadian cancer survival standard weights (Ellison LF, 2018). Statistics Canada, Canadian Cancer Registry International Agency for Research on Cancer multiple primary rules version tabulation file (1992 to 2015) released on January 29, 2018. |
||||||
- Date modified: