
Health Reports
Short-term cancer prevalence in Canada, 2018

by Chunhe Yao and Jean-Michel Billette
DOI: https://www.doi.org/10.25318/82-003-x202200300002-eng
Abstract
Background
As the leading cause of death in Canada, cancer imposes an enormous burden on both the health of Canadians and the Canadian health care system. This study presents detailed tumour-based cancer prevalence estimates in Canada by sex, age group, cancer type and prevalence duration as of January 1, 2018.
Data and methods
Estimates of two- and five-year cancer prevalence were calculated for an extensive list of cancers in the Canadian population (excluding Quebec) based on incidence data from the Canadian Cancer Registry linked to mortality data from the Canadian Vital Statistics - Death Database, and death-related information from tax data.
Results
The two- and five-year cancer prevalence counts were 236,785 (832.1 per 100,000 people) and 503,060 (1,767.8 per 100,000 people), respectively. Cancer prevalence estimates varied by cancer site, and the four most prevalent cancers (breast, prostate, colorectal, lung) accounted for 49.6% of total five-year cancer prevalence in Canada. Prevalence for all cancers combined increased dramatically with age: 74.3% of prevalent cases among males and 61.9% among females were encountered among the population aged 60 and older. Prevalence was higher among females than males before age 60, and higher among males thereafter, peaking in the 80-to-89 age group for both sexes.
Interpretation
Prevalence mirrors the effects of both cancer incidence and survival. Breaking down cancer prevalence by disease duration is useful to distinguish groups of patients in different phases of care. An increase in prevalence indicates a greater demand for health care services and translates into a significant economic burden for the jurisdictions that are responsible for providing such services.
Keywords
prevalence, cancer burden, epidemiology, neoplasms, registries, surveillance
Authors
Chunhe Yao (Chunhe.yao@statcan.gc.ca) and Jean-Michel Billette (jean-michel.billette@statcan.gc.ca) are with the Centre for Population Health Data at Statistics Canada, Ottawa, Ontario.
Introduction
Cancer is a major contributor to the morbidity and mortality of many populations.Note 1 According to the World Health Organization, cancer is a leading cause of death worldwide, accounting for nearly 10 million deaths in 2020.Note 2 In Canada, it is estimated that about two in five Canadians will be diagnosed with cancer over the course of their life, and one in four will die of cancer.Note 3
Cancer prevalence is a means of quantifying the burden of cancer in a population and monitoring its impact on resource allocation for cancer diagnosis, treatment and follow-up care.Note 4 It can either be person-based (number of people diagnosed with cancer who were alive in the population at some given moment), or tumour-based (number of primary tumours diagnosed within people alive in the population at a given time). Most cancer prevalence estimates are based on limited-duration prevalence, which yields an estimate of the number of people or tumours diagnosed within a specified period (usually 2, 5 or 10 years) before a given reference date (index date).Note 5
Two-year and five-year tumour-based prevalence estimates will be examined here for all cancers combined and some selected cancer types. These short-term prevalence estimates may be useful for informing the delivery of health care services. For example, in the first two years following cancer diagnosis, the main demand in terms of oncologic health care services is primarily focused on treatment. Additionally, five-year prevalence permits to monitor subsequent follow-up care as well as the risk of cancer recurrence following initial treatment.Note 6
Previously, Canadian cancer prevalence was reported for diagnosis years up to 2009 using data from the Canadian Cancer Registry (CCR).Note 7Note 8Note 9 This article updates the estimates up to January 1, 2018, with a disaggregation by sex, age group and cancer type.
Methods
Data sources
The Canadian Cancer Registry (CCR) is a dynamic, person-oriented, population-based database that collects cancer incidence data from the Provincial/Territorial Cancer Registries since 1992.Note 3 The 1992-to-2017 version of the CCR was linked to mortality data from the Canadian Vital Statistics - Death Database (CVSD)Note 10 to enable the estimation of cancer prevalence and survival estimates. A third dataset, the T1 Personal Master file (T1PMF), was used to derive additional death-related information from tax data for the CCR records that could not be successfully linked to those of the CVSD (e.g., individuals whose death occurred outside of Canada). More information on the linkage process and the resulting death-linked analytic file is available upon request.
A file containing records of all invasive cancer cases and in situ bladder cancer cases was created using the multiple primary coding rules of the International Agency for Research on Cancer.Note 11 Cases were defined based on the International Classification of Diseases for Oncology, Third Edition and classified using the Surveillance, Epidemiology, and End Results Program grouping definitions.Note 12Note 13 Analyses were based on all primary tumours. Data for Canada in this report exclude Quebec since cancer incidence data from Quebec have not been submitted to the CCR since the 2010 diagnosis year.
Analytical techniques
Prevalence is determined based on the counting method, which is here applied to tumour-based prevalence,Note 14Note 15 since person-based prevalence may result in an underestimation of the overall burden of cancer by considering only one cancer per patient. All primary invasive cancers and in situ bladder cancers, among people alive on January 1, 2018, that had been diagnosed within the interval under consideration were counted. Specifically, two-year prevalence was estimated by counting the number of primary tumour cases diagnosed from January 1, 2016, to December 31, 2017, in people who were still alive on January 1, 2018. Similarly, five-year prevalence estimates were based on cases diagnosed from January 1, 2013, to December 31, 2017.
Age-specific prevalence estimates were derived by subtracting the date of birth from the January 1, 2018, index date. Prevalence proportions (per 100,000 people) were calculated by dividing prevalence counts by the estimated population on January 1, 2018, and multiplying by 100,000. Population estimates by age and sex were derived by averaging the 2017 and 2018 mid-year populations. All analyses were conducted with SAS 9.4 (SAS Institute Inc., Cary, NC).
Results
Among people alive on January 1, 2018, approximately 236,785 cancer cases had been diagnosed within the past two years (832.1 per 100,000 people) and 503,060 cancer cases within the past five years (1,767.8 per 100,000 people), as shown in Table 1. Prevalent cases were almost evenly distributed between the sexes for both duration periods, with slightly more male cases for two-year prevalence (50.4%) and slightly more female cases for five-year prevalence (50.6%).
| Cancer | Prevalent cases | Prevalence proportions (per 100,000) | ||||||||||
|---|---|---|---|---|---|---|---|---|---|---|---|---|
| Two-year (diagnosed since 2016) | Five-year (diagnosed since 2013) | Two-year (diagnosed since 2016) | Five-year (diagnosed since 2013) | |||||||||
| TotalTable 1 Note † | Males | Females | TotalTable 1 Note † | Males | Females | Total | Males | Females | Total | Males | Females | |
| All cancersTable 1 Note ‡ | 236,785 | 119,255 | 117,530 | 503,060 | 248,285 | 254,775 | 832.1 | 845.2 | 819.2 | 1,767.8 | 1,759.6 | 1,775.8 |
| Breast | 37,055 | 305 | 36,750 | 85,100 | 635 | 84,465 | 130.2 | 2.2 | 256.2 | 299.0 | 4.5 | 588.7 |
| Lung and bronchus | 19,470 | 8,925 | 10,545 | 32,645 | 14,430 | 18,215 | 68.4 | 63.3 | 73.5 | 114.7 | 102.3 | 127.0 |
| Prostate | 32,940 | 32,945 | Note ...: not applicable | 72,725 | 72,725 | Note ...: not applicable | 115.8 | 233.5 | Note ...: not applicable | 255.6 | 515.4 | Note ...: not applicable |
| Colon and rectum | 26,615 | 14,865 | 11,745 | 59,160 | 32,955 | 26,205 | 93.5 | 105.3 | 81.9 | 207.9 | 233.6 | 182.7 |
| Urinary bladder (including in situ) | 13,285 | 10,225 | 3,060 | 28,195 | 21,630 | 6,560 | 46.7 | 72.5 | 21.3 | 99.1 | 153.3 | 45.7 |
| Non-Hodgkin lymphoma | 11,635 | 6,415 | 5,220 | 24,990 | 13,715 | 11,280 | 40.9 | 45.5 | 36.4 | 87.8 | 97.2 | 78.6 |
| Thyroid | 8,615 | 2,245 | 6,370 | 22,425 | 5,610 | 16,810 | 30.3 | 15.9 | 44.4 | 78.8 | 39.8 | 117.2 |
| Melanoma of the skin | 11,820 | 6,415 | 5,405 | 26,375 | 13,960 | 12,415 | 41.5 | 45.5 | 37.7 | 92.7 | 98.9 | 86.5 |
| Kidney and renal pelvis | 8,060 | 5,235 | 2,830 | 17,525 | 11,280 | 6,245 | 28.3 | 37.1 | 19.7 | 61.6 | 79.9 | 43.5 |
| Uterus (body, NOS) | 9,655 | Note ...: not applicable | 9,655 | 21,150 | Note ...: not applicable | 21,155 | 33.9 | Note ...: not applicable | 67.3 | 74.3 | Note ...: not applicable | 147.5 |
| Leukemia | 6,535 | 3,915 | 2,625 | 14,690 | 8,740 | 5,950 | 23.0 | 27.7 | 18.3 | 51.6 | 61.9 | 41.5 |
| Pancreas | 2,920 | 1,575 | 1,345 | 4,080 | 2,190 | 1,890 | 10.3 | 11.2 | 9.4 | 14.3 | 15.5 | 13.2 |
| Head and neckTable 1 Note †† | 7,685 | 5,585 | 2,105 | 15,790 | 11,415 | 4,375 | 27.0 | 39.6 | 14.7 | 55.5 | 80.9 | 30.5 |
| Stomach | 3,010 | 1,975 | 1,035 | 5,290 | 3,400 | 1,890 | 10.6 | 14.0 | 7.2 | 18.6 | 24.1 | 13.2 |
| Myeloma | 3,750 | 2,170 | 1,585 | 7,240 | 4,155 | 3,085 | 13.2 | 15.4 | 11.0 | 25.4 | 29.4 | 21.5 |
| Brain/CNS | 2,220 | 1,245 | 975 | 3,925 | 2,200 | 1,725 | 7.8 | 8.8 | 6.8 | 13.8 | 15.6 | 12.0 |
| Ovary | 3,005 | Note ...: not applicable | 3,005 | 6,190 | Note ...: not applicable | 6,190 | 10.6 | Note ...: not applicable | 20.9 | 21.8 | Note ...: not applicable | 43.1 |
| Liver | 1,880 | 1,480 | 405 | 3,225 | 2,465 | 755 | 6.6 | 10.5 | 2.8 | 11.3 | 17.5 | 5.3 |
| Esophagus | 1,640 | 1,260 | 375 | 2,445 | 1,870 | 580 | 5.8 | 8.9 | 2.6 | 8.6 | 13.3 | 4.0 |
| Cervix uteri | 2,045 | Note ...: not applicable | 2,040 | 4,415 | Note ...: not applicable | 4,415 | 7.2 | Note ...: not applicable | 14.2 | 15.5 | Note ...: not applicable | 30.8 |
| Testis | 1,655 | 1,655 | Note ...: not applicable | 3,990 | 3,990 | Note ...: not applicable | 5.8 | 11.7 | Note ...: not applicable | 14.0 | 28.3 | Note ...: not applicable |
| Hodgkin lymphoma | 1,410 | 785 | 630 | 3,300 | 1,830 | 1,475 | 5.0 | 5.6 | 4.4 | 11.6 | 13.0 | 10.3 |
| All other cancers | 19,860 | 10,045 | 9,815 | 38,195 | 19,100 | 19,095 | 69.8 | 71.2 | 68.4 | 134.2 | 135.4 | 133.1 |
... not applicable
Source: Canadian Cancer Registry linked to Canadian Vital Statistics Death Database and tax data. |
||||||||||||
Estimated prevalence by cancer type, duration and sex
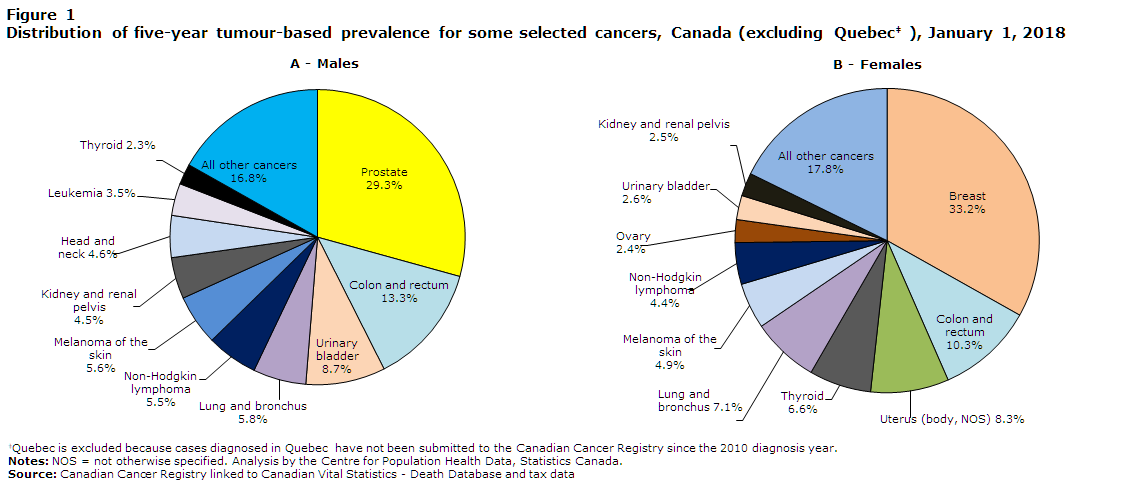
Cancer prevalence estimates varied by cancer type. Prevalence for breast, prostate, colorectal and lung cancers accounted for about half (49.6%) of the prevalent cases diagnosed between 2013 and 2017. Figure 1 shows the distribution of cancer-specific five-year prevalence by sex. Among males, the most common cancers were prostate (29.3%), colorectal (13.3%), bladder (8.7%) and lung (5.8%) cancer. Together, these cancers accounted for nearly three in five (57.1%) prevalent cases. Among females, one-third (33.2% or 84,465 cases) of all the tumour cases diagnosed within five years of the index date were breast cancer cases, followed by colorectal (10.3%), uterine (8.3%) and lung (7.1%) cancer. As with males, the top four cancers accounted for close to three in five (58.9%) prevalent cases among females.
Data table for Figure 1
| Number | |
|---|---|
| Males | |
| Prostate | 72,725 |
| Colon and rectum | 32,955 |
| Urinary bladder | 21,630 |
| Lung and bronchus | 14,430 |
| Non-Hodgkin lymphoma | 13,960 |
| Melanomas of the skin | 13,715 |
| Kidney and renal pelvis | 11,280 |
| Head and neck | 11,410 |
| Leukemias | 8,740 |
| Thyroid | 5,610 |
| All other cancers | 41,830 |
| Females | |
| Breast | 84,465 |
| Colon and rectum | 26,205 |
| Uterus (body, NOS) | 21,155 |
| Thyroid | 16,810 |
| Lung and bronchus | 18,215 |
| Melanomas of the skin | 12,415 |
| Non-Hodgkin lymphoma | 11,280 |
| Ovary | 6,190 |
| Urinary bladder | 6,560 |
| Kidney and renal pelvis | 6,245 |
| All other cancers | 45,235 |
Source: Canadian Cancer Registry linked to Canadian Vital Statistics - Death Database and tax data |
|
Figure 2 shows that the sex-specific prevalence of certain types of cancer depends on the length of the period considered. Among males, of the 72,725 prostate cancer cases diagnosed within five years of the index date, 45.3% had been diagnosed in 2016 or 2017, while 54.7% had been diagnosed within the previous three years (2013 to 2015). Similarly, for colorectal and bladder cancer, as well as for non-Hodgkin lymphoma, the relative proportion of prevalent cases was larger among males diagnosed in 2013 to 2015 than among those diagnosed in 2016 or 2017. Lung cancer cases appear to be different, with 61.9% of the prevalent cases diagnosed within the two years before the index date. A very similar situation is observed in the female population. Of the 84,465 breast cancer cases (five-year prevalence) diagnosed between 2013 and 2017, 43.5% had been diagnosed within the previous two years (2016 or 2017), whereas 56.5% had been diagnosed between 2013 and 2015. While more cases of uterine, colorectal and thyroid cancers had been diagnosed two to five years before the index date than within the following two years, an opposite trend was observed for lung cancer (57.9% of the cases diagnosed in 2016 or 2017).

Data table for Figure 2
| 0 to 2 years (number) | percent | 0 to 5 years (number) | percent | |
|---|---|---|---|---|
| Males | ||||
| Prostate | 32,945 | 45.3 | 39,780 | 54.7 |
| Colon and rectum | 14,865 | 45.1 | 18,090 | 54.9 |
| Urinary bladder | 10,225 | 47.3 | 11,405 | 52.7 |
| Lung and bronchus | 8,925 | 61.9 | 5,505 | 38.1 |
| Non-Hodgkin lymphoma | 6,415 | 46.8 | 7,300 | 53.2 |
| Females | ||||
| Breast | 36,750 | 43.5 | 47,715 | 56.5 |
| Colon and rectum | 11,745 | 44.8 | 14,460 | 55.2 |
| Uterus (body, NOS) | 9,655 | 45.6 | 11,500 | 54.4 |
| Lung and bronchus | 10,545 | 57.9 | 7,670 | 42.1 |
| Thyroid | 6,370 | 37.9 | 10,440 | 62.1 |
Source: Canadian Cancer Registry linked to Canadian Vital Statistics - Death Database and tax data. |
||||
Estimated prevalence by age and sex
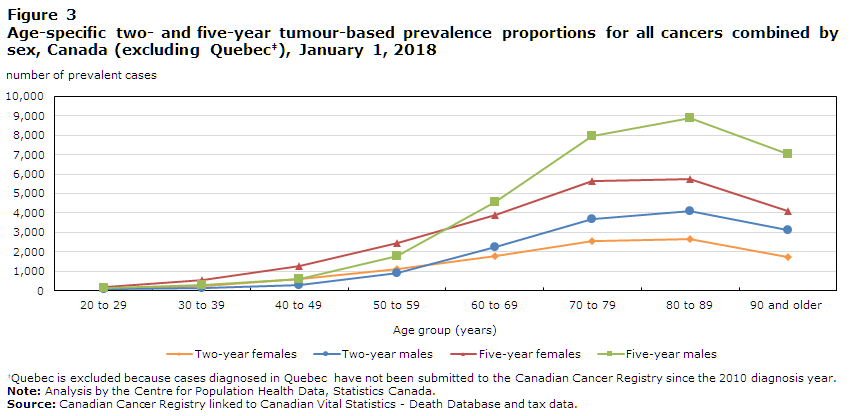
When five-year prevalence counts are considered, 74.3% of the total tumour cases among males and 61.9% of those among females were diagnosed among the population aged 60 years and older. The sex-specific prevalence proportions for all cancers combined increased substantially with age, as shown in Table 2 and Figure 3. The within-sex patterns of age-specific prevalence proportions for all cancers combined were similar for both durations, but differed between the sexes. Proportions were higher among females than males before age 60, and higher among males thereafter, peaking among the 80-to-89 age group in both cases.
| Cancer | All ages | 20 to 29 years |
30 to 39 years |
40 to 49 years |
50 to 59 years |
60 to 69 years |
70 to 79 years |
80 to 89 years |
90 years or older |
|---|---|---|---|---|---|---|---|---|---|
| Males | |||||||||
| All cancersTable 2 Note † | 1,759.6 | 156.2 | 295.2 | 609.9 | 1,786.8 | 4,541.0 | 7,939.3 | 8,903.0 | 7,011.2 |
| Prostate | 515.4 | 0.2 | 0.3 | 33.3 | 425.3 | 1,648.0 | 2,791.3 | 2,309.4 | 1,466.2 |
| Lung and bronchus | 102.3 | 1.2 | 3.3 | 12.0 | 69.4 | 266.5 | 579.4 | 661.6 | 361.3 |
| Colon and rectum | 233.6 | 8.9 | 24.6 | 78.9 | 256.8 | 573.5 | 1,054.6 | 1,379.2 | 1,070.1 |
| Urinary bladder (including in situ) | 153.3 | 1.7 | 6.2 | 27.8 | 104.1 | 324.8 | 794.4 | 1,290.9 | 1,223.0 |
| Non-Hodgkin lymphoma | 97.2 | 14.3 | 24.1 | 53.2 | 116.9 | 222.1 | 374.6 | 486.3 | 389.1 |
| Kidney and renal pelvis | 79.9 | 2.2 | 13.1 | 50.8 | 121.0 | 217.5 | 299.0 | 261.2 | 132.0 |
| Melanoma of the skin | 98.9 | 5.7 | 24.9 | 55.4 | 114.6 | 222.7 | 395.3 | 550.9 | 604.5 |
| Leukemia | 61.9 | 9.4 | 10.3 | 26.8 | 64.7 | 137.3 | 239.4 | 283.5 | 277.9 |
| Pancreas | 15.5 | 0.5 | 1.8 | 6.0 | 18.0 | 44.4 | 69.7 | 64.7 | 27.8 |
| Head and neckTable 2 Note †† | 80.9 | 2.7 | 8.2 | 37.4 | 133.1 | 243.0 | 281.5 | 247.5 | 250.2 |
| Stomach | 24.1 | 0.5 | 2.1 | 8.5 | 25.8 | 59.1 | 113.3 | 143.0 | 83.4 |
| Liver | 17.5 | 0.2 | 1.3 | 4.4 | 19.2 | 64.3 | 63.9 | 65.9 | 34.7 |
| Thyroid | 39.8 | 11.8 | 33.3 | 55.7 | 68.1 | 77.2 | 82.5 | 53.5 | 20.8 |
| Myeloma | 29.4 | 0.2 | 1.5 | 8.5 | 30.8 | 73.8 | 138.3 | 186.5 | 118.1 |
| Esophagus | 13.3 | 0.0 | 0.5 | 3.8 | 15.3 | 40.4 | 61.7 | 51.0 | 34.7 |
| Brain/CNS | 15.6 | 9.9 | 14.1 | 19.1 | 20.9 | 23.6 | 20.8 | 11.2 | 6.9 |
| Testis | 28.3 | 47.1 | 73.8 | 47.2 | 21.9 | 9.2 | 4.8 | 3.7 | 6.9 |
| Hodgkin lymphoma | 13.0 | 21.0 | 19.2 | 14.2 | 12.1 | 11.3 | 13.8 | 12.4 | 0.0 |
| Breast | 4.5 | 0.2 | 0.5 | 1.4 | 4.2 | 11.0 | 20.8 | 29.8 | 27.8 |
| All other cancers | 135.4 | 19.0 | 31.8 | 65.5 | 144.4 | 270.2 | 540.6 | 812.1 | 896.4 | Females |
| All cancersTable 2 Note † | 1,775.8 | 178.4 | 538.5 | 1,281.5 | 2,435.3 | 3,901.6 | 5,665.4 | 5,727.6 | 4,120.2 |
| Breast | 588.7 | 11.4 | 125.3 | 502.8 | 950.3 | 1,343.2 | 1,817.9 | 1,557.9 | 1,258.6 |
| Lung and bronchus | 127.0 | 1.3 | 4.1 | 18.0 | 106.4 | 317.3 | 637.9 | 568.3 | 195.0 |
| Colon and rectum | 182.7 | 11.4 | 26.7 | 73.2 | 190.4 | 363.5 | 676.0 | 993.3 | 810.6 |
| Uterus (body, NOS) | 147.5 | 1.6 | 16.3 | 70.3 | 230.9 | 457.3 | 475.0 | 299.3 | 149.3 |
| Thyroid | 117.2 | 49.0 | 125.6 | 201.6 | 207.4 | 176.9 | 155.8 | 90.9 | 27.4 |
| Non-Hodgkin lymphoma | 78.6 | 10.1 | 19.4 | 40.3 | 88.4 | 167.1 | 281.1 | 340.6 | 210.3 |
| Melanoma of the skin | 86.5 | 14.8 | 46.9 | 77.7 | 123.1 | 172.9 | 222.5 | 261.6 | 271.2 |
| Ovary | 43.1 | 8.5 | 16.6 | 39.0 | 76.0 | 97.9 | 115.8 | 79.0 | 24.4 |
| Pancreas | 13.2 | 0.5 | 2.8 | 5.3 | 16.0 | 33.1 | 50.0 | 45.9 | 18.3 |
| Urinary bladder (including in situ) | 45.7 | 1.3 | 3.6 | 8.5 | 35.9 | 93.8 | 193.9 | 278.2 | 249.9 |
| Leukemia | 41.5 | 8.0 | 11.7 | 19.1 | 42.0 | 77.3 | 135.3 | 152.4 | 134.1 |
| Kidney and renal pelvis | 43.5 | 1.6 | 8.9 | 27.9 | 61.7 | 102.6 | 150.1 | 135.0 | 45.7 |
| Head and neckTable 2 Note †† | 30.5 | 2.9 | 8.2 | 18.8 | 43.5 | 71.8 | 91.9 | 99.1 | 82.3 |
| Stomach | 13.2 | 0.5 | 2.5 | 6.1 | 13.8 | 27.3 | 51.9 | 62.4 | 42.7 |
| Myeloma | 21.5 | 0.3 | 1.0 | 6.1 | 21.6 | 49.4 | 92.9 | 107.4 | 51.8 |
| Cervix uteri | 30.8 | 9.8 | 50.9 | 65.3 | 45.9 | 36.6 | 28.1 | 21.1 | 15.2 |
| Brain/CNS | 12.0 | 5.8 | 12.0 | 11.7 | 15.5 | 18.0 | 16.7 | 8.3 | 3.0 |
| Liver | 5.3 | 0.3 | 0.8 | 1.9 | 5.6 | 13.1 | 20.0 | 23.9 | 6.1 |
| Esophagus | 4.0 | 0.0 | 0.3 | 0.8 | 4.9 | 9.6 | 16.7 | 18.4 | 9.1 |
| Hodgkin lymphoma | 10.3 | 21.2 | 16.6 | 9.0 | 7.0 | 8.7 | 10.0 | 9.2 | 6.1 |
| All other cancers | 133.1 | 18.3 | 38.5 | 77.5 | 149.6 | 264.1 | 426.9 | 571.9 | 505.9 |
Source: Canadian Cancer Registry linked to Canadian Vital Statistics - Death Database and tax data. |
|||||||||
Data table for Figure 3
| Two-year | Five-year | |||
|---|---|---|---|---|
| Females | Males | Females | Males | |
| 20 to 29 | 88.8 | 71.8 | 178.4 | 156.2 |
| 30 to 39 | 257.5 | 134.3 | 538.5 | 295.2 |
| 40 to 49 | 599.9 | 298.4 | 1281.5 | 609.9 |
| 50 to 59 | 1121.2 | 910.5 | 2435.3 | 1786.8 |
| 60 to 69 | 1808.3 | 2236.2 | 3901.6 | 4541.0 |
| 70 to 79 | 2581.6 | 3712.4 | 5665.4 | 7939.3 |
| 80 to 89 | 2636.6 | 4099.0 | 5727.6 | 8903.0 |
| 90 and older | 1755.3 | 3120.0 | 4120.2 | 7011.2 |
Source: Canadian Cancer Registry linked to Canadian Vital Statistics - Death Database and tax data. |
||||
Five-year prevalence proportions for most cancers were generally higher between 70 and 89 years of age for both males and females. However, Hodgkin lymphoma peaked among young adults of both sexes in the 20-to-29 age group. The proportions of testicular, cervical and female thyroid cancer were highest among the 30-to-39, 40-to-49 and 50-to-59 age groups, respectively, and decreased monotonically afterwards. Brain and central nervous system cancers (both sexes), head and neck cancers (males), and uterine cancer were highest among the 60-to-69 age group. The most prevalent cancers by age group also differed between the sexes. Among males, the age pattern of the leading cancers was the following: testicular cancer (20 to 39 years), colorectal cancer (40 to 49 years) and prostate cancer (50 and older); whereas, among females, thyroid cancer (20 to 39 years) and breast cancer (40 and older) were the most prevalent cancer types.
Discussion
This article presents an overview of short-term prevalence estimates by sex and age group for an extensive list of cancers. Considering two short-term durations permits to distinguish between groups of patients in different phases of care, which has implications both in terms of treatment and supportive care planning. Of all prevalent cancer cases on January 1, 2018, nearly half (47.1%) had been diagnosed within the previous two years (2016 and 2017). These patients were likely still receiving treatment or recovering from it, and represented the most intensive demand in terms of oncologic services. The remaining proportion of diagnoses (52.9%) had occurred within the previous two to five years (2013 to 2015) and, in most cases, still required close clinical follow-up, ongoing treatment or supportive care.Note 8
Prevalence mirrors the effects of both incidence and survival, thereby indicating the extent to which the disease affects the population.Note 11 For instance, the five-year prevalence of prostate cancer was 2.2 times that of its two-year prevalence due to both high incidence and high survival.Note 8Note 16 Conversely, the poor prognosis associated with lung cancer resulted in a much smaller ratio (1.6 times, both sexes combined) because the number of survivors steadily decreased as duration increased.Note 3
When comparing these prevalence figures with those of a previous national study,Note 7 the five-year cancer prevalence proportion in Canada increased from 1,412.4 to 1,767.8 per 100,000 people from 2005 to 2018, while another increase from 675.2 to 832.1 per 100,000 people was observed for two-year prevalence. An increase in prevalence translates into a greater demand for health care services and significantly adds to the economic burden of cancer. Similar results were presented in a study reporting that the costs of cancer care rose steadily from $2.9 billion in 2005 to $7.5 billion in 2012.Note 17 Such an increase in cancer prevalence over time is partly the result of population aging, since the incidence of most cancers increases with age.Note 9 Over the next few years, prevalence estimates will keep rising due to both an overall increase in cancer incidence and improvements in cancer survival as a result of the joint impact of screening, early detection and treatment.Note 18
Another finding worthy of mention is that the age distribution of prevalent cancer cases is strongly influenced by sex. Before age 60, females have higher prevalence proportions than males, mostly owing to the high prevalence of both thyroid and breast cancer among younger females. After age 60, the higher prevalence proportions among males than females can, in large part, be attributed to the high prevalence of prostate cancer among older males.
Strengths and limitations
This analysis is based on the CCR and CVSD, which are the most comprehensive data sources for cancer incidence and mortality in Canada. It provides important information for epidemiological surveillance at the national level. One of the main limitations of this analysis is the lack of data from Quebec, since the province has not submitted cancer incidence data to the CCR since the 2010 diagnosis year. Another limitation stems from the fact that limited-duration prevalence may overestimate the burden of cancer for two reasons. First, some cases that do not or no longer require care due to either overdiagnosis or full remission may have been included in the total counts. Second, some cancer patients may have left Canada between the date of their diagnosis and the index date. The impact of both factors is, however, attenuated by the short durations considered here.
Conclusion
In summary, this study presents the detailed estimates of two- and five-year cancer prevalence in Canada up to the beginning of 2018, providing crucial information for cancer control and clinical management programs. Future work should include more in-depth analysis, including long-term prevalence estimates.
Acknowledgement
All three datasets that compose the death-linked cancer incidence file used for these analyses (CCR, CVSD, T1PMF) are maintained by Statistics Canada. These data are collected from the Provincial/Territorial Cancer Registries, the provincial and territorial vital statistics registrars, and the Canada Revenue Agency, respectively. We gratefully acknowledge the cooperation of these institutions.
- Date modified: