
Figure 1
All-cause age-standardized acute-care hospitalization rates per 100,000 population, by population group and sex, Canada, excluding Quebec, 2006 and 2011 Canadian Census Health and Environment Cohorts
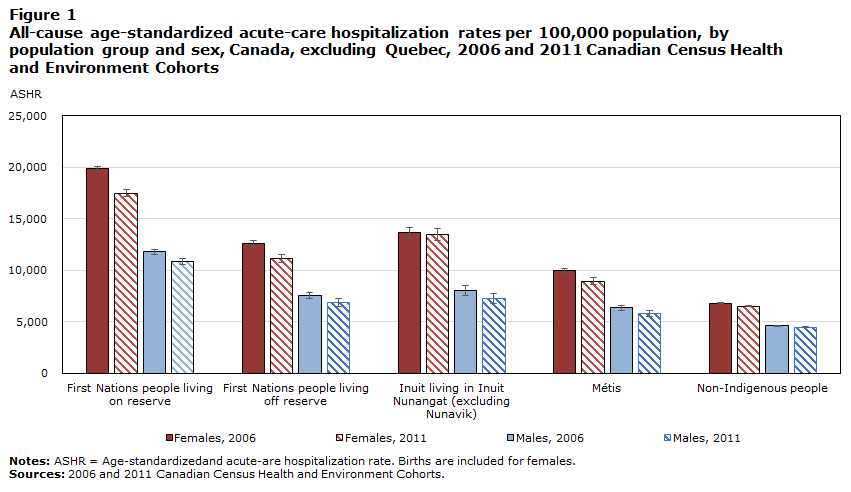
Data Table for Figure 1
| First Nations people living on reserve | from | to | First Nations people living off reserve | from | to | Inuit living in Inuit Nunangat (excluding Nunavik) | from | to | Métis | from | to | Non-Indigenous people | from | to | |
|---|---|---|---|---|---|---|---|---|---|---|---|---|---|---|---|
| Females, 2006 | 19,854 | 19,591 | 20,118 | 12,611 | 12,265 | 12,957 | 13,643 | 13,099 | 14,187 | 9,953 | 9,704 | 10,202 | 6,837 | 6,812 | 6,863 |
| Females, 2011 | 17,523 | 17,173 | 17,873 | 11,126 | 10,728 | 11,524 | 13,497 | 12,892 | 14,102 | 8,971 | 8,661 | 9,281 | 6,539 | 6,505 | 6,572 |
| Males, 2006 | 11,812 | 11,579 | 12,045 | 7,540 | 7,234 | 7,845 | 8,036 | 7,555 | 8,517 | 6,375 | 6,140 | 6,611 | 4,683 | 4,659 | 4,707 |
| Males, 2011 | 10,840 | 10,561 | 11,120 | 6,896 | 6,481 | 7,312 | 7,294 | 6,823 | 7,766 | 5,813 | 5,540 | 6,086 | 4,491 | 4,461 | 4,521 |
|
Notes: ASHR = Age-standardizedand acute-are hospitalization rate. Births are included for females. Sources: 2006 and 2011 Canadian Census Health and Environment Cohorts. |
|||||||||||||||
- Date modified: