
Figure 1
Data table for Figure 1
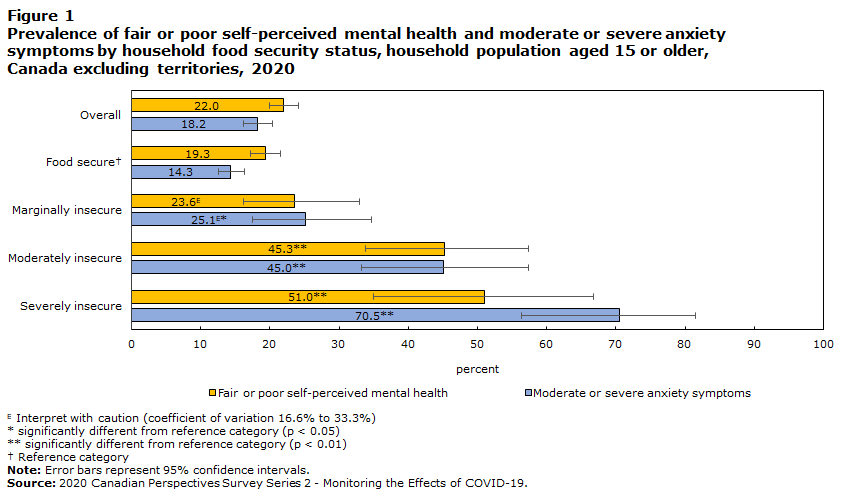
| Fair or poor self-perceived mental health | Moderate or severe anxiety symptoms | |||||
|---|---|---|---|---|---|---|
| percent | 95% lower confidence limit | 95% upper confidence limit | percent | 95% lower confidence limit | 95% upper confidence limit | |
| Overall | 22.0 | 19.9 | 24.2 | 18.2 | 16.2 | 20.4 |
| Food secureData table Note † | 19.3 | 17.2 | 21.5 | 14.3 | 12.5 | 16.3 |
| Marginally insecure | 23.6Note E: Use with caution | 16.2 | 33.0 | 25.1Note E: Use with caution Note * | 17.4 | 34.7 |
| Moderately insecure | 45.3Note ** | 33.8 | 57.4 | 45.0Note ** | 33.3 | 57.3 |
| Severely insecure | 51.0Note ** | 35.0 | 66.8 | 70.5Note ** | 56.3 | 81.6 |
E Use with caution
Source: 2020 Canadian Perspectives Survey Series 2 - Monitoring the Effects of COVID-19. |
||||||
- Date modified: