
Figure 2
Mean energy contributed by UPF subgroups, by age and sex, household population aged 2 to 18, Canada excluding territories, 2004 and 2015‡
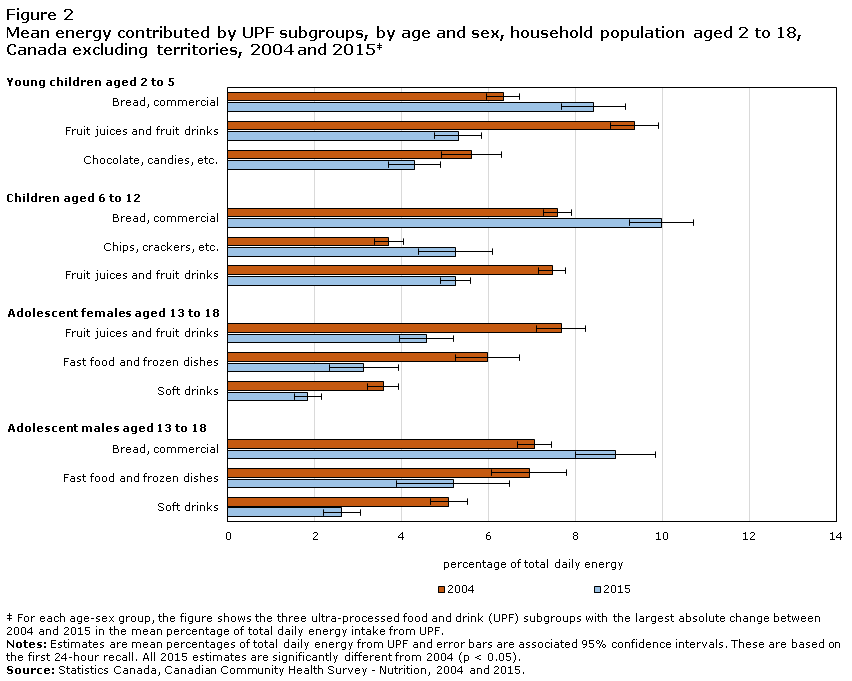
Data table for Figure 2
| Figure 2. Children and teens | 2015 | 2004 | ||||
|---|---|---|---|---|---|---|
| Estimate | 95% confidence interval | Estimate | 95% confidence interval | |||
| From | To | From | To | |||
| Adolescent boys, aged 13 to 18 | ||||||
| Soft drinks | 2.6 | 2.2 | 3.0 | 5.1 | 4.7 | 5.5 |
| Fast food and frozen dishes | 5.2 | 3.9 | 6.5 | 6.9 | 6.1 | 7.8 |
| Bread, commercial | 8.9 | 8.0 | 9.9 | 7.1 | 6.7 | 7.4 |
| Adolescent girls, aged 13 to 18 | ||||||
| Soft drinks | 1.8 | 1.5 | 2.2 | 3.6 | 3.2 | 3.9 |
| Fast food and frozen dishes | 3.1 | 2.3 | 3.9 | 6.0 | 5.2 | 6.7 |
| Fruit juices and fruit drinks | 4.6 | 4.0 | 5.2 | 7.7 | 7.1 | 8.2 |
| Children, aged 6 to 12 | ||||||
| Fruit juices and fruit drinks | 5.2 | 4.9 | 5.6 | 7.5 | 7.2 | 7.8 |
| Chips, crackers, etc. | 5.2 | 4.4 | 6.1 | 3.7 | 3.4 | 4.0 |
| Bread, commercial | 10.0 | 9.2 | 10.7 | 7.6 | 7.3 | 7.9 |
| Young children, aged 2 to 5 | ||||||
| Chocolate, candies, etc. | 4.3 | 3.7 | 4.9 | 5.6 | 4.9 | 6.3 |
| Fruit juices and fruit drinks | 5.3 | 4.8 | 5.8 | 9.4 | 8.8 | 9.9 |
| Bread, commercial | 8.4 | 7.7 | 9.2 | 6.3 | 6.0 | 6.7 |
Source: Statistics Canada, Canadian Community Health Survey - Nutrition, 2004 and 2015. |
||||||
- Date modified: