
Figure 1B
Percentage of men and women reporting very good or excellent general health, according to outdoor and indoor exercise
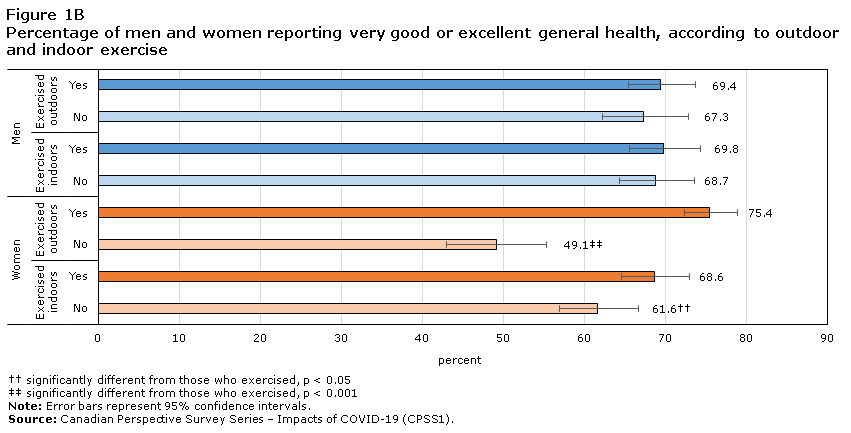
Data table for Figure 1B
| General health | Percent | 95% confidence interval | ||
|---|---|---|---|---|
| From | To | |||
| Men | ||||
| Exercised outdoors | Yes | 69.4 | 65.1 | 73.3 |
| No | 67.3 | 61.7 | 72.4 | |
| Exercised indoors | Yes | 69.8 | 65.2 | 74.0 |
| No | 68.7 | 63.9 | 73.2 | |
| Women | ||||
| Exercised outdoors | Yes | 75.4 | 72.0 | 78.5 |
| No | 49.1Data table Note ‡‡ | 43.0 | 55.3 | |
| Exercised indoors | Yes | 68.6 | 64.3 | 72.6 |
| No | 61.6Data table Note †† | 56.7 | 66.4 | |
Source: Canadian Perspective Survey Series – Impacts of Covid-19 (CPSS1). |
||||
- Date modified: