
Figure 7
Weighted percentage of CHMS sample reporting very good or excellent mental health, by walkability category and age group
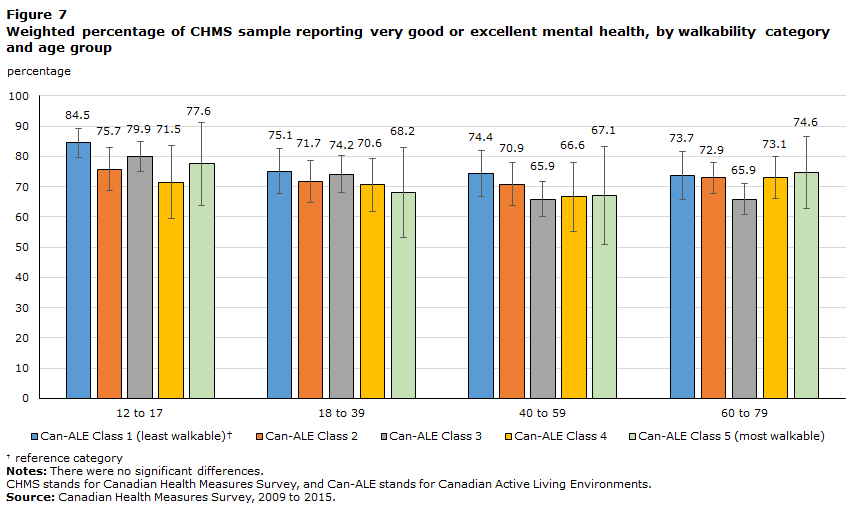
Data table for Figure 7
| Age | ||||||||
|---|---|---|---|---|---|---|---|---|
| 12 to 17 | Plus or minus | 18 to 39 | Plus or minus | 40 to 59 | Plus or minus | 60 to 79 | Plus or minus | |
| percentage (%) | ||||||||
| Can-ALE Class 1 (least walkable)Data table Note † | 84.5 | 4.8 | 75.1 | 7.4 | 74.4 | 7.7 | 73.7 | 7.9 |
| Can-ALE Class 2 | 75.7 | 7.0 | 71.7 | 7.1 | 70.9 | 7.1 | 72.9 | 5.1 |
| Can-ALE Class 3 | 79.9 | 5.0 | 74.2 | 6.1 | 65.9 | 5.8 | 65.9 | 5.0 |
| Can-ALE Class 4 | 71.5 | 12.0 | 70.6 | 8.8 | 66.6 | 11.5 | 73.1 | 6.9 |
| Can-ALE Class 5 (most walkable) | 77.6 | 13.7 | 68.2 | 14.9 | 67.1 | 16.2 | 74.6 | 11.8 |
CHMS stands for Canadian Health Measures Survey, and Can-ALE stands for Canadian Active Living Environments. Source: Canadian Health Measures Survey, 2009 to 2015. |
||||||||
- Date modified: