
Figure 1
Weighted percentage of CHMS sample classified as overweight or obese, by Can-ALE category and age group
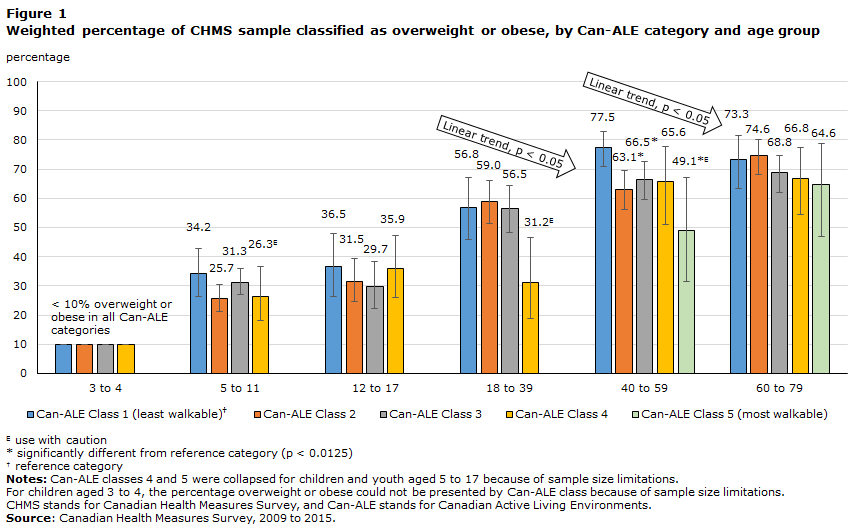
Data table for Figure 1
| Age | ||||||||||||
|---|---|---|---|---|---|---|---|---|---|---|---|---|
| 3 to 4 | Plus or minus | 5 to 11 | Plus or minus | 12 to 17 | Plus or minus | 18 to 39 | Plus or minus | 40 to 59 | Plus or minus | 60 to 79 | Plus or minus | |
| percentage (%) | ||||||||||||
| Can-ALE Class 1 (least walkable)Data table Note † | 10 | 0.0 | 34.2 | 7.8 | 36.5 | 10.1 | 56.8 | 11.0 | 77.5 | 6.6 | 73.3 | 10.0 |
| Can-ALE Class 2 | 10 | 0.0 | 25.7 | 4.3 | 31.5 | 6.9 | 59.0 | 7.6 | 63.1Note * | 6.9 | 74.6 | 6.3 |
| Can-ALE Class 3 | 10 | 0.0 | 31.3 | 4.2 | 29.7 | 7.3 | 56.5 | 8.1 | 66.5Note * | 6.8 | 68.8 | 6.7 |
| Can-ALE Class 4 | 10 | 0.0 | 26.3Note E: Use with caution | 8.2 | 35.9 | 10.0 | 31.2Note E: Use with caution | 12.2 | 65.6 | 14.6 | 66.8 | 12.5 |
| Can-ALE Class 5 (most walkable) | 10 | 0.0 | 0.0 | 0.0 | 0.0 | 0.0 | 0.0 | 0.0 | 49.1Note *Note E: Use with caution | 17.8 | 64.6 | 17.6 |
E use with caution
For children aged 3 to 4, the percentage overweight or obese could not be presented by Can-ALE class because of sample size limitations. CHMS stands for Canadian Health Measures Survey, and Can-ALE stands for Canadian Active Living Environments. Source: Canadian Health Measures Survey, 2009 to 2015. |
||||||||||||
- Date modified: