
Figure 2
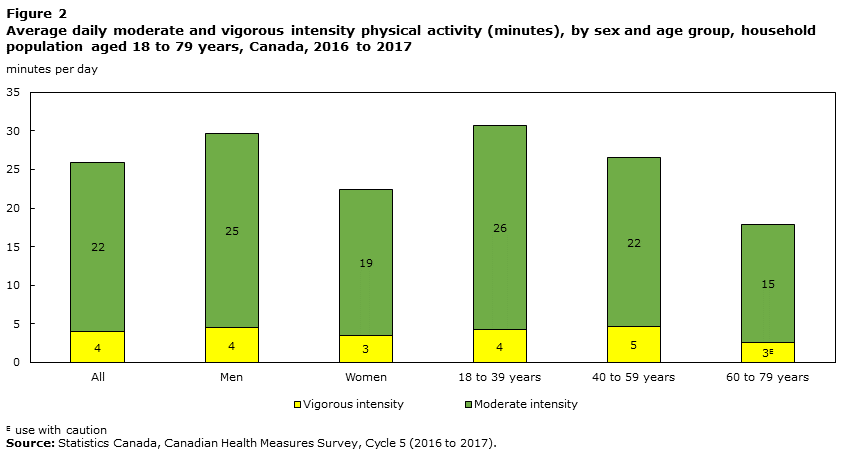
Average daily moderate and vigorous intensity physical activity (minutes), by sex and age group, household population aged 18 to 79 years, Canada, 2016 to 2017
Data table for Figure 2
| Cycle | All | Men | Women | 18 to 39 years | 40 to 59 years | 60 to 79 years |
|---|---|---|---|---|---|---|
| minutes per day | ||||||
| Vigorous intensity | ||||||
| 4 | 3 | 4 | 2 | 4 | 3 | 2 |
| 5 | 4 | 4 | 3 | 4 | 5 | 3Note E: Use with caution |
| Moderate intensity | ||||||
| 4 | 21 | 23 | 19 | 25 | 21 | 15 |
| 5 | 22 | 25 | 19 | 26 | 22 | 15 |
|
E use with caution Source: Statistics Canada, Canadian Health Measures Survey, Cycle 5 (2016 to 2017). |
||||||
- Date modified: