
Figure 4
Change in body mass index and waist circumference associated with 30-minute time reallocation between movement variables, by obesity status (overweight/obese versus underweight/healthy weight), household population aged 18 to 79, Canada excluding territories, 2007 through 2015
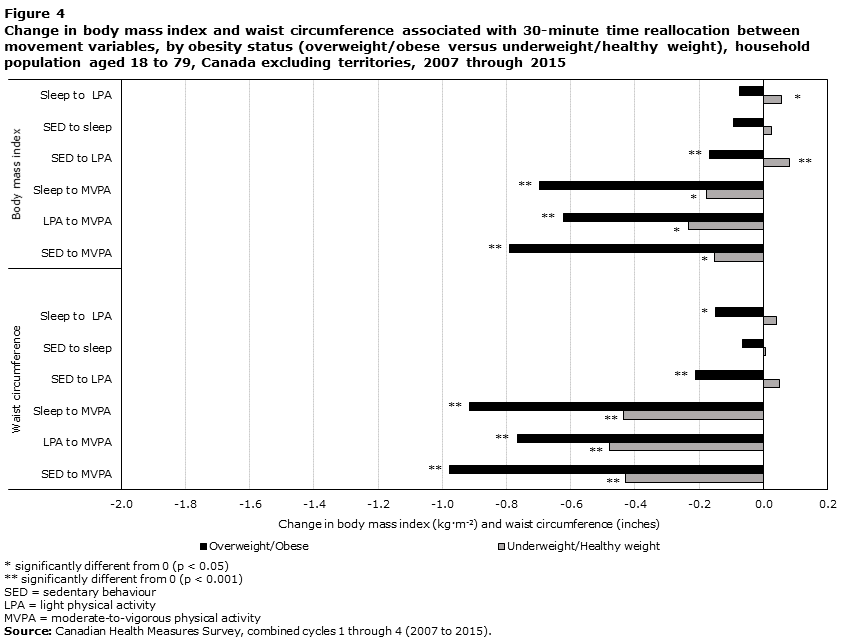
Data table for Figure 4
| Underweight/Healthy weight | Overweight/Obese | ||
|---|---|---|---|
| Change in body mass index (kg·m-2) and waist circumference (inches) |
|||
| Body mass index | Sleep to LPA | 0.06Note * | -0.07 |
| SED to sleep | 0.03 | -0.09 | |
| SED to LPA | 0.08Note ** | -0.17Note ** | |
| Sleep to MVPA | -0.18Note * | -0.70Note ** | |
| LPA to MVPA | -0.24Note * | -0.62Note ** | |
| SED to MVPA | -0.15Note * | -0.79Note ** | |
| Waist circumference | Sleep to LPA | 0.04 | -0.15Note * |
| SED to sleep | 0.01 | -0.06 | |
| SED to LPA | 0.05 | -0.21Note ** | |
| Sleep to MVPA | -0.44Note ** | -0.91Note ** | |
| LPA to MVPA | -0.48Note ** | -0.77Note ** | |
| SED to MVPA | -0.43Note ** | -0.98Note ** | |
LPA = light physical activity MVPA = moderate-to-vigorous physical activity Source: Canadian Health Measures Survey, combined cycles 1 through 4 (2007 to 2015). |
|||
- Date modified: