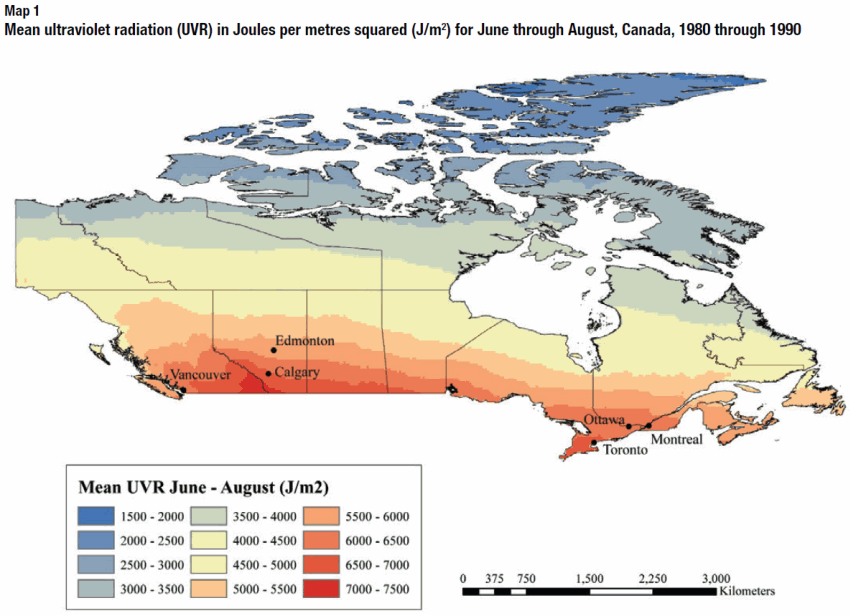
Map 1
Mean ultraviolet radiation (UVR) in Joules per metres squared (J/m2) for June through August, Canada, 1980 through 1990

Source: Environment Canada, modelled UVR data.
Description for Map 1
Mean ultraviolet radiation (UVR) across Canada diminishes at progressively higher latitudes. During the 1980-to-1990 period, mean UVR in the summer months (June through August) was in the 7,000 to 7,500 J/m2 range in Canada’s most southerly latitudes. By contrast, in the most northerly regions, mean summer-time UVR was in the 1,500 to 2,000 J/m2 range.
Significant differences in melanoma hazard ratios were evident between Calgary (6,500 to 7,000 J/m2 range) and Edmonton (5,500 to 6,000 J/m2 range) and between Toronto (6,500 to 7,000 J/m2 range) and Montreal (6,000 to 6,500 J/m2 range).
- Date modified: