Education Indicators in Canada: An International Perspective, 2020
Chapter D
Sustainable Developmental Goals (SDG) 4: Quality Education
Archived Content
Information identified as archived is provided for reference, research or recordkeeping purposes. It is not subject to the Government of Canada Web Standards and has not been altered or updated since it was archived. Please "contact us" to request a format other than those available.
D1 Online learning across Canada: Preparedness of students, teachers, and schools
Context
This chapter responds to Sustainable Development Goal 4 (SDG-4) for education, which is part of the UNESCO 2030 Agenda for Sustainable Development adopted on September 25, 2015, by the United Nations General Assembly. SDG-4 is one of a broader set of 17 social, economic, and environmental SDGs that form a universal call for action to end poverty, protect the planet, and ensure that all people enjoy peace and prosperity.
The overall aim of SDG-4 is to “ensure inclusive and equitable education and promote lifelong learning opportunities for all.” SDG-4 encompasses 10 targets and 43 indicators that cover many different aspects of educationNote . This analysis focuses on Target 4.4 Skills for Work (“by 2030, substantially increase the number of youth and adults who have relevant skills, including technical and vocational skills, for employment, decent jobs and entrepreneurshipNote ”) and contributes to Canada’s efforts towards one of the three Target 4.4 indicatorsNote :
- 4.4.1: Proportion of youth and adults with information and communications technology (ICT) skills, by type of skillsNote
This chapter also presents information that may provide timely insights by exploring how well Canadian students, teachers, and schools are prepared for and engaged in online learning in terms of both access and skills using data from two recent international large-scale assessments: the Programme for International Student Assessment (PISA) 2018 and the Progress in International Reading Literacy Study (PIRLS) 2016. These indicators, which provide insight into the ability of students to study and continue their schooling from home during school closures, are particularly relevant in light of the COVID-19 pandemic beginning in March 2020.
Students’ access to online learning from home
Having access to a computer and other electronic devices (tablet, etc.) at home is one of the fundamental requirements for online learning. Knowing how or how often students use those devices at home for their school work can also provide insights on their behaviours and attitudes towards online learning.
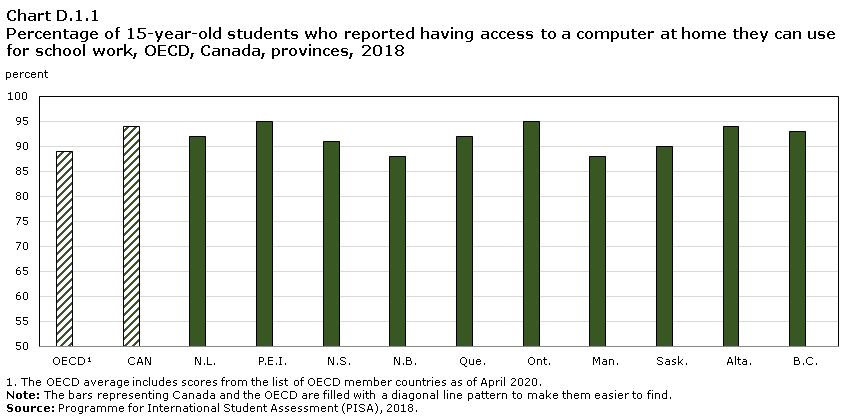
Data table for Chart D.1.1
| 2018 | ||
|---|---|---|
| percent | S.E. | |
| OECDData table Note 1 | 89 | (0.1) |
| CAN | 94 | (0.2) |
| N.L. | 92 | (0.9) |
| P.E.I. | 95 | (1.1) |
| N.S. | 91 | (0.8) |
| N.B. | 88 | (0.9) |
| Que. | 92 | (0.6) |
| Ont. | 95 | (0.4) |
| Man. | 88 | (1.0) |
| Sask. | 90 | (0.8) |
| Alta. | 94 | (0.5) |
| B.C. | 93 | (0.8) |
Source: Programme for International Student Assessment (PISA), 2018. |
||
- In 2018, more than 9 out of 10 Canadian 15-year-old students reported having access to a computer at home that they can use for school work. The trend was similar across provinces, except in New Brunswick, Manitoba, and Saskatchewan where it was slightly lower than 90%. In Ontario, more than 95% of students reported having access to a computer at home.
- Canadian students from the most socioeconomically disadvantaged schoolsNote are less likely to have access to a computer they can use at home. In 2018, 88% of students from socioeconomically disadvantaged schools reported having access to a computer at home, compared to 98% of students from socioeconomically advantaged schools.
- Although the share of Canadian students who reported having access to a computer at home that could be used for school work was higher than the OECD average, the total share decreased by 3 percentage points from 2006 to 2018. This downward trend varied between provinces for this specific time period, with the largest decrease by almost 8 points in Manitoba, and the lowest decrease in British Columbia by 2 percentage points. This decline should be interpreted with caution, in light of changes in technology, increased affordability and the use of computers over this period.
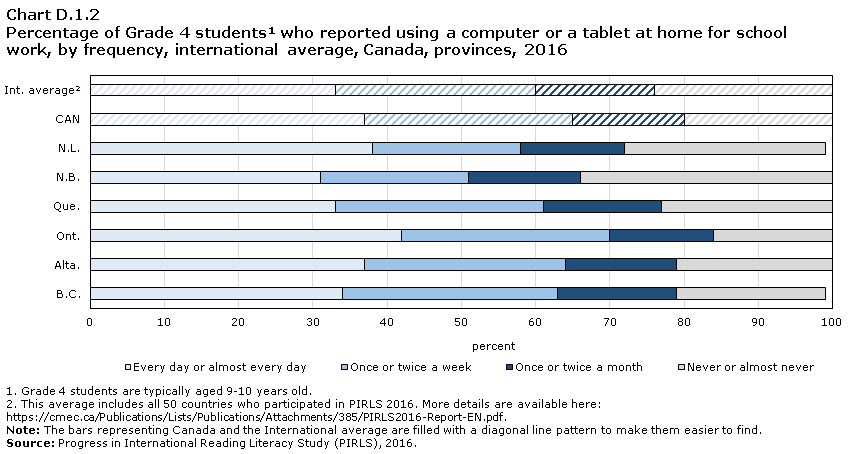
Data table for Chart D.1.2
| Every day or almost every day | Once or twice a week | Once or twice a month | Never or almost never | |||||
|---|---|---|---|---|---|---|---|---|
| percent | S.E. | percent | S.E. | percent | S.E. | percent | S.E. | |
| B.C. | 34 | (1.6) | 29 | (1.3) | 16 | (1.1) | 20 | (1.3) |
| Alta. | 37 | (1.7) | 27 | (1.0) | 15 | (1.0) | 21 | (1.4) |
| Ont. | 42 | (1.8) | 28 | (1.0) | 14 | (0.9) | 16 | (1.2) |
| Que. | 33 | (1.6) | 28 | (1.3) | 16 | (1.0) | 23 | (1.4) |
| N.B. | 31 | (1.6) | 20 | (1.1) | 15 | (0.9) | 34 | (1.4) |
| N.L. | 38 | (3.6) | 20 | (1.2) | 14 | (1.3) | 27 | (2.7) |
| CAN | 37 | (1.0) | 28 | (0.6) | 15 | (0.5) | 20 | (0.8) |
| Int. averageData table Note 2 | 33 | (0.2) | 27 | (0.1) | 16 | (0.1) | 24 | (0.2) |
Source: Progress in International Reading Literacy Study (PIRLS), 2016. |
||||||||
- In Canada, 37% of Grade 4 students reported using a computer or a tablet at home for school work every day or almost every day. In contrast, 1 out of 5 students reported never or almost never using a computer or a tablet at home for school work.
- These trends varied among participating provinces. For instance, the proportion of Grade 4 students who reported never or almost never using a computer or a tablet at home for school work in New Brunswick was more than double that in Ontario (34% compared to 16%). The difference between the lowest and highest percentages of Grade 4 students using a computer or a tablet every day or almost every day was not as large, although the range was again between Ontario (42%) and New Brunswick (31%).
- A higher proportion of Canadian students reported using a computer or a tablet at home for school work every day or almost every day than the international average (by 4 percentage points).

Data table for Chart D.1.3
| 2006 | 2015 | 2018 | ||||
|---|---|---|---|---|---|---|
| percent | S.E. | percent | S.E. | percent | S.E. | |
| OECDData table Note 1 | 55 | (0.2) | 56 | (0.1) | 58 | (0.1) |
| CAN | 65 | (0.6) | 69 | (0.6) | 75 | (0.5) |
| N.L. | 73 | (1.2) | 67 | (1.7) | 76 | (1.5) |
| P.E.I. | 62 | (1.3) | 66 | (3.0) | 80 | (3.3) |
| N.S. | 69 | (1.3) | 68 | (1.8) | 74 | (1.3) |
| N.B. | 63 | (1.0) | 66 | (1.9) | 69 | (1.3) |
| Que. | 51 | (1.1) | 55 | (1.5) | 58 | (1.0) |
| Ont. | 70 | (1.2) | 73 | (1.0) | 79 | (1.0) |
| Man. | 67 | (1.3) | 72 | (1.4) | 75 | (1.3) |
| Sask. | 67 | (1.3) | 67 | (1.5) | 76 | (1.1) |
| Alta. | 67 | (1.4) | 77 | (1.3) | 81 | (1.0) |
| B.C. | 69 | (1.0) | 74 | (1.2) | 80 | (1.4) |
Sources: Programme for International Student Assessment (PISA), 2006, 2015, 2018 |
||||||
- Having access to educational softwareNote at home can help students by fostering their digital competencies. In Canada, more than three-quarters of 15-year-old students reported having access to educational software in 2018. This proportion has increased by 10 percentage points since 2006.
- In 2018, the percentage of 15-year-old students across OECD countries who reported having access to educational software was on average 16 percentage points lower than in Canada and had only increased by 4 percentage points since 2006, from 55% to slightly more than 58%.
- Across provinces, in 2018, this proportion ranged from 58% in Quebec to more than 80% in Alberta and in British Columbia.
- The percentage of 15-year-old students who reported having access to educational software has increased in all provinces over time, except in Newfoundland and Labrador. Between 2006 and 2018, it increased by more than 10 percentage points in British Columbia, Alberta, and Prince Edward Island. Newfoundland and Labrador was the only province that showed a marked decrease of 6 percentage points, between 2006 and 2015.
Students’ digital skills for effective online learning
While Canadian students are still in the early years of their education in Grade 4, many students have already begun learning computer skills such as finding and reading information online. Knowing which digital skills are taught to students and by whom could help indicate the degree to which schools are fostering the development of these skills and what kind of preparation students are receiving for their further studies.
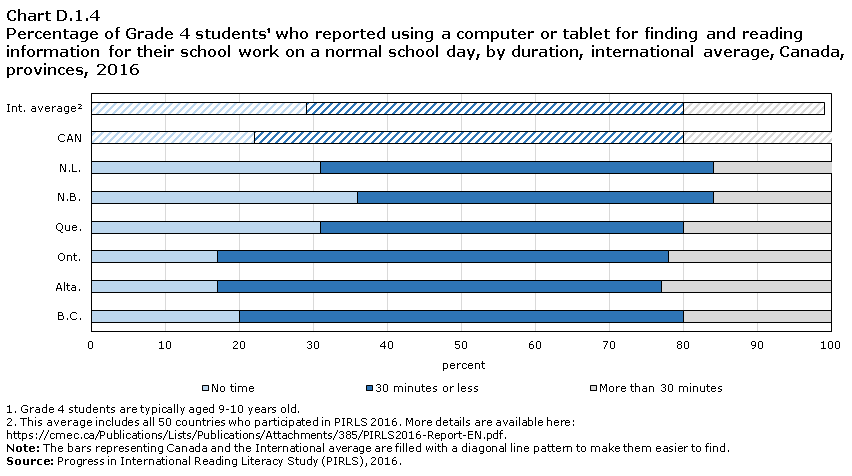
Data table for Chart D.1.4
| No time | 30 minutes or less | More than 30 minutes | ||||
|---|---|---|---|---|---|---|
| percent | S.E. | percent | S.E. | percent | S.E. | |
| B.C. | 20 | (1.4) | 60 | (1.3) | 20 | (1.4) |
| Alta. | 17 | (1.2) | 60 | (1.5) | 23 | (1.4) |
| Ont. | 17 | (1.0) | 61 | (1.1) | 22 | (1.0) |
| Que. | 31 | (2.2) | 49 | (1.9) | 20 | (1.7) |
| N.B. | 36 | (2.2) | 48 | (2.0) | 16 | (1.3) |
| N.L. | 31 | (2.1) | 53 | (2.2) | 17 | (1.1) |
| CAN | 22 | (0.7) | 58 | (0.7) | 21 | (0.7) |
| Int. averageData table Note 2 | 29 | (0.2) | 51 | (0.2) | 19 | (0.1) |
Source: Progress in International Reading Literacy Study (PIRLS), 2016. |
||||||
- In Canada, 78% of Grade 4 students reported spending more time using a computer or a tablet for finding and reading information for their school work than the international average (71%).
- The percentage of Grade 4 Canadian students that reported spending no time using a computer or a tablet for finding and reading information for their school work was 22%, 7 percentage points lower than the international average. Across participating provinces, this percentage varied significantly, from 17% in Ontario and Alberta to 36% in New Brunswick.

Data table for Chart D.1.5
| I mainly taught myself | My teachers | My family | My friends | I have never learned this | |||||||
|---|---|---|---|---|---|---|---|---|---|---|---|
| percent | S.E. | percent | S.E. | percent | S.E. | percent | S.E. | percent | S.E. | ||
| Int. averageData table Note 2 | Using a Computer | 46 | (0.3) | 14 | (0.2) | 37 | (0.3) | 2 | (0.1) | 1 | (0.0) |
| Typing | 54 | (0.3) | 18 | (0.3) | 24 | (0.2) | 2 | (0.1) | 3 | (0.1) | |
| Finding Information on the Internet | 44 | (0.3) | 21 | (0.3) | 31 | (0.3) | 2 | (0.1) | 2 | (0.1) | |
| CAN | Using a Computer | 45 | (1.0) | 11 | (0.8) | 40 | (1.2) | 2 | (0.4) | 1 | (0.2) |
| Typing | 49 | (1.3) | 21 | (1.2) | 25 | (1.1) | 2 | (0.3) | 2 | (0.5) | |
| Finding Information on the Internet | 40 | (0.9) | 25 | (1.2) | 31 | (1.1) | 2 | (0.3) | 2 | (0.3) | |
Source: Progress in International Reading Literacy Study (PIRLS), 2016. |
|||||||||||
- In Canada, more than 40% of students reported that using a computer, typing, and finding information on the Internet was self-taught. Students’ families were reported as the second most common source of teaching, followed by their teachers. Grade 4 student responses were similar across participating countries.
- In Canada, up to a quarter of Grade 4 students reported that their teachers taught them those skills. This proportion varied depending on the skill. While 25 and 21% of students reported that their teachers taught them how to find information on the Internet and how to type, respectively, only 11% of students reported that their teachers taught them how to use a computer.
- The percentage of Grade 4 students who reported that their teachers taught them how to use a computer was slightly higher among participating countries than in Canada (by 3 percentage points). However, for the other two digital skills, the percentage of students was a little higher in Canada than the international average (by 3 percentage points for typing, and by 4 percentage points for finding information on the Internet).
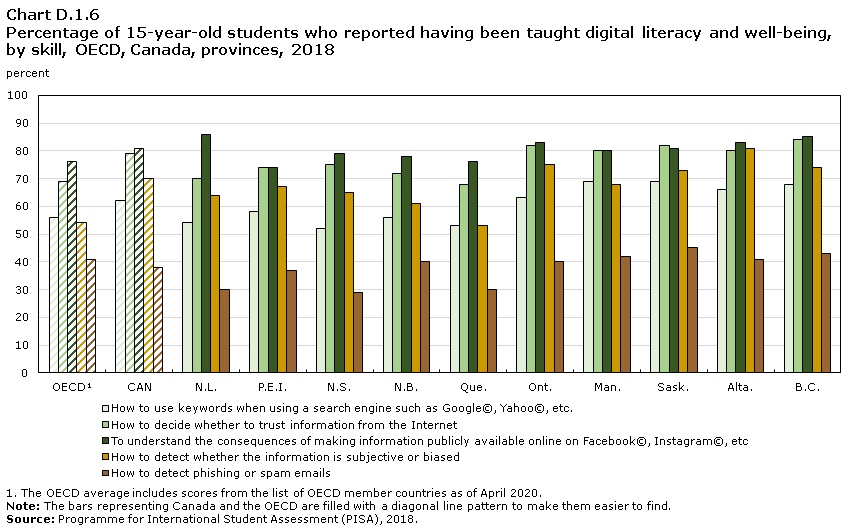
Data table for Chart D.1.6
| How to use keywords when using a search engine such as Google©, Yahoo©, etc. | How to decide whether to trust information from the Internet | To understand the consequences of making information publicly available online on Facebook©, Instagram©, etc | How to detect whether the information is subjective or biased | How to detect phishing or spam emails | ||||||
|---|---|---|---|---|---|---|---|---|---|---|
| percent | S.E. | percent | S.E. | percent | S.E. | percent | S.E. | percent | S.E. | |
| OECDData table Note 1 | 56 | (0.1) | 69 | (0.1) | 76 | (0.1) | 54 | (0.1) | 41 | (0.1) |
| CAN | 62 | (0.6) | 79 | (0.5) | 81 | (0.4) | 70 | (0.7) | 38 | (0.6) |
| N.L. | 54 | (2.0) | 70 | (1.6) | 86 | (1.1) | 64 | (1.8) | 30 | (1.6) |
| P.E.I. | 58 | (3.0) | 74 | (3.3) | 74 | (4.9) | 67 | (2.5) | 37 | (2.5) |
| N.S. | 52 | (1.6) | 75 | (1.3) | 79 | (1.2) | 65 | (1.5) | 29 | (1.3) |
| N.B. | 56 | (1.4) | 72 | (1.5) | 78 | (1.2) | 61 | (1.5) | 40 | (1.6) |
| Que. | 53 | (1.4) | 68 | (1.3) | 76 | (1.1) | 53 | (1.2) | 30 | (1.2) |
| Ont. | 63 | (1.2) | 82 | (0.9) | 83 | (0.8) | 75 | (1.1) | 40 | (1.2) |
| Man. | 69 | (1.3) | 80 | (1.0) | 80 | (0.9) | 68 | (1.2) | 42 | (1.5) |
| Sask. | 69 | (1.1) | 82 | (0.9) | 81 | (1.0) | 73 | (1.4) | 45 | (1.4) |
| Alta. | 66 | (1.1) | 80 | (1.1) | 83 | (0.9) | 81 | (1.3) | 41 | (1.1) |
| B.C. | 68 | (1.2) | 84 | (1.1) | 85 | (1.0) | 74 | (1.3) | 43 | (1.4) |
Source: Programme for International Student Assessment (PISA), 2018. |
||||||||||
- To ensure that students can develop their digital skills in a secure environment, teaching online safety and well-being is as important as fostering computational thinking. In Canada, 70% or more of 15-year-old students reported having been taught how to detect whether information is subjective or biased, how to decide whether to trust information from the Internet, and how to understand the consequences of making information publicly available online on Facebook©, Instagram©, etc. While, only 4 in 10 students were taught how to detect phishing or spam emails making this the skill least likely to be taught, similar to that of the OECD.
- A larger proportion of Canadian students reported having been taught digital literacy and well-being compared to the OECD average, except for how to detect phishing or spam emails.
- Compared to the other provinces, the percentage of 15-year-old students who reported having been taught digital literacy and well-being was among the highest in British Columbia, which ranked in the top 3 for all of the five skills. In contrast, this proportion of students was the lowest in Quebec, which ranked in the bottom 3 for all five skills.
Building school and system capacity for online learning
One aspect of a school’s ability to support the development of students’ skills and confidence towards the use of digital devices is by providing the student with access to a computer (or a tablet) in the classroom. This also enables educators to integrate digital technologies into their teaching and learning approaches. Access to a computer (or a tablet) in class may also help to address issues around digital equity for students with limited or no home access.
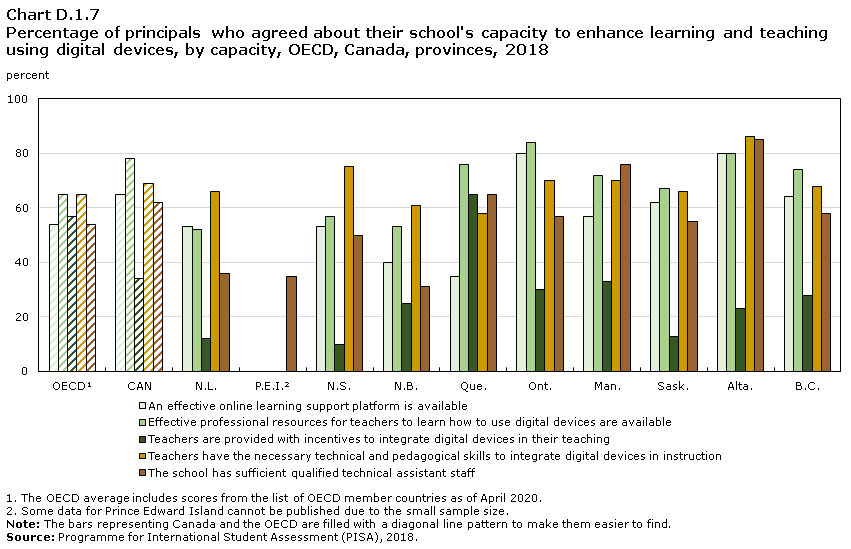
Through the School Questionnaire, PISA 2018 asked principals to assess their school's capacity to enhance learning and teaching using digital devices. This assessment of schools’ capacities to provide an effective online learning environment and to help students develop digital skills is especially insightful given the recent school closures due to COVID-19.
Data table for Chart D.1.7
| An effective online learning support platform is available | Effective professional resources for teachers to learn how to use digital devices are available | Teachers are provided with incentives to integrate digital devices in their teaching | Teachers have the necessary technical and pedagogical skills to integrate digital devices in instruction | The school has sufficient qualified technical assistant staff | ||||||
|---|---|---|---|---|---|---|---|---|---|---|
| percent | S.E. | percent | S.E. | percent | S.E. | percent | S.E. | percent | S.E. | |
| OECDData table Note 1 | 54 | (0.5) | 65 | (0.5) | 57 | (0.5) | 65 | (0.5) | 54 | (0.5) |
| CAN | 65 | (1.7) | 78 | (1.9) | 34 | (2.4) | 69 | (2.3) | 62 | (2.6) |
| N.L. | 53 | (3.2) | 52 | (3.4) | 12 | (2.9) | 66 | (2.9) | 36 | (3.4) |
| P.E.I.Data table Note 2 | Note F: too unreliable to be published | (1.7) | Note F: too unreliable to be published | (14.5) | Note F: too unreliable to be published | (11.5) | Note F: too unreliable to be published | (17.5) | 35 | (3.6) |
| N.S. | 53 | (3.7) | 57 | (4.6) | 10 | (1.8) | 75 | (3.8) | 50 | (3.1) |
| N.B. | 40 | (1.9) | 53 | (1.9) | 25 | (1.1) | 61 | (1.5) | 31 | (1.8) |
| Que. | 35 | (4.3) | 76 | (3.9) | 65 | (4.2) | 58 | (4.4) | 65 | (4.2) |
| Ont. | 80 | (3.4) | 84 | (3.7) | 30 | (4.7) | 70 | (4.6) | 57 | (5.5) |
| Man. | 57 | (3.2) | 72 | (2.9) | 33 | (2.6) | 70 | (2.9) | 76 | (2.3) |
| Sask. | 62 | (3.8) | 67 | (3.4) | 13 | (1.9) | 66 | (3.1) | 55 | (2.4) |
| Alta. | 80 | (4.6) | 80 | (4.1) | 23 | (4.9) | 86 | (4.4) | 85 | (3.6) |
| B.C. | 64 | (5.0) | 74 | (5.3) | 28 | (4.9) | 68 | (6.1) | 58 | (6.3) |
F too unreliable to be published
Source: Programme for International Student Assessment (PISA), 2018. |
||||||||||
- In Canada, at least 60% of 15-year-old students were enrolled in schools that, in the opinion of their principals, had a sufficient number of qualified technical assistant staff, teachers with the necessary technical and pedagogical skills to integrate digital devices in instruction, an effective online learning support platform, and effective professional resources for teachers to learn how to use digital devices.
- Canadian schools’ capacity to enhance learning and teaching using digital devices, as reported by school principals, was similar to or higher than the average across OECD countries for all capacities with the exception of the percentage of schools where teachers were provided with incentives to integrate digital devices.
- In Alberta, about 8 out of 10 students were enrolled in schools whose principal agreed with all of the reported capacities, with the exception of whether teachers were provided with incentives to integrate digital devices in their teaching.
- Across Canada, the difference in the proportion of students enrolled in schools where teachers were provided with incentives to integrate digital devices into their teaching ranged from 10% in Nova Scotia to 65% in Quebec. This was the largest range among the different capacities assessed.
- Variations exist between socioeconomically advantaged and disadvantaged Canadian schools. However, the differences were only statistically significant in favour of socioeconomically advantaged schools for the question of whether teachers had the necessary technical and pedagogical skills to integrate digital devices in instruction and whether an effective online learning support platform was available in the school.
Data table for Chart D.1.8
| Its own written statement about the use of digital devices | Its own written statement specifically about the use of digital devices for pedagogical purposes | A program to use digital devices for teaching and learning in specific subjects | A specific program to prepare students for responsible Internet behaviour | A specific policy about using social networks (e.g., Facebook™, etc.) in teaching and learning | ||||||
|---|---|---|---|---|---|---|---|---|---|---|
| percent | S.E. | percent | S.E. | percent | S.E. | percent | S.E. | percent | S.E. | |
| OECDData table Note 1 | 62 | (0.5) | 46 | (0.5) | 48 | (0.5) | 60 | (0.5) | 52 | (0.5) |
| CAN | 93 | (1.0) | 72 | (2.1) | 55 | (2.2) | 49 | (2.1) | 69 | (2.1) |
| N.L. | 97 | (1.5) | 79 | (2.9) | 57 | (3.1) | 76 | (1.6) | 91 | (1.4) |
| P.E.I.Data table Note 2 | 77 | (2.9) | Note F: too unreliable to be published | (17.9) | Note F: too unreliable to be published | (18.7) | 49 | (2.9) | Note F: too unreliable to be published | (16.0) |
| N.S. | 76 | (3.0) | 62 | (4.6) | 36 | (2.9) | 30 | (3.5) | 61 | (4.2) |
| N.B. | 79 | (1.4) | 61 | (1.6) | 43 | (1.3) | 47 | (2.0) | 48 | (1.5) |
| Que. | 98 | (1.1) | 89 | (2.9) | 48 | (5.1) | 47 | (4.7) | 54 | (4.8) |
| Ont. | 95 | (2.2) | 73 | (4.3) | 61 | (5.1) | 49 | (4.9) | 77 | (4.2) |
| Man. | 89 | (1.8) | 57 | (2.8) | 64 | (3.2) | 47 | (2.8) | 65 | (3.0) |
| Sask. | 87 | (2.1) | 65 | (2.8) | 50 | (2.8) | 60 | (3.4) | 73 | (3.1) |
| Alta. | 88 | (3.8) | 64 | (5.7) | 66 | (5.7) | 44 | (6.1) | 72 | (4.7) |
| B.C. | 89 | (3.9) | 62 | (6.5) | 44 | (5.8) | 55 | (5.2) | 68 | (5.5) |
F too unreliable to be published
Source: Programme for International Student Assessment (PISA), 2018. |
||||||||||
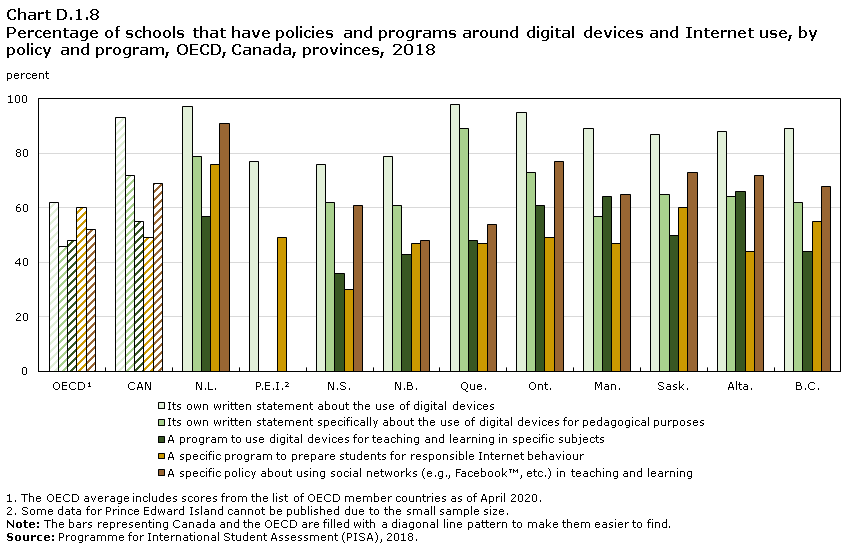
- In Canada, by far the most common policy or program was that schools had their own written statements about the use of digital devices (more than 9 out of 10 15-year-old students in schools whose principal self-reported such characteristics). Schools having their own written statements specifically about the use of digital devices for pedagogical purposes and schools having a specific policy about using social networks (e.g., Facebook™, etc.) in teaching and learning were also common practices (covering 72 and 69% of students respectively).
- The percentage of students attending schools with policies and programs around digital devices and Internet use was generally higher in Canada than the average across OECD countries, although there was a smaller percentage of Canadian students who attended schools that had a specific program to prepare students for responsible Internet behaviour.

Data table for Chart D.1.9
| Percent | S.E. | |
|---|---|---|
| Int. averageData table Note 2 | 43 | (0.4) |
| CAN | 65 | (1.8) |
| N.L. | 79 | (4.7) |
| N.B. | 53 | (4.1) |
| Que. | 45 | (4.9) |
| Ont. | 77 | (3.5) |
| Alta. | 74 | (4.4) |
| B.C. | 51 | (4.2) |
Source: Progress in International Reading Literacy Study (PIRLS), 2016. |
||
- As reported by Grade 4 teachers, in Canada, the percentage of students having computers (including tablets) available to use for their reading lessons in their class was about 65%, which was 21 percentage points higher than the average percentage across participating countries.
- The proportion of Grade 4 teachers who reported that they had computers (including tablets) available to students for their reading lessons in their class varied between provinces. It ranged from 45% in Quebec to almost 80% in Newfoundland and Labrador.
Start of text box 1
Building school and system capacity for distance learning in the Territories
Northwest Territories:
The Government of the Northwest Territories has developed a distance learning program called Northern Distance Learning (NDL), to provide equitable access to high school courses that are needed for entrance to postsecondary education. In the past, offering a wide-range of academic classes at small, rural community schools was difficult. The trend was to teach multiple courses in a single high school classroom or offer some courses on a rotating schedule. Now with NDL, videoconferencing, in combination with an array of other tools, is used to teach a single course online for classes of up to 20 students across multiple communities. Teachers and students interact and collaborate through a virtual private network and learning management system. The program allows students to stay in their home communities, meet graduation requirements, and prepare to enter postsecondary programs directly from high school.
Nunavut:
In Nunavut, the Department of Education offers distance education courses through the Alberta Distance Learning Centre, the Alberta-based Centre Francophone d’Éducation à Distance, and other approved distance education providers that have met the Ministerial curriculum requirements. Distance learning increases opportunities for students by providing courses or programs which cannot be offered locally due to a lack of resources or insufficient student numbers. During the COVID-19 related school closures, the Department of Education has also developed a learn-at-home website, Angirrami.comNote that provides free access to educational resources to help children and youth continue learning in the Inuit languages. The website’s resources include downloadable books, ebooks, audiobooks, songs, videos, and more. It also provides links to other online educational resources on subjects such as science, math, history, and social studies.
End of text box 1
Support for teachers providing online learning
Schools may provide support for teachers providing online learnings in a number of ways such as policies and practices that encourage digital teaching and learning. In addition, teachers need support and guidance to efficiently implement programs and policies around the use of digital devices, as well as to provide effective instruction using ICT in the classroom.

Data table for Chart D.1.10
| Regular discussions with teaching staff about the use of digital devices for pedagogical purposes | A specific program to promote collaboration on the use of digital devices among teachers | Scheduled time for teachers to meet to share, evaluate or develop instructional materials and approaches that employ digital devices | ||||
|---|---|---|---|---|---|---|
| percent | S.E. | percent | S.E. | percent | S.E. | |
| OECDData table Note 1 | 63 | (0.5) | 36 | (0.5) | 44 | (0.5) |
| CAN | 72 | (2.1) | 40 | (2.4) | 45 | (2.4) |
| N.L. | 85 | (3.1) | 51 | (3.4) | 34 | (2.5) |
| P.E.I. | 28 | (6.0) | 34 | (4.4) | 16 | (3.5) |
| N.S. | 80 | (3.7) | 26 | (4.2) | 37 | (3.9) |
| N.B. | 55 | (1.3) | 16 | (0.9) | 45 | (1.0) |
| Que. | 56 | (4.6) | 30 | (4.5) | 37 | (4.4) |
| Ont. | 83 | (3.6) | 43 | (5.4) | 43 | (5.4) |
| Man. | 70 | (3.1) | 42 | (3.0) | 53 | (2.6) |
| Sask. | 64 | (3.8) | 35 | (3.2) | 27 | (3.2) |
| Alta. | 62 | (5.9) | 49 | (6.0) | 54 | (6.2) |
| B.C. | 76 | (5.4) | 43 | (6.1) | 60 | (5.8) |
Source: Programme for International Student Assessment (PISA), 2018. |
||||||
- Having regular discussions with teaching staff about the use of digital devices for pedagogical purposes is a popular practice in Canadian schools. PISA 2018 data shows that 72% of 15-year-old students attended schools that adopted this practice, almost 10 percentage points higher than the OECD average.
- In contrast, the proportion of 15-year-old Canadian students in schools that adopted a specific program to promote collaboration on the use of digital devices among teachers was 40% (Newfoundland and Labrador was the only province where that percentage was higher than 50%). For the practice of having scheduled time set aside, that percentage was 45%, ranging from 16% in Prince Edward Island to 60% in British Columbia.

Data table for Chart D.1.11
| Percent | S.E. | |
|---|---|---|
| Int. averageData table Note 2 | 50 | (0.5) |
| CAN | 50 | (2.5) |
| N.L. | 53 | (6.0) |
| N.B. | 51 | (3.4) |
| Que. | 49 | (4.9) |
| Ont. | 47 | (4.9) |
| Alta. | 70 | (4.8) |
| B.C. | 46 | (4.2) |
Source: Progress in International Reading Literacy Study (PIRLS), 2016. |
||
- In Canada, about half of Grade 4 students were taught by teachers who reported that the lack of support using ICT was not at all a limit to how they teach their class. This proportion was the same as the average calculated among participating countries.
- Similarly, across provinces, the share of Grade 4 students whose teachers reported that the lack of support using ICT was not at all a limit to their instruction ranged from 46% to 53% among the participating provinces except in Alberta, where this percentage was higher at almost 70%.

Data table for Chart D.1.12
| Every day or almost every day | Once or twice a week | Once or twice a month | Never or almost never | ||||||
|---|---|---|---|---|---|---|---|---|---|
| percent | S.E. | percent | S.E. | percent | S.E. | percent | S.E. | ||
| F | CAN | 9 | (1.5) | 32 | (3.1) | 48 | (3.4) | 11 | (2.0) |
| Int. average | 8 | (0.5) | 29 | (0.8) | 45 | (1.0) | 17 | (0.7) | |
| E | CAN | 6 | (0.9) | 39 | (2.7) | 50 | (3.1) | 4 | (1.3) |
| Int. average | 9 | (0.5) | 35 | (0.9) | 45 | (1.0) | 10 | (0.6) | |
| D | CAN | 9 | (1.7) | 47 | (2.7) | 40 | (3.0) | 4 | (1.3) |
| Int. average | 15 | (0.6) | 42 | (1.0) | 37 | (0.9) | 6 | (0.6) | |
| C | CAN | 10 | (1.6) | 25 | (2.7) | 54 | (3.2) | 12 | (2.0) |
| Int. average | 11 | (0.5) | 27 | (0.9) | 44 | (0.9) | 17 | (0.8) | |
| B | CAN | 1 | (0.5) | 23 | (2.5) | 44 | (3.0) | 32 | (2.6) |
| Int. average | 6 | (0.5) | 25 | (0.8) | 38 | (1.0) | 31 | (0.9) | |
| A | CAN | 6 | (1.2) | 40 | (3.0) | 35 | (3.0) | 19 | (2.2) |
| Int. average | 10 | (0.5) | 33 | (0.9) | 38 | (0.9) | 19 | (0.8) | |
|
|||||||||
- Compared to the international average, Canadian Grade 4 teachers less frequently reported that they never or almost never implemented three computer activities during reading lessons: learning to be critical when reading on the Internet, researching a particular topic or problem and writing stories and other texts.
- In Canada, the most common computer activities were asking students to look up information (e.g., facts, definitions, etc.) and asking students to research a particular topic or problem. Teaching students strategies for reading digital texts was the least common activity. Almost a third of Grade 4 students never, or almost never, participated in this type of activity, according to their teachers.
- A larger proportion of students across participating countries participated in computer activities every day or almost every day than Canadian students (except learning to be critical when reading on the Internet or writing stories or other texts).
Start of text box 1
What can TALIS data tell us about teachers' preparedness to use ICT?
The Teaching and Learning International Survey (TALIS) is an international survey coordinated by the Organisation for Economic Co-operation and Development (OECD) that focuses on the learning environment and working conditions of teachers in schools.
Alberta is the only Canadian province or territory that participated in the most recent cycle of this survey, which was administered in 2018.
The questionnaire is designed to capture information on the working conditions and learning environments of schools, such as teacher training and development, teachers’ working hours, and teaching practices and beliefs. Teacher education was one of the themes explored in the survey and included questions pertaining to teacher preparation to use Information and Computer Technology (ICT).

Data table for Chart D.1.13a
| Percent | |
|---|---|
| Singapore | 88 |
| England (United Kingdom) |
75 |
| Alberta | 71 |
| Australia | 65 |
| United States | 63 |
| Korea | 59 |
| Finland | 56 |
| OECD average | 56 |
|
Note: The bars representing Alberta and the OECD average are filled with a diagonal line pattern to make them easier to find. Source: Teaching and Learning International Survey (TALIS), 2018. |
|
- TALIS 2018 data shows that the majority of teachers in Alberta attended pre-service teacher education programs that included ICT content for teaching. 71% of teachers in lower secondary institutions reported that their teacher training programs included ICT content for teaching, compared to 56% across OECD countries.

Data table for Chart D.1.13b
| Percent | |
|---|---|
| Singapore | 60 |
| England (United Kingdom) |
51 |
| Korea | 48 |
| United States | 45 |
| OECD average | 43 |
| Alberta | 42 |
| Australia | 39 |
| Finland | 21 |
|
Note: The bars representing Alberta and the OECD average are filled with a diagonal line pattern to make them easier to find. Source: Teaching and Learning International Survey (TALIS), 2018. |
|
- The majority of teachers in Alberta did not feel that their pre-service education prepared them well for the use of ICT for teaching. Only 42% of teachers in lower secondary schools felt prepared to integrate digital technologies in their teaching, and this proportion was similar to the OECD average (43%).
Data table for Chart D.1.13c
| I can support student learning through the use of digital technologyData table Note 1 | I use ICT for class workData table Note 2 | |
|---|---|---|
| percent | ||
| Australia | 78 | 78 |
| Alberta | 76 | 66 |
| Korea | 71 | 30 |
| United States | 69 | 60 |
| OECD average | 67 | 53 |
| Singapore | 63 | 43 |
| England (United Kingdom) |
62 | 41 |
| Finland | 57 | 51 |
Source: Teaching and Learning International Survey (TALIS), 2018. |
||
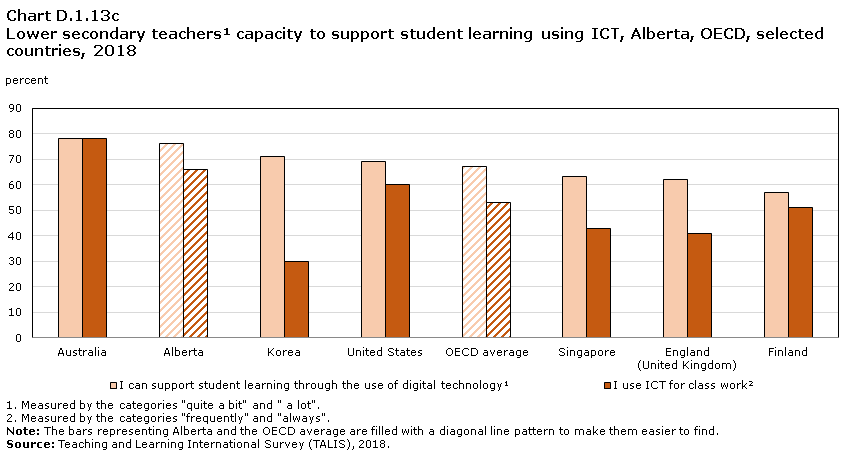
- Despite common feelings of unpreparedness for the use of ICT in teaching, the experience and skills that teachers in Alberta acquired over time and on the job helped them feel confident in their abilities to support students through the use of digital technologies. About two-thirds of Alberta teachers reported integrating ICT in their class work and more than 3 out of 4 teachers felt able to support student learning through the use of digital technology. These proportions were at 9 to 16 percentage points higher than the corresponding OECD averages.
End of text box 1
Definitions, sources and methodology
PISA
The Programme for International Student Assessment (PISA)Note is an international assessment of the skills and knowledge of 15-year-old students; in addition, it provides information about a range of factors that contribute to the success of students, schools, and education systems. PISA is a collaborative effort among member countries of the Organisation for Economic Co-operation and Development (OECD) and participating countries and economies.
PISA covers three domains: reading, mathematics, and science. Although each assessment includes questions from all three domains, the focus shifts across testing cycles. In 2000, the emphasis was on reading, with mathematics and science as minor domains. In 2003, mathematics was the major domain, and in 2006, it was science. In 2009, the focus was again reading, in 2012, mathematics, and in 2015, science. In the 2018 assessment, the focus was reading once again. The repetition of the assessments at regular intervals yields timely data that can be compared internationally and over time. All 10 provinces have participated in each assessment cycle.
As PISA is an international assessment, it measures skills that are generally recognized as key outcomes of the educational process. Rather than testing on knowledge of facts, the assessment focuses on the ability of young people near the end of compulsory schooling to use their knowledge and skills to meet real-life challenges.
Any PISA data reported in this report on the percentage of principals who self-reported certain characteristics should be interpreted as the percentage of 15-year-old students whose principal self-reported such characteristics. Similarly, any data reported on the percentage of schools with certain characteristics should be interpreted as the percentage of 15-year-old students in schools whose principal self-reported such characteristics.
PIRLS
The Progress in International Reading Literacy Study (PIRLS)Note is an international assessment that measures trends in reading achievement of Grade 4 students as well as the impact of policies and practices related to literacy. The study is administered every five years and is carried out by the International Association for the Evaluation of Educational Achievement (IEA), an independent cooperative of research institutions and governmental agencies.
In addition to data on reading achievement, PIRLS also collects a significant range of contextual information about home and school supports for literacy via student, home, teacher, and school questionnaires. The data from these questionnaires enable PIRLS to relate students’ achievement to curricula, instructional practices, and school environments.
Eight provinces participated to PIRLS 2016: Newfoundland and Labrador, New Brunswick, Quebec, Ontario, Manitoba, Saskatchewan, Alberta and British Columbia. However, because Saskatchewan and Manitoba did not oversample to create provincial-level estimates, their results could only be reported collectively, as part of the Canadian average.
In 2016, IEA created a new extension to the PIRLS assessment: ePIRLS, an innovative assessment of online reading. With the Internet now a major source of information at home and at school, reading curricula in countries around the world are acknowledging the importance of online reading. ePIRLS uses an engaging simulated Internet environment to measure Grade 4 students’ achievement in reading for informational purposes. Four provinces participated in ePIRLS: Newfoundland and Labrador, Quebec, Ontario and British Columbia. Because Quebec did not oversample to create provincial-level estimates, their results could only be reported collectively, as part of the Canadian average.
Any PIRLS data reported in this report on the percentage of teachers who self-reported certain characteristics should be interpreted as the percentage of Grade 4 students whose teachers self-reported such characteristics.
D2 Pathways of full-time students in a Bachelor’s or equivalent program
Context
This chapter provides information on Canada’s progress towards Sustainable Development Goals (SDG) Target 4.3 Technical, vocational, tertiary and adult education: By 2030, ensure equal access for all women and men to affordable quality technical, vocational and tertiary education, including university.
The focus of this chapter is the pathways of studentsNote who entered Bachelor’s programs. These indicators can enable a better understanding of the way in which education systems are functioning. The chapter presents the proportions of students who ultimately graduate with a Bachelor’s degree and the proportion that leave these studies without graduating. Students may also leave a program to continue in another tertiary level or program if it is a better fit for them, or persist in the same program for a longer period of time.
A variety of factors can influence these pathways, such as opportunities in the labour market, the quality of information a student has about programs before choosing and entering one and the length of the program itself. Comparisons of Canadian data, both at the national level and provincial/territorial level to that of other countries can help to shed light on these factors.
The indicators in this section focus on the pathways of full-time students registered in a Bachelor’s or equivalent program at two specific time points: one year and four years (the theoretical duration of a Bachelor’s program) after entry. The indicators are grouped in three sub-sections which cover respectively: the overall status of students (D2.1), graduation by the theoretical durationNote of a Bachelor’s degree (D2.2) and students who are no longer enrolled and have not graduated (D2.3).

Data table for Chart D.2.1a
| Still enrolled (Bachelor or equivalent) | Graduated (after one year)Data table Note 3 | Transferred to other tertiary program | Not enrolled in tertiary education | |
|---|---|---|---|---|
| percent | ||||
| AUS | 87 | Note ..: not available for a specific reference period | 1 | 12 |
| AUT | 82 | Note ..: not available for a specific reference period | 4 | 14 |
| FIN | 91 | Note ..: not available for a specific reference period | 1 | 8 |
| FRA | 79 | Note ..: not available for a specific reference period | 13 | 9 |
| ISR | 91 | Note ..: not available for a specific reference period | 0 | 8 |
| NLD | 88 | Note ..: not available for a specific reference period | 0 | 12 |
| NOR | 86 | Note ..: not available for a specific reference period | 2 | 12 |
| UKM | 92 | Note ..: not available for a specific reference period | 0 | 8 |
| USA | 91 | Note ..: not available for a specific reference period | 3 | 6 |
| CAN | 83 | 2 | 4 | 11 |
| N.L. | 77 | 2 | 5 | 17 |
| P.E.I. | 75 | 3 | 1Note E: Use with caution | 22 |
| N.S. | 79 | 2 | 3 | 17 |
| N.B. | 79 | 2 | 4 | 16 |
| Que. | 78 | 4 | 8 | 10 |
| Ont. | 89 | 1 | 2 | 8 |
| Man. | 76 | 3 | 2 | 19 |
| Sask. | 74 | 0 | 8 | 17 |
| Alta. | 77 | 1 | 3 | 18 |
| B.C. | 81 | 3 | 4 | 12 |
| Territories | 39 | 5 | Note F: too unreliable to be published | Note F: too unreliable to be published |
|
.. not available for a specific reference period E use with caution F too unreliable to be published
Sources: Education and Labour Market Longitudinal Platform (ELMLP) and Education at a Glance 2019: OECD Indicators. |
||||
- In 2017,Note 83% of Canadian students registered to a Bachelor’s degree or equivalent were still enrolled one year after entry. This proportion was highest in Ontario at 89%.
- When comparing Canada to the selected countries, most had a higher share of students still enrolled one year after entry except for France (79%) and Austria (82%). The United Kingdom (92%) was the country with the highest proportion of students still enrolled, followed by Finland, Israel and United States (91%).
- While France had the lowest proportion of Bachelor or equivalent program students still enrolled after one year, it had the highest proportion (13%) of students who had transferred to another tertiary program. In Canada, this proportion was highest in Quebec (8%).
- A small proportion, 5% of students in the territories and 4% in Quebec had graduated one year after enrolment. Normally this indicates that students have already accumulated credits elsewhere before starting this particular Bachelor’s program.
- Amongst the selected countries, the United States had the lowest percentage (6%) of students who were not enrolled and not graduated after one year. In Canada, this percentage was lowest in Ontario (8%) and Quebec (10%), and highest in Prince Edward Island (22%) and Manitoba (19%). It should be noted that this does not necessarily mean that students have left their studies, as it could be that they are continuing their studies in another jurisdiction or country.
Data table for Chart D.2.1b
| Graduated - Bachelor or equivalent | Graduated - Other tertiary program | Still enrolled - Bachelor or equivalentData table Note 2 | Still enrolled - Other tertiary educationData table Note 2 | Not graduated and not enrolled in tertiary education | |
|---|---|---|---|---|---|
| percent | |||||
| AUS | 33 | 0 | 49 | Note ..: not available for a specific reference period | 17 |
| AUT | 25 | 1 | 52 | Note ..: not available for a specific reference period | 22 |
| FIN | 43 | 1 | 43 | Note ..: not available for a specific reference period | 14 |
| FRA | 34 | 7 | 39 | Note ..: not available for a specific reference period | 20 |
| ISR | 60 | Note ..: not available for a specific reference period | 23 | Note ..: not available for a specific reference period | 17 |
| NLD | 28 | 0 | 55 | Note ..: not available for a specific reference period | 17 |
| NOR | 43 | 0 | 39 | Note ..: not available for a specific reference period | 17 |
| UKM | 68 | 4 | 16 | Note ..: not available for a specific reference period | 12 |
| USA | 36 | 3 | 42 | Note ..: not available for a specific reference period | 19 |
| CAN | 42 | 5 | 32 | 8 | 13 |
| N.L. | 23 | 5 | 39 | 11 | 22 |
| P.E.I. | 37 | 8 | 25 | 7 | 24 |
| N.S. | 47 | 4 | 22 | 6 | 22 |
| N.B. | 40 | 4 | 24 | 8 | 24 |
| Que. | 58 | 10 | 20 | 10 | 4 |
| Ont. | 45 | 3 | 35 | 6 | 12 |
| Man. | 27 | 4 | 36 | 7 | 26 |
| Sask. | 23 | 8 | 31 | 17 | 21 |
| Alta. | 29 | 7 | 36 | 13 | 16 |
| B.C. | 29 | 6 | 38 | 12 | 16 |
| Territories | 33 | Note F: too unreliable to be published | 4 | 5 | Note F: too unreliable to be published |
|
.. not available for a specific reference period F too unreliable to be published
Sources: Education and Labour Market Longitudinal Platform (ELMLP) and Education at a Glance 2019: OECD Indicators. |
|||||
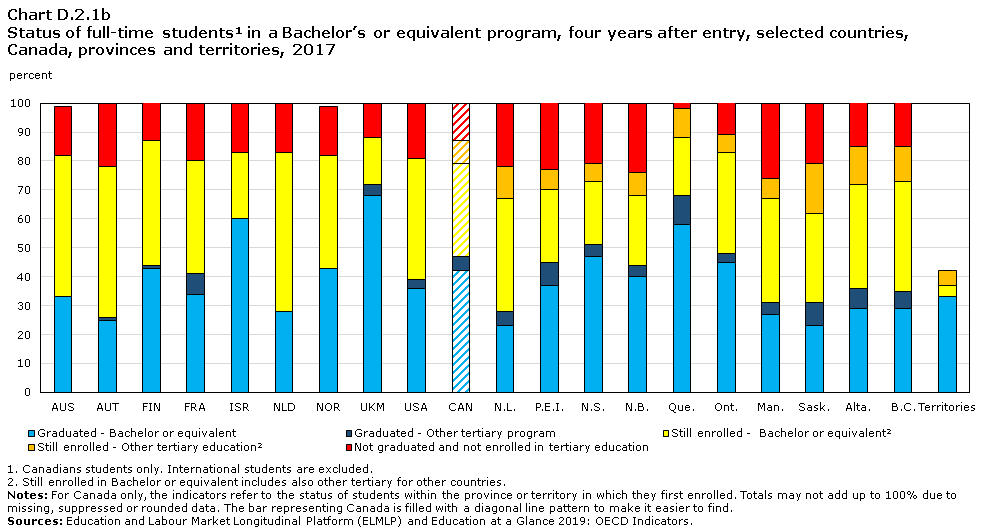
- Quebec students had the highest graduation rate after four years (68%) from any program, with 58% having graduated from a Bachelor degree or equivalent program and 10% graduating from a different tertiary program. Quebec also had the lowest proportion of people who were no longer enrolled and not graduated from a tertiary program with 4%.
- The United Kingdom (68%) and Israel (60%) had the highest graduation rates amongst the selected countries.
- Newfoundland and Labrador and Saskatchewan (23%) had the lowest proportion of students who graduated within the province after four years, which is lower than the national average of 42%. However, along with Alberta and British-Columbia, these two provinces had the highest proportions of students still enrolled after four years in tertiary education, with close to one in two of their students in this situation. A similar pattern can be observed in other countries such as Austria, Netherlands and Australia.
- Around one in four students in Manitoba, New-Brunswick and Prince Edward Island had left tertiary education in their province without graduating after four years, which is also a higher proportion than those observed in all other selected countries.

Data table for Chart D.2.1c
| Women | Men | Total | |
|---|---|---|---|
| percent | |||
| Not graduated and not enrolled | 11 | 15 | 13 |
| Still enrolled - Other tertiary education | 8 | 8 | 8 |
| Still enrolled - Bachelor or equivalent | 29 | 36 | 32 |
| Graduated - Other tertiary program | 5 | 5 | 5 |
| Graduated - Bachelor or equivalent | 48 | 35 | 42 |
Source: Education and Labour Market Longitudinal Platform (ELMLP). |
|||
- At the Canada level, a higher proportion of women (48%) graduated in a Bachelor’s or equivalent program four years after entry when compared with men (35%). The reverse is seen in the percentage of student still enrolled in that same program, with 36% for men and 29% for women.
- There is no difference between the genders when looking at the percentages of students who moved to other tertiary programs, whether they graduated (5%) or were still enrolled (8%).
- 15% of men had left tertiary education in their province or territory without graduating while this was the case for 11% of women.
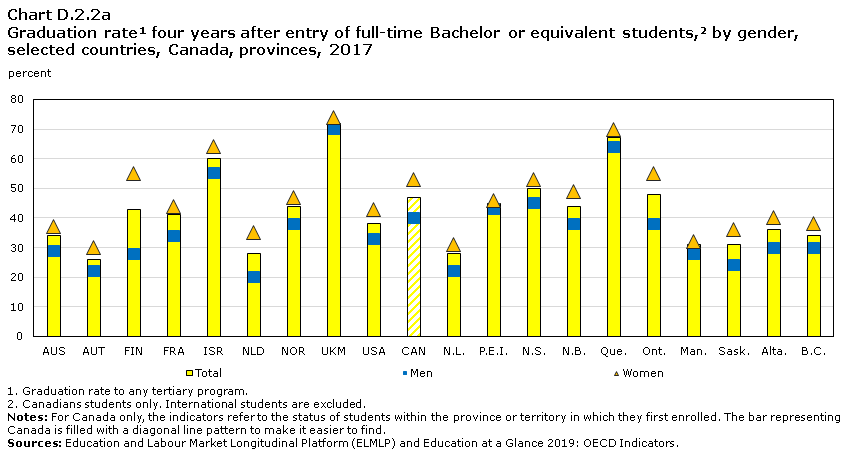
Data table for Chart D.2.2a
| Total | Men | Women | |
|---|---|---|---|
| AUS | 34 | 29 | 37 |
| AUT | 26 | 22 | 30 |
| FIN | 43 | 28 | 55 |
| FRA | 41 | 34 | 44 |
| ISR | 60 | 55 | 64 |
| NLD | 28 | 20 | 35 |
| NOR | 44 | 38 | 47 |
| UKM | 72 | 70 | 74 |
| USA | 38 | 33 | 43 |
| CAN | 47 | 40 | 53 |
| N.L. | 28 | 22 | 31 |
| P.E.I. | 45 | 43 | 46 |
| N.S. | 50 | 45 | 53 |
| N.B. | 44 | 38 | 49 |
| Que. | 67 | 64 | 70 |
| Ont. | 48 | 38 | 55 |
| Man. | 31 | 28 | 32 |
| Sask. | 31 | 24 | 36 |
| Alta. | 36 | 30 | 40 |
| B.C. | 34 | 30 | 38 |
Sources: Education and Labour Market Longitudinal Platform (ELMLP) and Education at a Glance 2019: OECD Indicators. |
|||
- In all provinces and selected countries, women had a higher graduation rate than men, with 53% of women and 40% of men graduating within four years in Canada.
- In all selected countries, the most noticeable difference between the genders was in Finland with 55% for women and 28% for men. Ontario was the Canadian province with the largest difference with 55% for women and 38% for men.
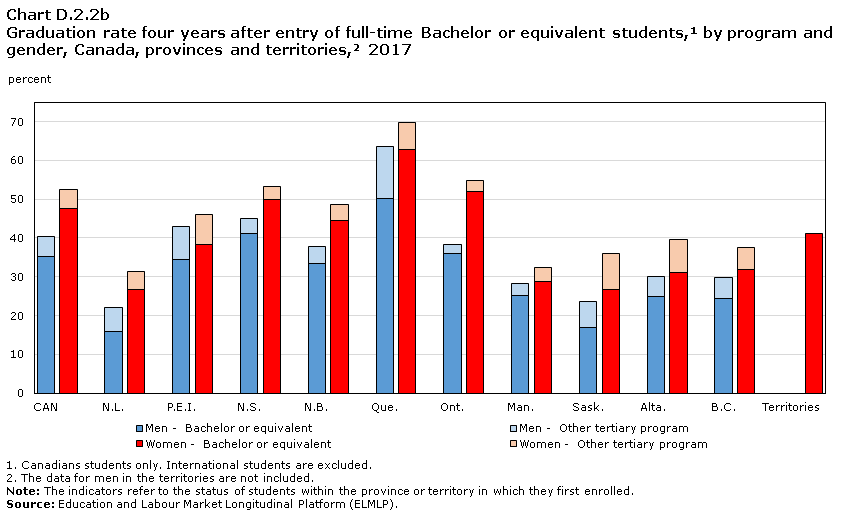
Data table for Chart D.2.2b
| Bachelor or equivalent | Other tertiary program | |||
|---|---|---|---|---|
| Men | Women | Men | Women | |
| percent | ||||
| CAN | 35 | 48 | 5 | 5 |
| N.L. | 16 | 27 | 6 | 5 |
| P.E.I. | 34 | 38 | 9Note E: Use with caution | 8Note E: Use with caution |
| N.S. | 41 | 50 | 4 | 3 |
| N.B. | 34 | 44 | 4 | 4 |
| Que. | 50 | 63 | 13 | 7 |
| Ont. | 36 | 52 | 2 | 3 |
| Man. | 25 | 29 | 3 | 4 |
| Sask. | 17 | 27 | 7 | 9 |
| Alta. | 25 | 31 | 5 | 9 |
| B.C. | 24 | 32 | 6 | 6 |
| Territories | Note F: too unreliable to be published | 41 | Note F: too unreliable to be published | Note F: too unreliable to be published |
|
E use with caution F too unreliable to be published
Source: Education and Labour Market Longitudinal Platform (ELMLP). |
||||
- Provinces with the largest differences in the proportion of women and men who graduated from a Bachelor or equivalent programs were Ontario and Quebec with 63% versus 50%, and 52% versus 36% respectively. Manitoba and Prince Edward Island had the smallest gender difference (4 percentage points).
- As noted in section D2.1c, there was no difference at the Canada-level between genders in the proportion of students who moved to another tertiary program. However, differences between genders are observed in the provinces amongst students who graduated in another tertiary program. Men were more likely than women, in Quebec, to move to another tertiary program (13% versus 7%). The opposite trend was observed in Alberta (9% for women compared to 5% for men) and Saskatchewan (9% for women compared to 7% for men).

Data table for Chart D.2.3a
| After one year | After four years | |
|---|---|---|
| percent | ||
| AUS | 12 | 17 |
| AUT | 14 | 22 |
| FIN | 8 | 14 |
| FRA | 9 | 20 |
| ISR | 8 | 17 |
| NLD | 12 | 17 |
| NOR | 12 | 17 |
| UKM | 8 | 12 |
| USA | 6 | 19 |
| CAN | 11 | 13 |
| N.L. | 17 | 22 |
| P.E.I. | 22 | 24 |
| N.S. | 17 | 22 |
| N.B. | 16 | 24 |
| Que. | 10 | 4 |
| Ont. | 8 | 12 |
| Man. | 19 | 26 |
| Sask. | 17 | 21 |
| Alta. | 18 | 16 |
| B.C. | 12 | 16 |
Sources: Education and Labour Market Longitudinal Platform (ELMLP) and Education at a Glance 2019: OECD Indicators. |
||
- In most provinces, the proportion of students who were not enrolled, and had not graduated, was higher after four years, when compared to the proportion after one year. The exceptions were Quebec and Alberta.
- In Quebec, while one in ten students left after one year, only one in 25 were no longer enrolled or not graduated in tertiary education four years after. This could be partially explained by the length of the Bachelor’s program in Quebec (usually three years) and the multiple programs offered in colleges. In Alberta, this proportion of students was 16% after four years and 18% after one year.
- While the difference between the proportion of students who left tertiary education without graduating after one and four years is 2 percentage points in Canada, it is 13 percentage points in United States and 11 percentage points in France.
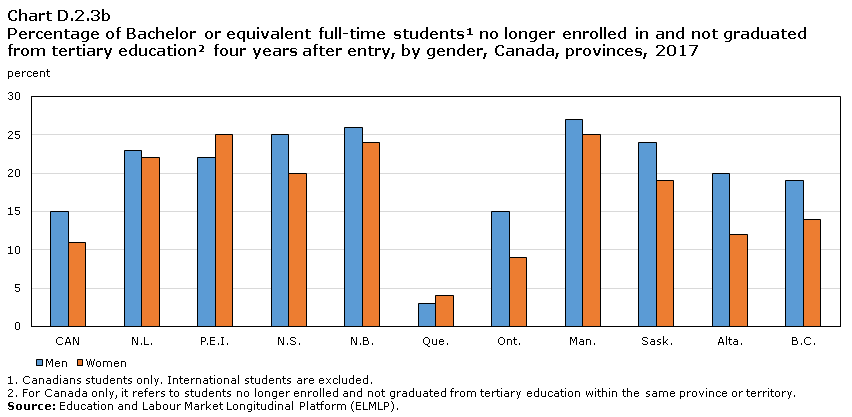
Data table for Chart D.2.3b
| Men | Women | |
|---|---|---|
| percent | ||
| CAN | 15 | 11 |
| N.L. | 23 | 22 |
| P.E.I. | 22 | 25 |
| N.S. | 25 | 20 |
| N.B. | 26 | 24 |
| Que. | 3 | 4 |
| Ont. | 15 | 9 |
| Man. | 27 | 25 |
| Sask. | 24 | 19 |
| Alta. | 20 | 12 |
| B.C. | 19 | 14 |
|
||
- As shown in D2.1c, there was a higher proportion of men than women who had left tertiary education on average in Canada. This is also the case for all provinces, except Prince Edward Island and Quebec, where the shares of men and women are 22% versus 25%, and 3% versus 4% respectively.
- The differences between genders was most apparent in Alberta with 20% of men and 12% of women, and Ontario with 15% of men versus 9% of women.
- The share of students who were no longer enrolled or graduated after four years was highest in Manitoba for both men (27%) and women (25%).
Definitions, sources and methodology
Education and Labour Market Longitudinal Platform
The data in this chapter come from the Education and Labour Market Longitudinal Platform (ELMLP), an innovative dataset that allows for a more complete understanding of student pathways and outcomes.
The ELMLP is a platform of securely integrated anonymized datasets that are longitudinal and accessible for research and statistical purposes. More specifically, it enables analysis of anonymized data on past cohorts of college and university students and registered apprentices, to better understand their pathways and how their education and training affect their career prospects in terms of earnings.
Statistics Canada, in collaboration with the provinces and territories, Employment and Social Development Canada (ESDC), and other stakeholders, has developed the ELMLP.
For more information about the ELMLP, please refer to the Technical Reference Guides for the Education and Labour Market Longitudinal Platform (ELMLP) (https://www150.statcan.gc.ca/n1/en/catalogue/37200001).
Methodology and definitions
Student status in Canada and age
The data were calculated for students aged 15 and over. Age group is based on the age of students on December 31st of the first academic year in which they started the program. Students with missing age, immigration status or missing gender information were excluded.
Following the calculation of the indicators in Education at a Glance 2019, data were calculated for Canadians students only. Student status in Canada is defined at the end of the winter term, during the first year of enrolment. "Canadian students" include Canadian citizens and permanent residents. Students with a missing immigration status for the year of enrolment were excluded from this analysis.
Cohorts and concepts
Data from the 2016/2017 cohort of the Postsecondary Student Information System (PSIS) was used to calculate the status of full-time students who entered a Bachelor or equivalent program after one year. Data from the 2013/2014 cohort was used for the status after four years (theoretical duration).
An entry cohort is based on the new entrants to a program leading to a specific educational qualification who were enrolled full time during the fall term of that Postsecondary Student Information System (PSIS) reporting year.
The persistence and graduation indicators refer to all students who persisted or graduated within the province or territory in which they first enrolled.
Not enrolled and not graduated: includes students who were not continuing their studies and not graduated from any tertiary qualification after the stated number of years after entry within the province or territory of first entry. This rate is not cumulative. For example, a student could drop out the first year (would be included as not enrolled and not graduated after one year) and come back to show up as persistent after four years.
Graduation rate: the percentage of students in an entry cohort that have completed the requirements for graduation by the end of the calendar year within the stated number of years after the fall term of their entry year. This rate is cumulative. Note that if students are enrolled in a program where there is an agreement that the educational qualification is granted by an institution in another province or territory, the record will not be counted as graduated in the original province or territory.
Persistence rate or proportion of students who pursued their studies after one or four years: the percentage of students in an entry cohort that were still enrolled in the fall term after the stated number of years from year of first entry.
Persistence rate after one year: excludes students who had already graduated by that time. A small proportion of students graduate after one year for various reasons, e.g. in cases where a large portion of the courses were already completed before he or she registered in a Bachelor degree or equivalent program.
For more information, please refer to the Technical Reference Guide, “Persistence and graduation indicators of postsecondary students, 2011/2012 to 2016/2017” (https://www150.statcan.gc.ca/n1/pub/37-20-0001/372000012020003-eng.htm).
Students were grouped according to the ISCED levels and only students who first enrolled in a Bachelor’s or equivalent program (ISCED level 6) are included in this analysis. The educational qualifications pursued and obtained by the new entrants are grouped according to the definitions in the Classification of programs and credentials: (http://www23.statcan.gc.ca/imdb/p3VD.pl?Function=getVD&TVD=1252482).
Geography
The geography refers to the student's province or territory of first enrolment.
The small proportion of students who pursued or graduated with their educational qualification outside the province or territory of first enrolment were not counted as persistent or graduated in the original province or territory.
Canada-level indicators are not strictly comparable to the indicators measured within the same province/territory (even if they are shown in the same table) due to how students with multiple records are counted and treated. The Postsecondary Student Information System (PSIS) data can include more than one record for a student in a given year, if the student is enrolled in more than one program and/or more than one institution. For further information on multiple programs and the differences between the types of analysis, see section “4.3 Types of analysis” of the Technical Reference Guide “Persistence and graduation indicators of postsecondary students, 2011/2012 to 2016/2017”.
International Data
Data from other countries are from Education at a Glance 2019: OECD indicators (tables B.5.1, B.5.3 and B.5.4). Methodology and reference years may differ from Canada but only data using the true cohort methods were included.
Completion of a program may vary between countries because the length of the program may differ from one country to another.
Limitations
Estimates may not be available for all reference periods for all geographies, due to data limitations. The estimates exclude all colleges in Ontario for the 2011/2012 to 2014/2015 cohorts, regional colleges in Saskatchewan for all years except for the 2011/2012 cohort, all colleges in New Brunswick and Manitoba for the 2011/2012 cohort, all institutions in the Territories for the 2011/2012 to 2012/2013 cohorts, some institutions in Manitoba and the Territories for all years and a small number of other institutions in various cohort years. Indicators are not available when sufficient years of longitudinal data are not available.
The data and methods are subject to revision. Percentages are calculated using rounded counts. Totals may not add up to the sum of all categories due to rounding. See the Technical Reference Guide “Persistence and graduation indicators of postsecondary students, 2011/2012 to 2016/2017” (https://www150.statcan.gc.ca/n1/pub/37-20-0001/372000012020003-eng.htm).
- Date modified:
