
High school graduation rates in Canada, 2016/2017 to 2019/2020
Skip to text
Text begins
High school graduation is an important milestone for students, providing them with a foundation for postsecondary education, as well as having broader social and economic benefits. In addition, graduation from high-school is widely considered the minimum requirement for successful entry into the labour market.
This fact sheet presents the most recent information about on-time and extended-time high school graduation rates in Canada (see text box below for definitions). While this measure will not reflect whether youth ultimately graduate from high school during their lifetime, it does provide policy-makers and researchers with information on how youth progress through their secondary level studies and if they complete them within the expected amount of time.
This publication covers 2019/2020 school year and is based on data collected before and during the initial months of the COVID-19 pandemic, providing the opportunity to observe how graduation rates may have been impacted at the outset of the pandemic. It also provides a reference point for comparison for understanding the impact of COVID-19 on future graduation rates.
Start of text boxOn-time high school graduation rate: the percentage of a cohort of young people who complete their high school studies within three years of starting grade 10 (“Secondary 3” in Quebec).
Extended-time high school graduation rate: the percentage of a cohort of young people who complete their high school studies within five years of starting grade 10 (“Secondary 3” in Quebec).
On-time graduation rates went up in the wake of the pandemic, while extended-time graduation rates remained stable
Elementary and secondary schools in Canada were impacted by the closures implemented as part of the public health measures put in place at the start of the COVID-19 pandemic in mid-March 2020. The 2019/2020 cohort of high school graduates were the first students affected by these closures.
Overall, the on-time graduation rates for almost all provinces and territories increased during the early stage of the COVID-19 pandemic. For Canada, it increased from 81 percent in 2018/2019 to 84 percent in 2019/2020. This was also the case in most provinces and territories, with the largest increase in Nova Scotia (6 percentage points higher), followed by Newfoundland and Labrador and Saskatchewan (5 percentage points higher). Conversely, in Manitoba, the on-time graduation rate remained stable between the two years at 82%, while it decreased in the Northwest Territories (3 percentage points lower).
The increased on-time graduation rate may be associated with provincial and territorial education policies implemented during the pandemic to ensure students would not fail or drop out of school given the pressures of school closures.Note

Data table for Chart 1
| 2016/2017 | 2017/2018 | 2018/2019 | 2019/2020 | |
|---|---|---|---|---|
| percent | ||||
| Canada | 80 | 81 | 81 | 84 |
| N.L | 88 | 88 | 89 | 94 |
| P.E.I. | 85 | 87 | 89 | 92 |
| N.S | Note ..: not available for a specific reference period | 87 | 86 | 92 |
| N.B. | 85 | 86 | 85 | 87 |
| Que. | 74 | 75 | 75 | 79 |
| Ont. | 82 | 82 | 83 | 86 |
| Man. | 82 | 83 | 82 | 82 |
| Sask. | 78 | 79 | 80 | 85 |
| Alta. | 78 | 80 | 80 | 84 |
| B.C. | 81 | 81 | 81 | 84 |
| N.W.T. | 54 | 51 | 49 | 46 |
| Nvt. | 47 | Note ..: not available for a specific reference period | Note ..: not available for a specific reference period | Note ..: not available for a specific reference period |
|
.. not available for a specific reference period Note: Data are not available for 2016/2017 in Nova Scotia, nor are they available from 2017/2018 onwards in Nunavut. Source: Pan-Canadian Education Indicators Program, Table 37-10-0221 True cohort high school graduation rate. |
||||
While on-time graduation rates saw a noticeable increase in 2019/2020, extended-time graduation rates remained stable and appear relatively unaffected during the early stages of the pandemic compared to on-time graduation rates. This is because extended-time graduation rates represent the percentage of young people who started Grade 10 (“Secondary 3” in Quebec) in 2015/2016 and graduated either on-time in 2017/2018 or between 2017/2018 and 2019/2020. Only the graduates between 2017/2018 and 2019/2020 would have been affected by the pandemic. This number of graduates is usually very small; hence the impacts of the pandemic would not have a large effect on the extended-time graduation rates.
In 2019/2020, three provinces (Newfoundland and Labrador, Nova Scotia, and Prince Edward Island) had higher on-time than extended-time graduation ratesNote . As mentioned, the impact of the school closures and the subsequent increase in on-time graduation rates in most jurisdictions was greater than the impact on extended-time graduation rates.
The impact of two additional years to complete high school
On average across Canada, an additional two years to complete high school has a significant impact on graduation rates. For the cohort that started grade 10 (Secondary 3) in 2015/2016, the proportion who graduated within three years, or ‘on-time’ was 81%. The proportion of this cohort who graduated within five years (the extended high school graduation rate) was 8 percentage points higher at 89%.

Data table for Chart 2
| On-time | Extended | |
|---|---|---|
| percent | ||
| Canada | 81 | 89 |
| N.L | 88 | 92 |
| P.E.I. | 87 | 91 |
| N.S | 87 | 91 |
| N.B. | 86 | 89 |
| Que. | 75 | 83 |
| Ont. | 82 | 92 |
| Man. | 83 | 87 |
| Sask. | 79 | 88 |
| Alta. | 80 | 87 |
| B.C. | 81 | 89 |
|
Note: Data are not available for the territories. Source: Pan-Canadian Education Indicators Program, Table 37-10-0221 True cohort high school graduation rate. |
||
Across the country, the effect of these two additional years to complete school varies. In the two largest provinces, the effect was an increase of 10 percentage points (Ontario) and 8 percentage points (Quebec). Fairly large increases can also be observed in Saskatchewan (9 percentage points), British Columbia (8 percentage points) and Alberta (7 percentage points). Conversely, effects were less pronounced in the Atlantic provinces and Manitoba.
Young women have a higher high school graduation rate than their male peers
In Canada, a higher proportion of young women (87%) completed high-school on-time than young men (81%) in 2019/2020. This trend was observed in all provinces and territories, and the difference between high school graduation rates for young women and men has been observed in all years of available data.
The largest difference in the on-time high-school graduation rate between young men and women was in Quebec with young women having a rate 10 percentage points higher than young men, followed by Ontario where the rate for young women was 6 percentage points higher. Differences between young women and men were much smaller in Newfoundland and Labrador and Nova Scotia, where rates were 1 and 2 percentage points higher for young women respectively.
Similar to on-time high-school graduation rates, a larger proportion of female students (91%) graduated after a two-year extended period than male students (86%) in 2019/2020. The same trend was observed in all provinces and territories.
The gender differences were most visible in Quebec where the female extended-time high-school graduation rate was approximately 7 percentage points above this rate for male students. The smallest gender gap was in Nova Scotia with a 2-percentage point difference.
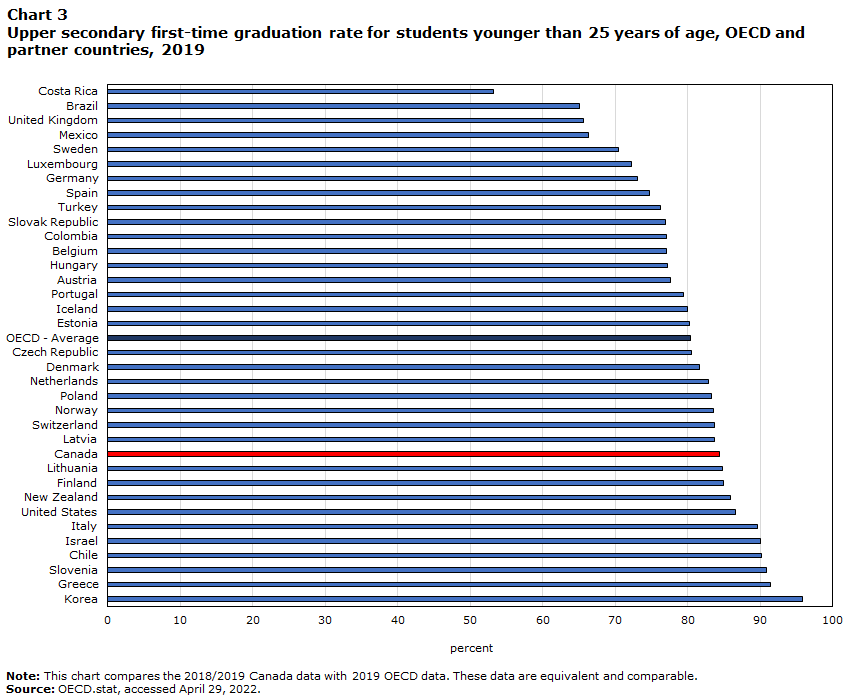
Canada higher than the OECD average for high school graduation rate
In 2019, the upper secondary first-time graduation rate for students younger than 25 years of age for Canada was 84%, 4 percentage points higher than the Organisation for Economic Cooperation and Development (OECD) average (80%)Note . Canada’s high school graduation rate was higher than some OECD countries such as Iceland (80%) and Belgium (77%), while lower than other countries, such as the United States (87%) and Italy (90%). These graduation rates do not include pandemic era data, as international data for 2020 is currently not available for comparison.
Data table for Chart 3
| Upper secondary first-time graduation rate | |
|---|---|
| percent | |
| Korea | 95.814 |
| Greece | 91.409 |
| Slovenia | 90.889 |
| Chile | 90.132 |
| Israel | 89.991 |
| Italy | 89.629 |
| United States | 86.606 |
| New Zealand | 85.911 |
| Finland | 84.907 |
| Lithuania | 84.818 |
| Canada | 84.317 |
| Latvia | 83.690 |
| Switzerland | 83.669 |
| Norway | 83.578 |
| Poland | 83.227 |
| Netherlands | 82.851 |
| Denmark | 81.629 |
| Czech Republic | 80.510 |
| OECD - Average | 80.322 |
| Estonia | 80.195 |
| Iceland | 80.011 |
| Portugal | 79.362 |
| Austria | 77.636 |
| Hungary | 77.257 |
| Belgium | 77.047 |
| Colombia | 77.038 |
| Slovak Republic | 76.938 |
| Turkey | 76.235 |
| Spain | 74.744 |
| Germany | 73.092 |
| Luxembourg | 72.229 |
| Sweden | 70.380 |
| Mexico | 66.332 |
| United Kingdom | 65.608 |
| Brazil | 65.083 |
| Costa Rica | 53.251 |
|
Note: This chart compares the 2018/2019 Canada data with 2019 OECD data. These data are equivalent and comparable. Source: OECD.stat, accessed April 29, 2022. |
|
The future of pandemic-era high-school graduation rates and beyond
Since 2016/2017, Canada’s on-time and extended-time high-school graduation rates have increased by 4 and 2 percentage points, respectively. This trend was observed for the majority of provinces and territories, indicating an overall consistent upward trend in high-school graduation rates across Canada. In 2019/2020, on-time high-school graduation rates saw a larger than usual increase in almost all provinces and territories. While no direct conclusions can be drawn from these results, this irregular increase should be explored further in the context of impacts of the COVID-19 pandemic on education.
The COVID-19 pandemic started in March 2020, and thus only the last four months of the 2019/2020 school year were impacted. As a result, 2020/2021 will be the first full school year of pandemic data, and will allow for a more in-depth look at the full effects of the COVID-19 pandemic on Canadian high-school graduation rates.
Definitions, sources and methodology
This indicator presents the high-school graduation rate, using a true-cohort methodology for students in public and private schools.
Since 2018, a true-cohort methodology has been used to calculate on-time and extended-time high-school graduation rates. This pan-Canadian methodology, which uses as its data source administrative data from the provinces and territories, has been developed with provincial and territorial education ministries to respond to their needs while also improving Canada’s international reporting to the OECD. The 2018/2019 and 2019/2020 data align with the OECD true-cohort reporting cycle which allows for international comparisons for on-time and extended-time graduation rates.
The true-cohort methodology follows a cohort of students from Grade 10, or “Secondary 3” in Quebec, to the end of their third year of high school, and then over a period of two additional years. Many students will graduate from Grade 12 (Secondary 5 in Quebec) after three years, but some students may take longer to complete their high school studies. Grade 10 / Secondary 3 is used as the starting point because this is the grade where students begin accumulating credits toward Grade 12 graduation in most provinces and territories.
An adjustment is made to the graduation rate (using an attrition methodology) to account for students who can no longer be tracked toward graduation for the following reasons: moving out of the province or territory, moving to a band-operated school or an excluded private school, or becoming home-schooled. These students have not dropped out of school, but would no longer be tracked through to graduation.
The 2018/2019 data features methodology changes for both the calculation of attrition rates and extended-time high-school graduation rates. Due to these changes, graduation rates for 2018/2019 data may vary considerably from previously published data. Extended-time high-school graduation rates have seen a slight decrease due to these changes in methodology. Graduation rates for 2016/2017 and 2017/2018 have been recalculated with the new methodology changes, to allow for consistency and comparability across multiple data collection years and are used in the above analysis. The 2019/2020 data features the same methodology as the 2018/2019 data, and is the first available year with data from the COVID-19 pandemic. Due to the pandemic, the 2019/2020 graduation rates may vary considerably from previous years.
Comparisons of high school graduation rates between provinces and territories require a nuanced interpretation as academic pathways, pass marks, subject requirements and the groups of students under consideration may differ from one province or territory to another.
- Date modified: