
Education, learning and training: Research Paper Series
Persistence and graduation indicators of postsecondary students by parental income, 2012/2013 entry cohort
Skip to text
Text begins
Abstract
This fact sheet explores the association between parental income and the pathways of young adults in postsecondary education for students who began their studies in the 2012/2013 academic year. Students from low-income families have previously been shown to have lower rates of educational accessNote 1 and attainment.Note 2Note 3Note 4 This fact sheet focuses on persistence and graduation indicators, which are now released annually, and furthers the analysis of these indicators by adding a parental income quartile dimension.Note 5 Overall, the findings provide the following insights:
- Students in the highest parental income quartile remained enrolled (persisted) and graduated at higher rates than students from the lowest parental income quartile for all selected educational qualifications and groupings. The differences in indicators by the level of parental income were more notable for the graduation rates than for the persistence rates.
- For students who graduated, those in the highest parental income quartile graduated as fast or faster than students in the lowest parental income quartile for all selected educational qualifications and groupings, though these differences were generally small.
These findings are consistent with similar studies regarding postsecondary experiences of students by socioeconomic status.
Introduction
Postsecondary educational attainment is associated with many benefits. These include increased employment rates,Note 6 higher annual employment earnings,Note 2Note 7Note 8 more substantial life savingsNote 9 and various health and social benefits.Note 10 Therefore, it is important to understand factors that contribute to the successful completion of postsecondary programs. This fact sheet uses postsecondary administrative data and income tax information to determine the association between postsecondary student pathways and the level of parental after-tax income. Although Statistics Canada produces annual education indicators on the pathways that students take during their postsecondary studies, this is the first time that parental income quartile groups have been used to produce such indicators, addressing an important knowledge gap.
Methodology
Study population
The study population for this fact sheet consists of all new students who began postsecondary studies in the 2012/2013 academic year in one of the following five educational qualifications:Note 11 college-level certificates, college-level diplomas, undergraduate degrees, master’s degrees, and doctoral degrees.Note 12 Students were considered “new” if they had not been previously enrolled in the same educational qualification within the last two academic years. Students above the age of 36 at the end of 2012 (under the age of 16 years at the end of 1992, the first year of available tax information) are excluded from the analysis. Only Canadian citizens and permanent residents, at the time of enrolment, are included in this analysis. As a result of limited data availability, the Ontario college data could not be used and was excluded from the analysis. The complete methodology for the indicators is outlined in the Persistence and graduation indicators of postsecondary students, technical reference guide.
Parental income
This fact sheet organizes persistence and graduation indicators by parental income quartiles.Note 13 The following steps were taken to compute the parental income quartile for each student in the study population:
- Using the T1 Family File (T1FF) from the Education and Labour Market Longitudinal Platform (ELMLP), the after-tax incomeNote 14 of the student’s parents was selected for each year between the student’s ages of 16 and 25.Note 15 For example, if the student was 16 years old in 2005, the after-tax income of their parents would be selected for the years 2005 to 2014.
- The average of the student’s after-tax parental incomeNote 16 between the ages of 16 to 25 was then computed. This value is referred to as the “average after-tax parental income”.
Parental income quartiles were computed at the total study population level (all ages, all genders).Note 17
As shown in Table 1, between 78.4% (doctoral degree) and 85.9% (undergraduate degree) of new students had available parental income information.
| Educational Qualification | All students | Parental income available | No available parental income | Proportion with parental income available |
|---|---|---|---|---|
| count | percent | |||
| College-level certificate | 19,160 | 15,530 | 3,630 | 81.1 |
| College-level diploma | 56,420 | 47,140 | 9,280 | 83.6 |
| Undergraduate degree | 174,800 | 150,200 | 24,600 | 85.9 |
| Master's degree | 24,610 | 20,400 | 4,200 | 82.9 |
| Doctoral degree | 4,250 | 3,330 | 920 | 78.4 |
| Source: Statistics Canada. Postsecondary Student Information System (PSIS), 2012/2013 to 2018/2019 and T1 Family File (T1FF), 1992 to 2019 (subset compiled from integrated microdata files, extracted February 2021). | ||||
There are several reasons why a student may not have had available after-tax parental income information in a specific taxation year. Most notably, the after-tax parental income information can only be determined for students identified as childrenNote 18 on the T1FF of the ELMLP for the specified taxation year in which they filed their taxes. In any given taxation year, a student will be identified as a child if either a) their parents received federal child benefitsNote 19 in that taxation year or b) the student filed their taxes at their parents’ address during that taxation year. In addition, to have sufficient information to be integrated into the analysis, a student must have filed their taxes during the specific taxation year. It was determined that postsecondary students are most likely to file their taxes from the same address as their parents (and therefore be identified as a child) between the ages of 16 and their mid-twenties. This is when they are most likely to have sufficient income to file their taxes, without moving away from home.
Any student who does not have available after-tax parental income information for at least one year out of the ten years that they are between the ages of 16 and 25 receives a value of “no available parental income” for their parental income quartile.Note 20 “At least 1 year” was selected to limit the number of students in the study population who would receive a value of “no available parental income” for their parental income quartile. However, the general conclusions were consistent if “at least 3 years” was instead used as the exclusion criterion.
Data source
Statistics Canada, in collaboration with the provincial and territorial ministries of education, Employment and Social Development Canada (ESDC), and other stakeholders, has developed the Education and Labour Market Longitudinal Platform (ELMLP). The ELMLP allows longitudinal integration of administrative data related to education with other data sources to create anonymized, customized datasets for analytical purposes. The ELMLP includes anonymized information from the Postsecondary Student Information System (PSIS), the Registered Apprenticeship Information System (RAIS) and tax data from the T1 Family File (T1FF) that can be integrated to study the pathways of students and apprentices, their transitions to the labour market and outcomes over time.
PSIS provides detailed annual information on enrolments and graduations from Canadian public postsecondary institutions (universities and colleges) by the field of study and certain demographic variables. PSIS data do not provide information on students’ income or their parents. However, some information is available in administrative data sets such as tax data files.
The current study uses PSIS and tax data to determine the association between parental income and persistence and graduation for young adults in the 2012/2013 entry cohort of selected educational qualifications. The 2012/2013 entry cohort was selected because it allows for a sufficient number of observational years required to produce the graduation indicators.
Persistence rates
The persistence rate is defined as the percentage of the new student cohort that was still enrolledNote 21 (full-time or part-time) in the educational qualification in which they initially enrolled, in subsequent years after first entry. Chart 1 shows the persistence rate one year after entry for undergraduate and doctoral degree students (all ages and all genders), the two educational qualifications with a long enough duration to measure persistence. The persistence rates in Chart 1 are grouped by educational qualification and parental income quartile.

Data table for Chart 1
| Educational Qualification | Lowest quartile | Second quartile | Third quartile | Highest quartile | No available parental income |
|---|---|---|---|---|---|
| percent | |||||
| Undergraduate degree | 86.3 | 86.7 | 88.7 | 91.0 | 83.0 |
| Doctoral degree | 92.8 | 91.7 | 94.0 | 95.2 | 91.3 |
| Source: Statistics Canada. Postsecondary Student Information System (PSIS), 2012/2013 to 2018/2019 and T1 Family File (T1FF), 1992 to 2019 (subset compiled from integrated microdata files, extracted February 2021). | |||||
The highest persistence rates were observed for students in the highest parental income quartile for both educational qualifications. Tables 2a to 2b show the persistence rates disaggregated by gender and age.
| Age and gender | All students | Lowest quartile | Second quartile | Third quartile | Highest quartile | No available parental income |
|---|---|---|---|---|---|---|
| percent | ||||||
| All ages, all genders | 87.4 | 86.3 | 86.7 | 88.7 | 91.0 | 83.0 |
| Men | 86.4 | 85.3 | 85.9 | 87.3 | 89.5 | 82.4 |
| Women | 88.2 | 86.9 | 87.3 | 89.7 | 92.2 | 83.5 |
| 15 to 24 years old | 88.0 | 86.8 | 87.1 | 89.0 | 91.2 | 84.1 |
| 25 to 36 years old | 81.2 | 80.8 | 82.7 | 83.5 | 84.8 | 77.6 |
| Source: Statistics Canada. Postsecondary Student Information System (PSIS), 2012/2013 to 2018/2019 and T1 Family File (T1FF), 1992 to 2019 (subset compiled from integrated microdata files, extracted February 2021). | ||||||
| Gender | All students | Lowest quartile | Second quartile | Third quartile | Highest quartile | No available parental income |
|---|---|---|---|---|---|---|
| percent | ||||||
| All genders | 92.9 | 92.8 | 91.7 | 94.0 | 95.2 | 91.3 |
| Men | 92.0 | 92.3 | 95.0 | 92.1 | 94.6 | 88.9 |
| Women | 93.8 | 93.2 | 93.0 | 95.6 | 93.6 | 91.7 |
| Source: Statistics Canada. Postsecondary Student Information System (PSIS), 2012/2013 to 2018/2019 and T1 Family File (T1FF), 1992 to 2019 (subset compiled from integrated microdata files, extracted February 2021). | ||||||
Tables 2a and 2bNote 22 show that students in the highest parental income quartile persisted at higher rates than students in the lowest parental income quartile, for both educational qualifications and for all groupings. For undergraduate degree students, the difference in persistence rate between the highest and lowest quartiles is largest among women (5.3 percentage points). The difference in persistence rates between students in the highest parental income quartile and students in the lowest parental income quartile is less notable for doctoral degree students.
Graduation rates
The graduation rate, measured at a given number of years after the fall of first enrolment, is defined as the percentage of an entry cohort that had completed their specified educational qualification within that time. The measurement years for the graduation rates differ by educational qualification and are specified in Tables 3a to 3e. These measurement years are consistent with previous Statistics Canada releases and are the typical program duration of the educational qualification. Chart 2 shows the graduation rate for students (all ages and all genders). The graduation rates in Chart 2 are grouped by educational qualification and parental income quartile.

Data table for Chart 2
| Educational Qualification | Lowest quartile | Second quartile | Third quartile | Highest quartile | No available parental income |
|---|---|---|---|---|---|
| percent | |||||
| College-level certificate | 59.0 | 62.9 | 64.4 | 64.0 | 60.6 |
| College-level diploma | 43.9 | 47.6 | 49.3 | 52.8 | 40.9 |
| Undergraduate degree | 40.2 | 44.7 | 47.7 | 49.5 | 40.2 |
| Master's degree | 56.1 | 55.9 | 58.0 | 61.6 | 54.3 |
| Doctoral degree | 32.5 | 38.1 | 33.7 | 42.2 | 30.4 |
|
Note: The measurement years are: one year after entry for college-level certificate; three years after entry for college-level diploma; four years after entry for undergraduate degree; two years after entry for master's degree; and five years after entry for doctoral degree students. Source: Statistics Canada. Postsecondary Student Information System (PSIS), 2012/2013 to 2018/2019 and T1 Family File (T1FF), 1992 to 2019 (subset compiled from integrated microdata files, extracted February 2021). |
|||||
For all educational qualifications, the graduation rate (as measured at the time of typical program duration) for the students in the highest parental income quartile is higher than the graduation rate for the students in the lowest parental income quartile. This difference is largest for students in a doctoral degree program, where the graduation rate for the students in the highest parental income quartile is 9.7 percentage points higher than for those in the lowest parental income quartile. A similar magnitude of the difference is observed for students in an undergraduate degree program (where the difference is 9.3 percentage points) and students in a college-level diploma program (where the difference is 8.9 percentage points). These differences in graduation rates between students in the highest and lowest parental income quartiles are larger than those exhibited for the persistence rates.
Tables 3a to 3e show the graduation rates disaggregated by gender and age.
| Age and gender | All students | Lowest quartile | Second quartile | Third quartile | Highest quartile | No available parental income |
|---|---|---|---|---|---|---|
| percent | ||||||
| All ages, all genders | 62.2 | 59.0 | 62.9 | 64.4 | 64.0 | 60.6 |
| Men | 62.3 | 58.5 | 63.2 | 64.2 | 64.1 | 59.3 |
| Women | 62.2 | 59.6 | 62.5 | 64.7 | 63.9 | 61.5 |
| 15 to 24 years old | 61.5 | 57.7 | 62.3 | 63.9 | 64.5 | 57.3 |
| 25 to 36 years old | 64.2 | 61.7 | 65.0 | 66.3 | 63.9 | 64.7 |
| Source: Statistics Canada. Postsecondary Student Information System (PSIS), 2012/2013 to 2018/2019 and T1 Family File (T1FF), 1992 to 2019 (subset compiled from integrated microdata files, extracted February 2021). | ||||||
| Age and gender | All students | Lowest quartile | Second quartile | Third quartile | Highest quartile | No available parental income |
|---|---|---|---|---|---|---|
| percent | ||||||
| All ages, all genders | 47.2 | 43.9 | 47.6 | 49.3 | 52.8 | 40.9 |
| Men | 44.9 | 40.8 | 45.2 | 46.3 | 50.0 | 39.4 |
| Women | 49.0 | 46.1 | 49.4 | 51.9 | 55.8 | 41.9 |
| 15 to 24 years old | 45.5 | 41.1 | 45.5 | 47.6 | 51.8 | 38.2 |
| 25 to 36 years old | 55.9 | 54.6 | 60.6 | 62.8 | 61.5 | 48.3 |
| Source: Statistics Canada. Postsecondary Student Information System (PSIS), 2012/2013 to 2018/2019 and T1 Family File (T1FF), 1992 to 2019 (subset compiled from integrated microdata files, extracted February 2021). | ||||||
| Age and gender | All students | Lowest quartile | Second quartile | Third quartile | Highest quartile | No available parental income |
|---|---|---|---|---|---|---|
| percent | ||||||
| All ages, all genders | 44.8 | 40.2 | 44.7 | 47.7 | 49.5 | 40.2 |
| Men | 37.3 | 33.0 | 37.1 | 39.2 | 41.8 | 33.5 |
| Women | 50.4 | 45.6 | 50.0 | 54.1 | 56.0 | 44.8 |
| 15 to 24 years old | 43.5 | 38.6 | 43.2 | 46.6 | 48.6 | 38.0 |
| 25 to 36 years old | 59.6 | 56.9 | 61.7 | 67.0 | 72.4 | 51.9 |
| Source: Statistics Canada. Postsecondary Student Information System (PSIS), 2012/2013 to 2018/2019 and T1 Family File (T1FF), 1992 to 2019 (subset compiled from integrated microdata files, extracted February 2021). | ||||||
| Age and gender | All students | Lowest quartile | Second quartile | Third quartile | Highest quartile | No available parental income |
|---|---|---|---|---|---|---|
| percent | ||||||
| All ages, all genders | 57.3 | 56.1 | 55.9 | 58.0 | 61.6 | 54.3 |
| Men | 53.2 | 52.4 | 52.2 | 52.0 | 56.3 | 53.6 |
| Women | 60.0 | 58.6 | 58.4 | 62.1 | 65.2 | 54.8 |
| 15 to 24 years old | 58.5 | 57.6 | 56.5 | 59.3 | 60.9 | 57.0 |
| 25 to 36 years old | 55.8 | 54.1 | 55.5 | 56.2 | 62.3 | 52.9 |
| Source: Statistics Canada. Postsecondary Student Information System (PSIS), 2012/2013 to 2018/2019 and T1 Family File (T1FF), 1992 to 2019 (subset compiled from integrated microdata files, extracted February 2021). | ||||||
| Gender | All students | Lowest quartile | Second quartile | Third quartile | Highest quartile | No available parental income |
|---|---|---|---|---|---|---|
| percent | ||||||
| All ages, all genders | 35.1 | 32.5 | 38.1 | 33.7 | 42.2 | 30.4 |
| Men | 36.7 | 33.3 | 40.0 | 36.8 | 45.9 | 28.9 |
| Women | 33.6 | 31.8 | 34.9 | 33.3 | 36.2 | 31.3 |
| Source: Statistics Canada. Postsecondary Student Information System (PSIS), 2012/2013 to 2018/2019 and T1 Family File (T1FF), 1992 to 2019 (subset compiled from integrated microdata files, extracted February 2021). | ||||||
Tables 3a to 3e show that the graduation rate for students in the highest parental income quartile is higher than the graduation rate for their counterparts in the lowest parental income quartile, for all educational qualifications and all groupings. The differences in graduation rate between the highest and lowest quartiles are largest among the older age group for undergraduate degrees (15.5 percentage points), men in a doctoral degree program (12.6 percentage points), the younger age group for the college-level diplomas (10.7 percentage points), and women in an undergraduate degree program (10.4 percentage points).
Average times to graduation
The average time to graduationNote 23 is defined as the average number of elapsed academic years new students took to complete the credential in a given educational qualification. Only students who graduated within the observation period are included in the calculation of average time to graduation. Chart 3 shows the average time to graduation for students (all ages and all genders). The average times to graduation in Chart 3 are grouped by educational qualification and parental income quartile.
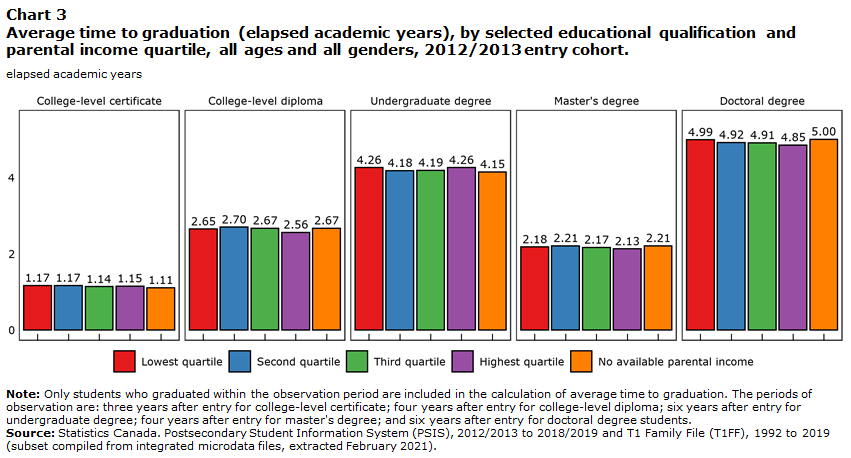
Data table for Chart 3
| Educational Qualification | Lowest quartile | Second quartile | Third quartile | Highest quartile | No available parental income |
|---|---|---|---|---|---|
| elapsed academic years | |||||
| College-level certificate | 1.17 | 1.17 | 1.14 | 1.15 | 1.11 |
| College-level diploma | 2.65 | 2.70 | 2.67 | 2.56 | 2.67 |
| Undergraduate degree | 4.26 | 4.18 | 4.19 | 4.26 | 4.15 |
| Master's degree | 2.18 | 2.21 | 2.17 | 2.13 | 2.21 |
| Doctoral degree | 4.99 | 4.92 | 4.91 | 4.85 | 5.00 |
|
Note: Only students who graduated within the observation period are included in the calculation of average time to graduation. The periods of observation are: three years after entry for college-level certificate; four years after entry for college-level diploma; six years after entry for undergraduate degree; four years after entry for master's degree; and six years after entry for doctoral degree students. Source: Statistics Canada. Postsecondary Student Information System (PSIS), 2012/2013 to 2018/2019 and T1 Family File (T1FF), 1992 to 2019 (subset compiled from integrated microdata files, extracted February 2021). |
|||||
Chart 3 shows that students in the highest parental income quartile graduated as fast or faster than their counterparts in the lowest parental income quartile, for all educational qualifications. The differences in average times to graduation between the highest and lowest parental income quartile groups are less notable than they are for the persistence and graduation rates. The largest differences in average times to graduation between the highest and lowest parental income quartile are observed for the doctoral degree (0.14 years faster, on average) and college-level diploma (0.09 years faster, on average) educational qualifications.
Tables 4a to 4e show the average times to graduation disaggregated by gender and age.
| Age and gender | All students | Lowest quartile | Second quartile | Third quartile | Highest quartile | No available parental income |
|---|---|---|---|---|---|---|
| elapsed academic years | ||||||
| All ages, all genders | 1.15 | 1.17 | 1.17 | 1.14 | 1.15 | 1.11 |
| Men | 1.15 | 1.17 | 1.17 | 1.14 | 1.16 | 1.10 |
| Women | 1.15 | 1.16 | 1.16 | 1.15 | 1.14 | 1.12 |
| 15 to 24 years old | 1.16 | 1.17 | 1.17 | 1.16 | 1.15 | 1.12 |
| 25 to 36 years old | 1.13 | 1.16 | 1.15 | 1.10 | 1.14 | 1.11 |
| Source: Statistics Canada. Postsecondary Student Information System (PSIS), 2012/2013 to 2018/2019 and T1 Family File (T1FF), 1992 to 2019 (subset compiled from integrated microdata files, extracted February 2021). | ||||||
| Age and gender | All students | Lowest quartile | Second quartile | Third quartile | Highest quartile | No available parental income |
|---|---|---|---|---|---|---|
| elapsed academic years | ||||||
| All ages, all genders | 2.65 | 2.65 | 2.70 | 2.67 | 2.56 | 2.67 |
| Men | 2.60 | 2.57 | 2.65 | 2.63 | 2.55 | 2.62 |
| Women | 2.68 | 2.70 | 2.73 | 2.71 | 2.57 | 2.70 |
| 15 to 24 years old | 2.71 | 2.73 | 2.76 | 2.73 | 2.60 | 2.77 |
| 25 to 36 years old | 2.36 | 2.39 | 2.37 | 2.31 | 2.21 | 2.45 |
| Source: Statistics Canada. Postsecondary Student Information System (PSIS), 2012/2013 to 2018/2019 and T1 Family File (T1FF), 1992 to 2019 (subset compiled from integrated microdata files, extracted February 2021). | ||||||
| Age and gender | All students | Lowest quartile | Second quartile | Third quartile | Highest quartile | No available parental income |
|---|---|---|---|---|---|---|
| elapsed academic years | ||||||
| All ages, all genders | 4.21 | 4.26 | 4.18 | 4.19 | 4.26 | 4.15 |
| Men | 4.34 | 4.38 | 4.32 | 4.32 | 4.37 | 4.28 |
| Women | 4.13 | 4.18 | 4.10 | 4.10 | 4.18 | 4.06 |
| 15 to 24 years old | 4.31 | 4.37 | 4.28 | 4.26 | 4.32 | 4.32 |
| 25 to 36 years old | 3.05 | 3.12 | 3.01 | 2.89 | 2.85 | 3.20 |
| Source: Statistics Canada. Postsecondary Student Information System (PSIS), 2012/2013 to 2018/2019 and T1 Family File (T1FF), 1992 to 2019 (subset compiled from integrated microdata files, extracted February 2021). | ||||||
| Age and gender | All students | Lowest quartile | Second quartile | Third quartile | Highest quartile | No available parental income |
|---|---|---|---|---|---|---|
| elapsed academic years | ||||||
| All ages, all genders | 2.18 | 2.18 | 2.21 | 2.17 | 2.13 | 2.21 |
| Men | 2.20 | 2.20 | 2.24 | 2.21 | 2.16 | 2.19 |
| Women | 2.16 | 2.16 | 2.19 | 2.15 | 2.11 | 2.22 |
| 15 to 24 years old | 2.17 | 2.16 | 2.23 | 2.16 | 2.14 | 2.20 |
| 25 to 36 years old | 2.19 | 2.20 | 2.19 | 2.19 | 2.12 | 2.21 |
| Source: Statistics Canada. Postsecondary Student Information System (PSIS), 2012/2013 to 2018/2019 and T1 Family File (T1FF), 1992 to 2019 (subset compiled from integrated microdata files, extracted February 2021). | ||||||
| Gender | All students | Lowest quartile | Second quartile | Third quartile | Highest quartile | No available parental income |
|---|---|---|---|---|---|---|
| elapsed academic years | ||||||
| All genders | 4.93 | 4.99 | 4.92 | 4.91 | 4.85 | 5.00 |
| Men | 4.88 | 4.97 | 4.87 | 4.89 | 4.70 | 5.00 |
| Women | 4.98 | 5.01 | 4.97 | 4.93 | 4.98 | 4.99 |
| Source: Statistics Canada. Postsecondary Student Information System (PSIS), 2012/2013 to 2018/2019 and T1 Family File (T1FF), 1992 to 2019 (subset compiled from integrated microdata files, extracted February 2021). | ||||||
Tables 4a to 4e show that students in the highest parental income quartile graduated as fast or faster, on average, than their counterparts in the lowest parental income quartile, for all educational qualifications and groupings. This was most notable for men in a doctoral degree program, where students in the highest parental income quartile graduated, on average, 0.27 academic years more quickly than those in the lowest parental income quartile.
Conclusion
The study population’s persistence and graduation indicators differed, in general, based on the student’s parental income. Students in the highest parental income quartile group exhibited higher persistence and graduation rates (for all selected educational qualifications) than students in the lowest parental income quartile group. This finding held when disaggregating by gender and age group. For students who graduated, those in the highest parental income quartile graduated as fast, or faster, than their counterparts in the lowest parental income quartile, for all selected educational qualifications. This, too, held when disaggregating by gender and age group.
The differences in indicators between students in the highest and lowest parental income quartiles were most notable for the graduation rates, followed by the persistence rates. The differences in average times to graduation across parental income quartiles were generally small.
Eric Fecteau and Melissa Van Bussel are analysts with the Canadian Centre for Education Statistics at Statistics Canada.
- Date modified: