
Education, learning and training: Research Paper Series
The Impact of Short-duration Credentials After an Undergraduate Degree on Labour Market Outcomes
by Aimé Ntwari and Eric Fecteau
Skip to text
Text begins
Overview of the study
- Of the 102,865 graduates who earned an undergraduate degree from a public postsecondary institution in Canada before the age of 25 in 2010, 34,715 (33.7%) completed one or more additional educational qualification between 2010 and 2016, either a degree, a diploma, a certificate or a combination of various qualifications. Of these individuals, 5,370 (15.5%) completed only one additional postsecondary certificate or diploma, called a short-duration credential in this study: two-thirds (3,555) at the college level and one-third (1,815) at the university level. These 5,370 individuals are the focus of this study which measures the impact of a short-duration credential completed after a bachelor degree.
- BHASE (non-STEM) graduates were more likely to complete a short-duration credential after their undergraduate degree than STEM graduates. More than four fifths (82.7%) of graduates who obtained a short-duration credential had obtained their 2010 undergraduate degree in a BHASE field of study. This represented a 5.4 percentage points higher proportion compared to the proportion of BHASE graduates among the group without any additional short-duration credential.
- While one third (33.3%) of graduates with an additional short-duration credential earned their second qualification in the same field of study as their undergraduate degree, large outflows were observed in the fields of “Social and behavioural sciences” and “Arts and humanities” towards fields related to “Business and administration” (35.0% and 27.0%, respectively).
- Comparing two years before and two years after earning an additional short-duration credential, the proportion of graduates employed in “low value-added service industries” fell from 22.1% to 9.9%. Similarly, unionization rate was 42.4% two years after completion (+4.6 percentage points compared to two years before) and rate of participation in a pension plan was 46.5% (+16.3 percentage points compared to two years before).
- Although a large proportion of graduates who completed a short-duration credential started with a lower employment income and returned to school full-time, their median employment income two years before and two years after completing a short-duration credential rose faster, almost to the level of those who did not go back to school, in almost all fields of study.
- In 2017, graduates who had earned an undergraduate degree in 2010 but did not seek an additional short-duration credential earned more than those who had completed an additional short-duration credential between 2011 and 2016. However, this gap was mostly due to the starting level of employment income of both groups, and narrows if controlled for the other factors.
1. Introduction
Both in Canada and around the world, the labour market is constantly changing and requires the maintenance of skills and acquisition of knowledge focused on what is needed with the transformation of industries. These changes affect the behaviour of workers, not only in Canada, but in all developed and emerging countries. School-to-work transitions have become the subject of interest for employers, employees, students and decision-makers. To meet these labour market requirements, many Canadians supplement their post-secondary education with the addition of short-duration credentials, often seen as a specialization tool.
The contribution of short-duration credentials (certificates or diplomas), completed after undergraduate studies, to labour market outcomes is a subject of interest due to their increased popularity and also in terms of aligning skills with labour market needs. However, very few studies have analyzed the impact of short-duration credentials on the career advancement of bachelor’s degree holders.
Using the Education and Labour Market Longitudinal Platform (ELMLP),Note which creates an environment where administrative data from the Postsecondary Student Information System (PSIS) can be linked to other databases, this article examines the path followed by students under 25 years of age,Note who obtained a first undergraduate degree at a public post-secondary institution in Canada in 2010, followed by a post-secondary short-duration credential (either a baccalaureate, a post-baccalaureate or a college certificate or diploma)Note in the following six years. They are referred to as “short” as the typical length of these types of credentials is between one and two years.
The first section of this article analyzes the profile of graduates aged 25 and under with an undergraduate degree who completed an additional short-duration credential compared with those who did not complete any additional educational qualifications. Next, the article explores changes in location and field of study between the undergraduate degree and the short-duration credential. In the third section, the article provides an overview of the evolution of select employment quality indicators, including employment income. Finally, the last section presents factors that explain the largest variability in the employment income between the two groups.
2. Profile of undergraduate degree holders from public postsecondary institutions in Canada
“Stackable credentials” is a term that is commonly used to describe the accumulation of educational qualifications. This concept invokes the image of assembly and alludes to LEGO blocks. Like building with LEGO, this stacking can be vertical, with students completing higher and higher levels of education (traditional paths); horizontal, with students accumulating credentials without any hierarchy, instead aiming to acquire different skills (non-traditional paths); or a combination of bothNote .
Of the 102,865Note graduates who earned an undergraduate degree before the age of 25 in 2010 from a public postsecondary institution, 34,715 (33.7%) completed at least one additional educational qualification between 2010 and 2016, either a degree, a diploma, a certificate or a combination of various qualifications at the undergraduate, graduate or college level. The remaining 68,150 students did not earn any additional educational qualification.Note Of those who completed an additional educational qualification, 15.5% (5,370) completed only one additional short-duration credential, either a college-level or university-level certificate or diploma, within the six subsequent years. The graduates who completed an additional short-duration credential are referred to as the “Bac+” group and those who did not earn any additional educational qualification are referred to as the “Bac” group. The focus on the “Bac+” group aims to measure the value added by a short-duration credential earned after an undergraduate degree on labour market outcomes.
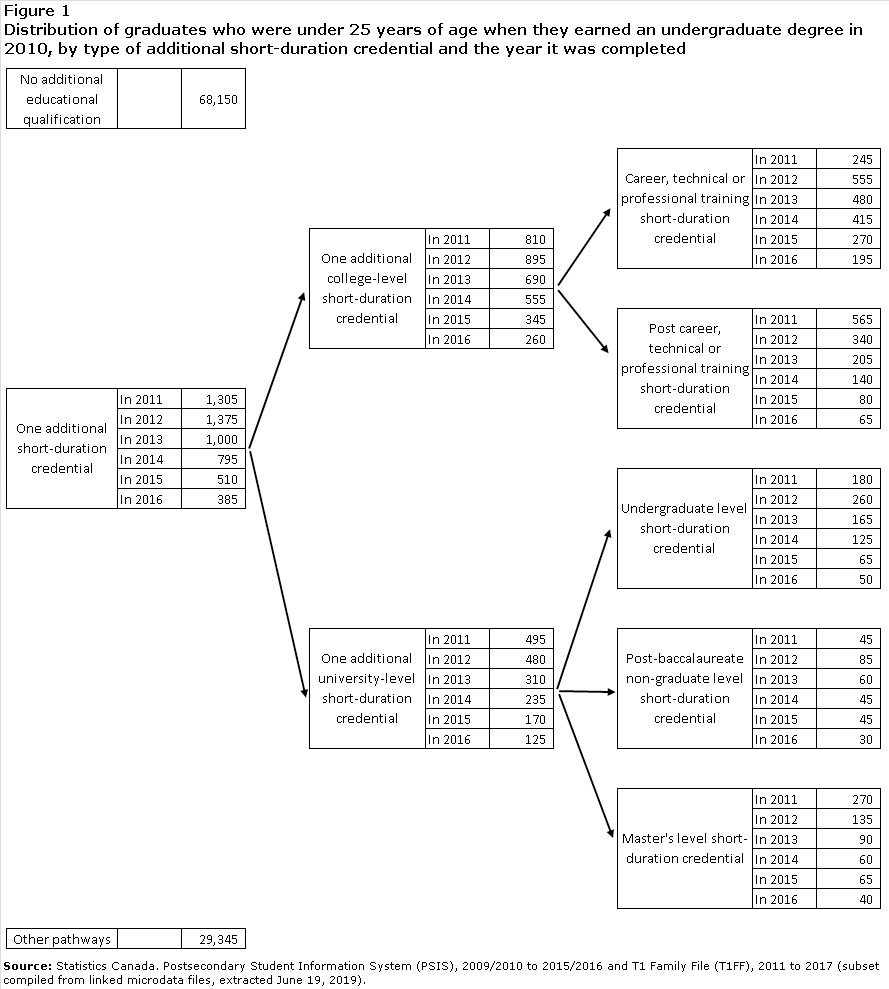
Of the 5,370 graduates in the “Bac+” group, two-thirds (3,555) completed a short-duration credential at the college level and one-third (1,815) at the university level (Figure 1). Graduates in undergraduate degree programs were more likely to complete an additional short-duration credential in the first few years following completion of their undergraduate program in 2010. Of those in the “Bac+” group, 24.3% earned their second short-duration credential in 2011, 25.6% in 2012, 18.6% in 2013, 14.8% in 2014, 9.5% in 2015 and 7.2% in 2016.
Description for Figure 1
This figure is a hierarchy diagram (also known as a tree diagram) displaying various level of details about the type of short-duration credential for the 2010 undergraduate degree graduates.
| Parent Hierarchy | Type of short-duration credential | Graduation year for short-duration credential | Number of graduates |
|---|---|---|---|
| Top level | No additional educational qualification | Note ...: not applicable | 68,150 |
| One additional short-duration credential | 2011 | 1,305 | |
| 2012 | 1,375 | ||
| 2013 | 1,000 | ||
| 2014 | 795 | ||
| 2015 | 510 | ||
| 2016 | 385 | ||
| Other pathways | Note ...: not applicable | 29,345 | |
| One additional short-duration credential | One additional college-level short-duration credential | 2011 | 810 |
| 2012 | 895 | ||
| 2013 | 690 | ||
| 2014 | 555 | ||
| 2015 | 345 | ||
| 2016 | 260 | ||
| One additional university-level short-duration credential | 2011 | 495 | |
| 2012 | 480 | ||
| 2013 | 310 | ||
| 2014 | 235 | ||
| 2015 | 170 | ||
| 2016 | 125 | ||
| One additional college-level short-duration credential | Career, technical or professional training short-duration credential | 2011 | 245 |
| 2012 | 555 | ||
| 2013 | 480 | ||
| 2014 | 415 | ||
| 2015 | 270 | ||
| 2016 | 195 | ||
| Post career, technical or professional training short-duration credential | 2011 | 565 | |
| 2012 | 340 | ||
| 2013 | 205 | ||
| 2014 | 140 | ||
| 2015 | 80 | ||
| 2016 | 65 | ||
| One additional university-level short-duration credential | Undergraduate level short-duration credential | 2011 | 180 |
| 2012 | 260 | ||
| 2013 | 165 | ||
| 2014 | 125 | ||
| 2015 | 65 | ||
| 2016 | 50 | ||
| Post-baccalaureate non-graduate level short-duration credential | 2011 | 45 | |
| 2012 | 85 | ||
| 2013 | 60 | ||
| 2014 | 45 | ||
| 2015 | 45 | ||
| 2016 | 30 | ||
| Master's level short-duration credential | 2011 | 270 | |
| 2012 | 135 | ||
| 2013 | 90 | ||
| 2014 | 60 | ||
| 2015 | 65 | ||
| 2016 | 40 |
In general, women make up a larger share than men of undergraduate degree holders, and they made up an even larger share in the group of graduates with an additional short-duration credential. They represented 60.5% (41,240) of the “Bac” group, but 72.1% (3,870) of the “Bac+” group (Table 1), meaning that, compared with men, they had a greater tendency to pursue a short-duration credential, when not adjusting for other factors.
At the level of the province of study,Note the distribution of members of the “Bac+” group was more or less comparable to that of “Bac” group, with the exception of British Columbia (4.3 percentage points higher) and Alberta (2.8 percentage points lower).
Graduates in BHASE (non-STEM)Note fields of study had a higher propensity to pursue a short-duration credential after a first undergraduate degree since they formed a larger proportion of the group having acquired an additional short-duration credential, that is to say 82.7% of the “Bac+” group compared to a proportion of 77.3% of the “Bac” group. Within this group of BHASE graduates, graduates of “Social and behavioral sciences” displayed a particularly high propensity to acquire an additional short-duration credential since they represented 34.2% of the “Bac+” group compared to 21.2% of the “Bac” group; to a lesser degree, graduates of “Arts and Humanities” also had a relatively strong propensity to pursue an additional short-duration credential, since they formed 18.5% of the “Bac+” group but 12.7% of the “Bac” group.
| "Bac" group | "Bac+" group | |||
|---|---|---|---|---|
| number | percent | number | percent | |
| Gender | ||||
| Men | 26,910 | 39.5 | 1,495 | 27.9 |
| Women | 41,240 | 60.5 | 3,870 | 72.1 |
| Province | ||||
| Newfoundland and Labrador | 810 | 1.2 | 45 | 0.8 |
| Prince Edward Island | 190 | 0.3 | 30 | 0.6 |
| Nova Scotia | 2,655 | 3.9 | 275 | 5.1 |
| New Brunswick | 1,610 | 2.4 | 115 | 2.1 |
| Quebec | 11,820 | 17.3 | 965 | 18.0 |
| Ontario | 34,825 | 51.1 | 2,650 | 49.4 |
| Manitoba | 1,730 | 2.5 | 105 | 2.0 |
| Saskatchewan | 1,530 | 2.2 | 80 | 1.5 |
| Alberta | 5,940 | 8.7 | 315 | 5.9 |
| British Columbia | 7,040 | 10.3 | 785 | 14.6 |
| Field of study | ||||
| Science and science technology | 7,610 | 11.2 | 790 | 14.7 |
| Engineering and engineering technology | 5,870 | 8.6 | 75 | 1.4 |
| Mathematics and computer and information science | 2,015 | 3.0 | 65 | 1.2 |
| Business and administration | 15,470 | 22.7 | 800 | 14.9 |
| Arts and humanities | 8,680 | 12.7 | 995 | 18.5 |
| Social and behavioural sciences | 14,450 | 21.2 | 1,835 | 34.2 |
| Legal professions and studies | 195 | 0.3 | 25 | 0.5 |
| Health care | 4,705 | 6.9 | 380 | 7.1 |
| Education and teaching | 6,160 | 9.0 | 215 | 4.0 |
| Trades, services, natural resources and conservation | 2,995 | 4.4 | 185 | 3.4 |
|
Note: All figures are randomly rounded to a multiple of 5. The province of study refers to the province of the institution at which the individual received their undergraduate degree in 2010. Source: Statistics Canada. Postsecondary Student Information System (PSIS), 2009/2010 to 2015/2016 and T1 Family File (T1FF), 2011 to 2017 (subset compiled from linked microdata files, extracted June 19, 2019). |
||||
“Engineering, computer and information science” graduates were under-represented among graduates who acquired an additional short-duration credential, representing 8.6% of the “Bac” group but only 1.4% of the “Bac+” group. According to 2016 census dataNote , graduates in this field of study (as well as those in the health field) were the most likely to work in jobs closely related to their field of study. Therefore, there may be a correlation between not having a job related to one’s field of study and pursuing an additional short-duration credential.
3. Comparison of the characteristics of the first and second educational qualifications
We have previously seen that graduates of certain fields of study are more likely to acquire an additional short-duration credential. To what extent, however, do they acquire this new credential in a similar or different field of study? The data shows that it seems to vary depending on the field of study associated with the first educational qualification. However, the distribution pattern of the second field of study could also be linked to the provision of short-duration credentials by institutions which could be more frequent in certain fields, in order to meet the needs of the labor market.
Of the graduates in the “Bac+” group, one-third (33.3%) obtained their short-duration credential in the same field of study as their 2010 Undergraduate degreeNote . This proportion was much higher for some specific fields of study such as “Health care” (86.8%) or “Business and administration” (75.0%). Individuals in the fields of “Arts and humanities” (12.5%), “Mathematics and computer and information science” (16.7%), “Science and science technology” (17.1%), and “Engineering and engineering technology” (20.0%) generally completed their short-duration credential in a different field of study.
| Field of study of the 2010 undergraduate degree | Total "Bac+" group | Short-duration credential in the same field of study | Short-duration credential in a different field of study | Same field of study rate |
|---|---|---|---|---|
| Number | percent | |||
| Science and science technology | 790 | 135 | 655 | 17.1 |
| Engineering and engineering technology | 75 | 15 | 60 | 20.0 |
| Mathematics and computer and information science | 60 | 10 | 50 | 16.7 |
| Business and administration | 800 | 600 | 200 | 75.0 |
| Arts and humanities | 1,000 | 125 | 875 | 12.5 |
| Social and behavioural sciences | 1,835 | 405 | 1,430 | 22.1 |
| Legal professions and studies | 25 | 10 | 15 | X |
| Health care | 380 | 330 | 50 | 86.8 |
| Education and teaching | 215 | 115 | 100 | 53.5 |
| Trades, services, natural resources and conservation | 190 | 45 | 145 | 23.7 |
| Total | 5,370 | 1,790 | 3,580 | 33.3 |
|
X suppressed to meet the confidentiality requirements of the Statistics Act Note: All figures are randomly rounded to a multiple of 5. Percentages are based on rounded counts. Due to low counts and rounding, the percentage for “Legal professions and studies” is not shown. Source: Statistics Canada. Postsecondary Student Information System (PSIS), 2009/2010 to 2015/2016 and T1 Family File (T1FF), 2011 to 2017 (subset compiled from linked microdata files, extracted June 19, 2019). |
||||
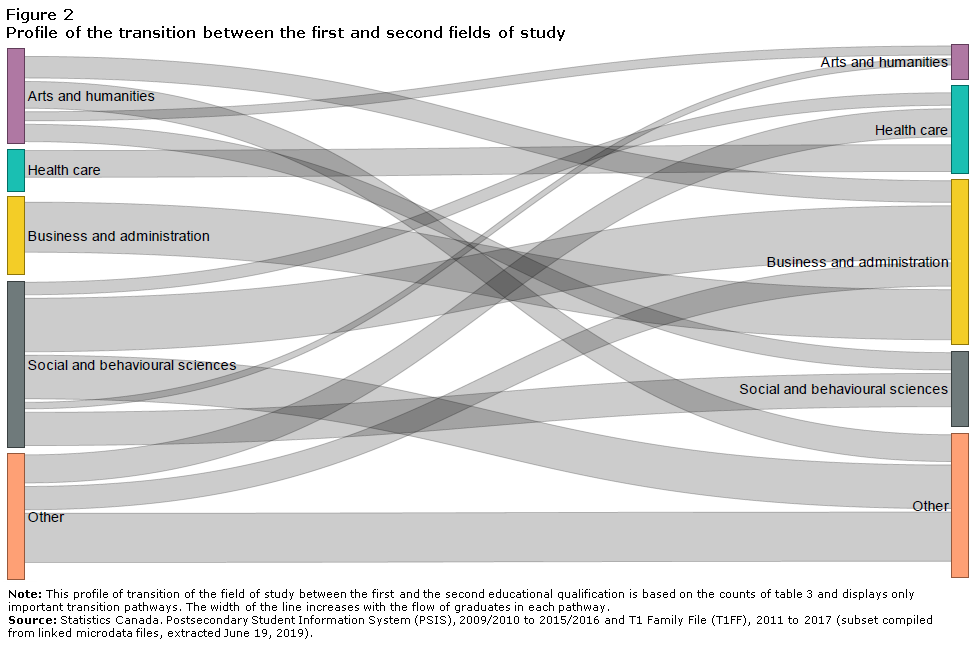
If we compare the fields of study of the first and short-duration credential, large outflows are also observed in “Social and behavioural sciences” and in “Arts and humanities” toward fields of study related to “Business and administration”. Of the 1,830 graduates in the “Bac+” group who earned their undergraduate degree in “Social and behavioural sciences” in 2010, 640 graduates (35.0%) completed their short-duration credential in “Business and administration”, and 165 (9.0%) in “Health care”. Similarly, of the 1,000 graduates in the “Bac+” group who earned their undergraduate degree in “Arts and humanities” in 2010, 270 (27.0%) completed their additional short-duration credential in “Business and administration”, and 220 (22.0%) in the field of “Social and behavioural sciences” (see figure 2 and table 3).
Description for Figure 2
This figure is a Sankey diagram based on the counts of table 3.
| Field of study of the 2010 undergraduate degree | Field of study of the additional short educational qualification | Graduates |
|---|---|---|
| Arts and humanities | Arts and humanities | 125 |
| Arts and humanities | Health care | 55 |
| Arts and humanities | Business and administration | 270 |
| Arts and humanities | Social and behavioural sciences | 220 |
| Arts and humanities | Other | 330 |
| Health care | Arts and humanities | 5 |
| Health care | Health care | 330 |
| Health care | Business and administration | 10 |
| Health care | Social and behavioural sciences | 5 |
| Health care | Other | 30 |
| Business and administration | Arts and humanities | 25 |
| Business and administration | Health care | 30 |
| Business and administration | Business and administration | 600 |
| Business and administration | Social and behavioural sciences | 55 |
| Business and administration | Other | 90 |
| Social and behavioural sciences | Arts and humanities | 95 |
| Social and behavioural sciences | Health care | 165 |
| Social and behavioural sciences | Business and administration | 640 |
| Social and behavioural sciences | Social and behavioural sciences | 405 |
| Social and behavioural sciences | Other | 525 |
| Other | Arts and humanities | 50 |
| Other | Health care | 345 |
| Other | Business and administration | 290 |
| Other | Social and behavioural sciences | 80 |
| Other | Other | 590 |
| Field of study of the 2010 undergraduate degree | Field of study of the additional short educational qualification | Graduates | percent of the field of study |
|---|---|---|---|
| number | percent of the field of study | ||
| Arts and humanities | Arts and humanities | 125 | 12.5 |
| Arts and humanities | Health care | 55 | 5.5 |
| Arts and humanities | Business and administration | 270 | 27.0 |
| Arts and humanities | Social and behavioural sciences | 220 | 22.0 |
| Arts and humanities | Other | 330 | 33.0 |
| Health care | Arts and humanities | 5 | 1.3 |
| Health care | Health care | 330 | 86.8 |
| Health care | Business and administration | 10 | 2.6 |
| Health care | Social and behavioural sciences | 5 | 1.3 |
| Health care | Other | 30 | 7.9 |
| Business and administration | Arts and humanities | 25 | 3.1 |
| Business and administration | Health care | 30 | 3.8 |
| Business and administration | Business and administration | 600 | 75.0 |
| Business and administration | Social and behavioural sciences | 55 | 6.9 |
| Business and administration | Other | 90 | 11.3 |
| Social and behavioural sciences | Arts and humanities | 95 | 5.2 |
| Social and behavioural sciences | Health care | 165 | 9.0 |
| Social and behavioural sciences | Business and administration | 640 | 35.0 |
| Social and behavioural sciences | Social and behavioural sciences | 405 | 22.1 |
| Social and behavioural sciences | Other | 525 | 28.7 |
| Other | Arts and humanities | 50 | 3.7 |
| Other | Health care | 345 | 25.5 |
| Other | Business and administration | 290 | 21.4 |
| Other | Social and behavioural sciences | 80 | 5.9 |
| Other | Other | 590 | 43.5 |
|
Note: All figures are randomly rounded to a multiple of 5. Source: Statistics Canada. Postsecondary Student Information System (PSIS), 2009/2010 to 2015/2016 and T1 Family File (T1FF), 2011 to 2017 (subset compiled from linked microdata files, extracted June 19, 2019). |
|||
Regarding the transition between provinces of study between the first and second educational qualifications, we see that the majority (90.2%) of graduates remained in the same province for both of their graduations (see table 4).
| Field of study of the 2010 undergraduate degree | Total "Bac+" group | Short-duration credential in the same province | Short-duration credential in a different province | Same province rate |
|---|---|---|---|---|
| number | percent | |||
| Newfoundland and Labrador | 50 | 25 | 25 | 50.0 |
| Prince Edward Island | 25 | 15 | 10 | X |
| Nova Scotia | 275 | 160 | 115 | 58.2 |
| New Brunswick | 115 | 50 | 65 | 43.5 |
| Quebec | 965 | 950 | 15 | 98.4 |
| Ontario | 2,650 | 2,510 | 140 | 94.7 |
| Manitoba | 105 | 80 | 25 | 76.2 |
| Saskatchewan | 80 | 60 | 20 | 75.0 |
| Alberta | 315 | 250 | 65 | 79.4 |
| British Columbia | 790 | 745 | 45 | 94.3 |
| Total | 5,370 | 4,845 | 525 | 90.2 |
|
X suppressed to meet the confidentiality requirements of the Statistics Act Note: All figures are randomly rounded to a multiple of 5. Percentages are based on rounded counts. Due to low counts and rounding, the percentage for Prince Edward Island is not shown. Source: Statistics Canada. Postsecondary Student Information System (PSIS), 2009/2010 to 2015/2016 and T1 Family File (T1FF), 2011 to 2017 (subset compiled from linked microdata files, extracted June 19, 2019). |
||||
4. Evolution of select employment quality indicators before and after obtaining the second educational qualification
Tax data available in the T1 Family File (T1FF) can be used to measure the added value of obtaining a short-duration credential by examining some employment quality indicators in the “Bac+” group both two years before and two years after obtaining the additional credentialNote .
One of these employment quality indicators is the proportion of workers in “low value-added service industries”Note that, on average, offer lower wages and fewer benefits than jobs in other sectors. In total, the proportion of bachelor graduates from 2010 who obtained an additional short-duration credential between 2013 and 2015 and who worked in low value-added service industries fell from 22.1% two years before obtaining the short-duration credential to 9.9% two years after (Table 5). Similarly, the unionization rate increased by 4.6 percentage points from 37.8% to 42.4% two years before and two years after obtaining the short-duration credential. Also, the rate of participation in a pension plan increased by 16.3 percentage points compared with the periods two years before and two years after obtaining the short-duration credential. The same statistics for the “Bac” group over the same period show that these changes are due mostly to the additional short-duration credential and not only to additional experience in the labour market.
| "Bac+" | "Bac" | |||
|---|---|---|---|---|
| 2 years before | 2 years after | 2012 | 2016 | |
| percent | ||||
| Industrial sector | ||||
| Goods-producing industries | 4.7 | 6.4 | 10.5 | 11.1 |
| Low value-added service industry | 22.1 | 9.9 | 11.0 | 8.3 |
| High value-added service industry | 30.2 | 36.6 | 39.4 | 38.3 |
| Educational services | 9.9 | 11.6 | 11.8 | 12.9 |
| Health care and social assistance | 12.8 | 14.0 | 9.8 | 9.2 |
| Public administration | 15.1 | 18.0 | 12.0 | 14.0 |
| Unknown | 5.2 | 3.5 | 5.5 | 6.1 |
| Unionization rate | ||||
| Had union contributions | 37.8 | 42.4 | 35.9 | 37.7 |
| Had no union contributions | 62.2 | 57.6 | 64.1 | 62.3 |
| Rate of participation in a pension plan | ||||
| Participated in a pension plan | 30.2 | 46.5 | 37.0 | 46.3 |
| Did not participate in a pension plan | 69.8 | 53.5 | 63.0 | 53.7 |
|
Note: All numbers are randomly rounded to a multiple of 5. Percentages are based on rounded counts. Source: Statistics Canada. Postsecondary Student Information System (PSIS), 2009/2010 to 2015/2016 and T1 Family File (T1FF), 2011 to 2017 (subset compiled from linked microdata files, extracted June 19, 2019). |
||||
Overall, for employment income, there is an increase in employment income for graduates holding an additional short-duration credential between the two points in timeNote . For illustrative purposes, the following results focus on the “Bac+” group who obtained their short-duration credential in 2013 and the results for the 2014 and 2015 cohorts are available in Appendix B.
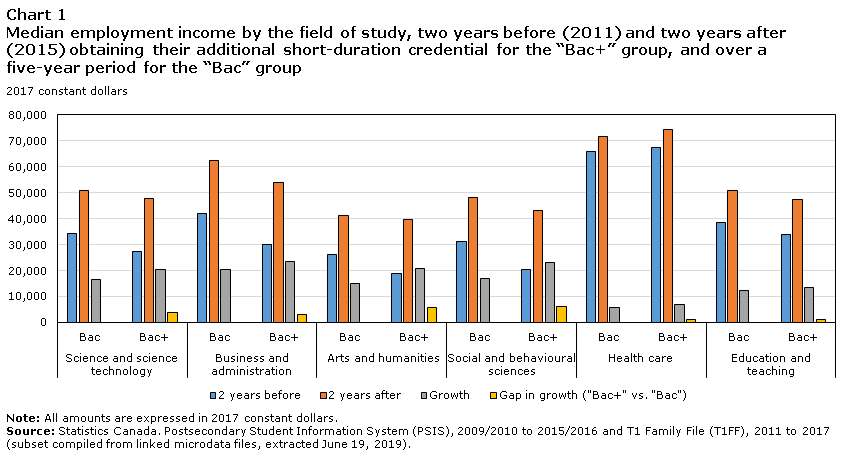
Two years before obtaining their additional short-duration credential, graduates in the “Bac+” group began in most fields of study, except for “Health Care”, with a lower median employment income, but obtained a very similar median employment income to the “Bac” group two years after obtaining their short-duration credential. Members of the “Bac+” group thus seem to be catching up to their counterparts in the “Bac” group, although a large number of members in the “Bac+” group interrupted their labour market path by returning to school full-time for at least one year.Note It is important to note that the fact that lower employment income may be a factor in encouraging graduates to complete an additional short-duration credential.
Analysis of employment income by the field of study of the first educational qualification shows that there is a wide variation in the value added by the additional short-duration credential. For example, in the “Arts and Humanities” field of study, those who obtained their additional short-duration credential in 2013 doubled their employment income (111% increase) between the two periods, while the members of the “Bac” group from the same field of study, had an increase of 58%. Likewise, members of the “Bac+” group in the “Science and technology of science” field of study increased by 75% for the 2013 cohort, compared to 48% for the “Bac” group.
Data table for Chart 1
| Science and science technology | Business and administration | Arts and humanities | Social and behavioural sciences | Health care | Education and teaching | |||||||
|---|---|---|---|---|---|---|---|---|---|---|---|---|
| Bac | Bac+ | Bac | Bac+ | Bac | Bac+ | Bac | Bac+ | Bac | Bac+ | Bac | Bac+ | |
| 2017 constant dollars | ||||||||||||
| 2 years before | 34,400 | 27,200 | 42,100 | 30,200 | 26,200 | 18,800 | 31,300 | 20,300 | 65,700 | 67,300 | 38,500 | 33,700 |
| 2 years after | 51,000 | 47,700 | 62,400 | 53,700 | 41,300 | 39,700 | 48,300 | 43,300 | 71,600 | 74,400 | 51,000 | 47,200 |
| Growth | 16,600 | 20,500 | 20,300 | 23,500 | 15,100 | 20,900 | 17,000 | 23,000 | 5,900 | 7,100 | 12,500 | 13,500 |
| Gap in growth ("Bac+" vs. "Bac") | Note ...: not applicable | 3,900 | Note ...: not applicable | 3,200 | Note ...: not applicable | 5,800 | Note ...: not applicable | 6,000 | Note ...: not applicable | 1,200 | Note ...: not applicable | 1,000 |
|
Note: All amounts are expressed in 2017 constant dollars. Source: Statistics Canada. Postsecondary Student Information System (PSIS), 2009/2010 to 2015/2016 and T1 Family File (T1FF), 2011 to 2017 (subset compiled from linked microdata files, extracted June 19, 2019). |
||||||||||||
5. Employment income progression
The income progression between 2011 and 2017 for both groups was examined further by dividing their income into quartiles. The top 25% of earners are categorized in Q4 while the lowest 25% of earners are categorized in Q1.
As shown in Table 6, the 2011 employment income distribution shows that nearly 72% of the members of the “Bac+” group are found in the two lower quartile comparatively to 49% for graduates with no additional educational qualification. However, in 2017, the gap had narrowed significantly as those proportions had reached 64.2% and 49.2% respectively.
| Group | Year | Revenue Quartile | |||
|---|---|---|---|---|---|
| percent | |||||
| Q1 | Q2 | Q3 | Q4 | ||
| "Bac" | 2011 | 23.9 | 24.9 | 25.6 | 25.6 |
| 2017 | 24.8 | 24.4 | 25.2 | 25.6 | |
| "Bac+" | 2011 | 45.4 | 26.4 | 14.5 | 13.8 |
| 2017 | 27.8 | 36.4 | 21.9 | 13.9 | |
|
Note: Only graduates who filed their income taxes, who did not return to school full time and who did not have self-employment income in 2011 and in 2017 are included. Source: Statistics Canada. Postsecondary Student Information System (PSIS), 2009/2010 to 2015/2016 and T1 Family File (T1FF), 2011 to 2017 (subset compiled from linked microdata files, extracted June 19, 2019). |
|||||
To measure the return on investment of the short-duration credential, we analyze the evolution of the employment income of members of the “Bac” and “Bac+” groups by comparing how graduates of the two groups progressed within the income quartiles between 2011 and 2017 (see table 7). This method consists in marking individuals in each quartile to track them over time.
| 2017 | ||||||
|---|---|---|---|---|---|---|
| Quartile 2011 |
Group | Counts | Q1 | Q2 | Q3 | Q4 |
| Number | percent | |||||
| Q1 | "Bac+" | 725 | 37.4 | 41.9 | 16.3 | 4.4 |
| "Bac" | 7,155 | 45.4 | 29.8 | 17.0 | 7.9 | |
| Q2 | "Bac+" | 420 | 22.0 | 41.0 | 22.5 | 14.5 |
| "Bac" | 7,460 | 27.4 | 35.4 | 25.1 | 12.1 | |
| Q3 | "Bac+" | 230 | 19.9 | 32.5 | 29.9 | 17.7 |
| "Bac" | 7,650 | 15.9 | 22.9 | 33.8 | 27.4 | |
| Q4 | "Bac+" | 220 | 15.9 | 13.2 | 30.9 | 40.0 |
| "Bac" | 7,660 | 12.2 | 10.1 | 24.2 | 53.5 | |
|
Note: Only graduates who filed their income taxes, who did not return to school full time and who did not have self-employment income in 2011 and in 2017 are included. Source: Statistics Canada. Postsecondary Student Information System (PSIS), 2009/2010 to 2015/2016 and T1 Family File (T1FF), 2011 to 2017 (subset compiled from linked microdata files, extracted June 19, 2019). |
||||||
To show that the additional short-duration credential had a positive impact on the income progression between 2011 and 2017 for the “Bac+” group comparatively to the “Bac” group, a test of independence was performed at each level of pre-results (quartiles of 2011) and the post-results (income quartiles of 2017). This analysisNote made it possible to affirm that a positive impact on employment income happened after the completion of an additional short-duration credential for the graduate with employment income mostly for those who were situated in the two lower quartiles.
Data table for Chart 2
| "Bac+" | "Bac" | |
|---|---|---|
| 2017 constant dollars | ||
| Science and science technology | 57,700 | 55,400 |
| Engineering and engineering technology | 73,900 | 89,000 |
| Mathematics and computer and information science | 53,900 | 81,600 |
| Business and administration | 67,900 | 73,600 |
| Arts and humanities | 48,600 | 46,200 |
| Social and behavioural sciences | 51,600 | 54,000 |
| Legal professions and studies | 52,800 | 65,800 |
| Health care | 68,600 | 64,200 |
| Education and teaching | 50,300 | 51,000 |
| Trades, services, natural resources and conservation | 53,400 | 54,700 |
|
Note: All amounts are expressed in 2017 constant dollars. Source: Statistics Canada. Postsecondary Student Information System (PSIS), 2009/2010 to 2015/2016 and T1 Family File (T1FF), 2011 to 2017 (subset compiled from linked microdata files, extracted June 19, 2019). |
||
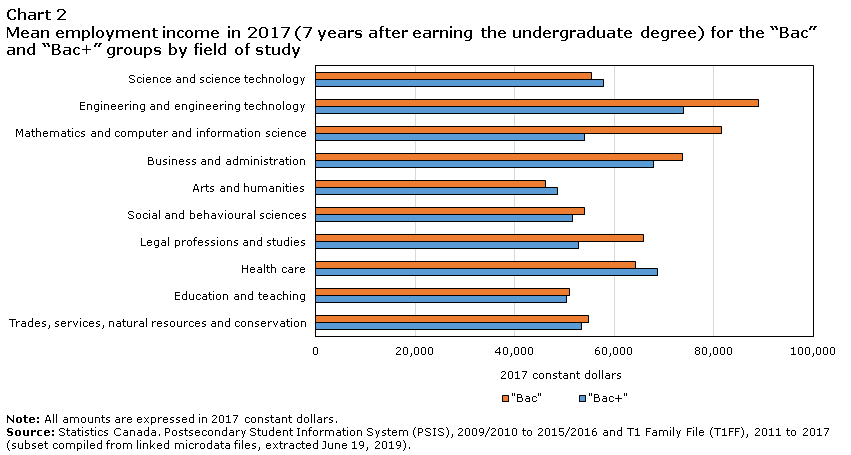
Despite the fact that the 2010 graduates who had acquired an additional short-duration credential after their undergraduate degree showed a catch-up in terms of employment earnings distributions, as well as some improvement in conditions of their employment, in comparison with their counterparts who had no additional qualifications, the gap in the average employment income remained after 7 years. A difference in employment income of around 26% was still observable in favour of graduates without additional educational qualifications. This difference does not, however, take into account the differences in demographic and educational characteristics observable between the two groups, which could partly explain this difference.
The difference between the employment incomes of the two groups was broken down using the Blinder-Oaxaca methodNote in order to quantify the proportion of the difference that can be explained by the differences in the characteristics such as age, gender, province of residence, and the time elapsed between the undergraduate degree and the additional short-duration credential (the composition effect) and the difference that can be attributed to an additional short-duration credential or other unobservable characteristics between the two groups, such as talent, motivation, better language, numeracy and writing skills, to name a few. This decomposition reveals that the difference of 26% is largely explained by the different composition in terms of socio-demographic characteristics such gender, original field of study, province of residence and the level of income the first year after graduation, of the two groups. Thus, 18 of the 26 percentage points (or 69% of the difference between both groups), are attributable to the different demographic and educational characteristics between the two groups, mainly due to the fact that the “Bac” group already earned higher employment income at the starting point.
6. Conclusion
This study shows that among the 102,865 graduates who completed an undergraduate degree in 2010 before the age of 25, 5,370 (5.2%) also completed an additional short-duration credential (certificate or diploma) while 66.3% had not completed further educational qualification six years after the bachelor’s degree. Two thirds (3,555) completed the short-duration credential in college and the remaining third (1,815) at university. Overall, women graduates had a higher propensity to pursue an additional certificate or diploma after their bachelor’s degree, as did those in BHASE (non-STEM) field of study.
This study also shows that graduates who completed an additional short-duration credential (certificate or diploma) saw employment quality indicators improve once their short-duration credential was completed. Indeed, even though graduates who had obtained an undergraduate degree in 2010, but who did not go to school to complete an additional short-duration credential, earned on average more than those who had obtained one additional short-duration credential between 2011 and 2016, those who did complete an additional short-duration credential had higher gains in employment income and an improvement in the level of unionization and participation in a pension plan. The global gap is largely explained by the starting level of employment income of both groups and is narrowed if there are controls for the other factors. For some fields of study, we see a tendency toward increased employment income for those who had an additional short-duration credential, compared with those who entered and remained in the labour market. Thus, graduates who completed an additional short-duration credential saw a greater increase in earnings than their counterparts who did not have additional educational qualifications, and nearly closed the gap.
Further studies could be conducted to understand why those with undergraduate degrees returned to school in non-traditional paths (e.g. obtaining a college diploma). Some factors, such as the school path, average undergraduate grades, availability of jobs in the chosen field of study, and even personal characteristics might lead some graduates to continue their studies.
Aimé Ntwari and Eric Fecteau are analysts with the Section of Special Projects related to postsecondary education, in the Canadian Centre for Education Statistics at Statistics Canada.
7. Bibliography
BLINDER, A. S., “Wage Discrimination: Reduced Form and Structural Estimates”, Journal of Human Resources, vol. 8, no. 4 (1973), 436–455.
BOX, G. E. P. and COX, D. R., “An Analysis of Transformations”, Journal of the Royal Statistical Society, Series B (Methodological), vol. 26, No. 2 (1964), 211-252.
HIDIROGLOU, M. A., and BERTHELOT, J.-M., “Statistical editing and imputation for periodic business surveys”. Survey Methodology, 12 (1986), 73–83.
MORISSETTE, R. “Earnings in the last decade”, Perspectives on Labour and Income. Statistics Canada catalogue No. 75-001-X, Vol. 9 (2008), No. 2.
OAXACA, R., “Male-Female Wage Differentials in Urban Labor Markets”. International Economic Review, vol. 14, no. 3 (1973), 693–709.
STATISTICS CANADA, “Education in Canada: Key results from the 2016 Census”, November 2017.
WILLIAMSON, J. and PITTINSKY, M., “Understanding the differences in what credentials are being stacked and why”, May 2016.
8. Appendix A: Methodology
The Postsecondary Student Information System (PSIS) provides detailed annual information on enrolments and graduations from Canadian public postsecondary institutions (universities and colleges) by the field of study and by certain demographic variables. However, PSIS data do not provide information on the graduate’s labour market outcomes, such as employment income. However, some of this information is available in administrative data sets such as tax data files.
Statistics Canada’s Education and Labour Market Longitudinal Platform (ELMLP) is based on the Postsecondary Student Information System (PSIS), the Registered Apprenticeship Information System (RAIS) and tax data from the T1 Family File (T1FF). Note that other data sets are also available in the Platform to fill gaps in data and provide a better understanding of the pathways of students and apprentices, their transitions to the labour market and outcomes over time.
The current study uses PSIS and tax data to present results for the 2010 cohort of bachelor’s degree graduates. The class of 2010 is the first available series with sufficient quality in terms of coverage and very low potential bias in linkage to tax information. The analysis focuses on individuals who earned a bachelor’s degree before the age of 25 to approximate a cohort of students who earned their first bachelor’s degree in order to adjust for educational qualifications possibly earned earlier by older age groups.
Educational qualification is derived by combining two Postsecondary Student Information System (PSIS) variables: program type and credential type. Note that Medicine, Dentistry, Veterinary medicine, Optometry, Pharmacy and Law degrees reported as “Undergraduate degrees” or “Post-baccalaureate non-graduate degrees” are regrouped as “Professional degrees.” “Post-baccalaureate non-graduate degrees” in the fields of Education and Social work are regrouped with “Undergraduate degrees”. For more information, consult the Classification of programs and credentials - professional degree variant.Employment quality indicators
Employment quality indicators available in the ELMLP include industrial sector, unionization rate, and the rate of participation in a private pension plan. They are sourced from income tax return data contained in the T1 Family File (T1FF). Industries are defined using the North American Industry Classification System (NAICS) for Canada (for more information, see Statistics Canada’s industry classification). This article identifies the main industry of wage-earners as the industry on the T4 slip with the highest wages and salaries (Box 14 for the T4 slip). The industry can be derived using the employer information on the T4 slip for most wage-earners. In addition, with income tax data, it is possible to determine the approximate rate of unionization using the proportion of graduates who reported union dues (line 212 of the T1 form). Also, the number of graduates participating in a private pension plan can be estimated using the proportion of graduates reporting contributions to a registered pension plan (line 207 of the T1 form).
In order to be able to assess these measures two years before and two years after the short-duration credential, we focus on a sub-group of the “Bac+” group who obtained their second qualification in 2013, 2014 or 2015. A period of two years was chosen since programs leading to short-duration credentials are typically between one and two years in duration. This allows for comparison of this group of graduates just before they start the program leading to their second credential and just after they return to the labour market.
Median and mean employment income
“Salaries, wages and commissions”, also called “employment income”, includes employment pay and commissions, as indicated on the T4 information slips, training allowances, tips, gratuities and royalties. It also includes tax-exempt employment income earned by registered Indians. Any form of self-employment income is excluded. The elements of employment income are salaries and wages (line 101 on the T1 form), other employment income (line 104 of the T1 form) and Indian exempt income (derived from information provided on the Determination of Exemption of an Indian’s Employment Income form).
The median employment income analysis (and the mean in Appendix B) of the members of the “Bac+” group, who obtained a short-duration credential in 2013 (in the text) or in 2014 and 2015 (in Appendix B) is done individually to allow for a comparison with a comparison group from the “Bac” group. For example, the members of the “Bac+” group who obtained their short-duration credential in 2013 are compared to the comparison group (the “Bac” group) in 2011 (two years before) and in 2015 (two years after), even if the comparison group did not obtain a short-duration credential during the period. The same type of analysis and comparison is done for the “Bac+” group who obtained their short-duration credential in 2014 and in 2015.
Blinder-Oaxaca decomposition
The variables retained in the model are the field of study associated with the undergraduate degree, gender, and a binary variable indicating whether a graduate took full-time studies after obtaining a degree. The Box-Cox transformationNote of the endogenous variable was needed to better adjust the model to the data. The natural logarithm of the employment earnings was used as an endogenous variable. In addition, to reduce the influence of extreme values on the model, the outlier variables were detected and processed using the Hidiroglou-Berthelot method.Note This method examines the distribution of the values of the given variable and identifies the values that exceed a certain threshold as outliers. The threshold value was calculated as follows for each field of study: where and are the median and the third quartile, respectively.
The employment income gaps between individuals in the “Bac” group and those in the “Bac+” group for the “employment income” variable were decomposed using the Blinder-Oaxaca method:
The difference between the means can be decomposed into three factors , the differences between exogenous factors, the difference between coefficients and an interaction term between the two, respectively.
: Mean of the square root of employment income
: Vector of regressors mean
This decomposition can also be written as: , the part explained and the part not explained by the model, respectively.
Where is a set of reference coefficients. The Oaxaca and Blinder method proposes: i.e. choose as basic average income in the model what a member of the “Bac” group would have received when submitted to the conditions of someone in the “Bac+” group, or vice versa.
9. Appendix B
| 2013 | 2014 | 2015 | |||||
|---|---|---|---|---|---|---|---|
| "Bac" | "Bac+" | "Bac" | "Bac+" | "Bac" | "Bac+" | ||
| 2017 constant dollars | |||||||
| Science and science technology | 2 years before | 34,400 | 27,200 | 41,000 | 18,000 | 44,500 | X |
| 2 years after | 51,000 | 47,700 | 54,200 | 46,900 | 57,700 | X | |
| Engineering and engineering technology | 2 years before | 59,200 | X | 66,900 | X | 72,600 | X |
| 2 years after | 81,500 | X | 82,600 | X | 87,600 | X | |
| Mathematics and computer and information science | 2 years before | 48,200 | X | 54,700 | X | 60,900 | X |
| 2 years after | 69,800 | X | 74,500 | X | 77,600 | X | |
| Business and administration | 2 years before | 42,100 | 30,200 | 48,000 | 45,900 | 53,600 | 45,000 |
| 2 years after | 62,400 | 53,700 | 65,500 | 57,100 | 70,300 | 55,400 | |
| Arts and humanities | 2 years before | 26,200 | 18,800 | 31,500 | 18,400 | 35,700 | 25,100 |
| 2 years after | 41,300 | 39,700 | 43,700 | 38,000 | 46,700 | 50,400 | |
| Social and behavioural sciences | 2 years before | 31,300 | 20,300 | 37,800 | 26,000 | 42,100 | 31,500 |
| 2 years after | 48,300 | 43,300 | 50,900 | 41,400 | 54,100 | 43,200 | |
| Legal professions and studies | 2 years before | 31,700 | X | 40,100 | X | 43,900 | X |
| 2 years after | 55,100 | X | 57,000 | X | 59,700 | X | |
| Health care | 2 years before | 65,700 | 67,300 | 68,200 | 68,600 | 69,700 | 66,500 |
| 2 years after | 71,600 | 74,400 | 71,900 | 78,500 | 71,600 | 65,200 | |
| Education and teaching | 2 years before | 38,500 | 33,700 | 43,800 | X | 47,800 | 40,900 |
| 2 years after | 51,000 | 47,200 | 53,100 | X | 55,100 | 55,700 | |
| Trades, services, natural resources and conservation | 2 years before | 38,600 | X | 44,500 | X | 48,200 | X |
| 2 years after | 51,900 | X | 54,000 | X | 55,400 | X | |
|
X suppressed to meet the confidentiality requirements of the Statistics Act Note: All amounts are expressed in 2017 constant dollars. Source: Statistics Canada. Postsecondary Student Information System (PSIS), 2009/2010 to 2015/2016 and T1 Family File (T1FF), 2011 to 2017 (subset compiled from linked microdata files, extracted June 19, 2019). |
|||||||
| 2013 | 2014 | 2015 | |||||
|---|---|---|---|---|---|---|---|
| "Bac" | "Bac+" | "Bac" | "Bac+" | "Bac" | "Bac+" | ||
| 2017 constant dollars | |||||||
| Science and science technology | 2 years before | 35,600 | 30,900 | 41,600 | 24,100 | X | X |
| 2 years after | 52,100 | 45,400 | 54,500 | 47,800 | X | X | |
| Engineering and engineering technology | 2 years before | X | X | X | X | X | X |
| 2 years after | X | X | X | X | X | X | |
| Mathematics and computer and information science | 2 years before | X | X | X | X | X | X |
| 2 years after | X | X | X | X | X | X | |
| Business and administration | 2 years before | 41,700 | 28,600 | 49,000 | 43,000 | 55,600 | 45,100 |
| 2 years after | 65,900 | 53,100 | 69,200 | 60,100 | 75,200 | 57,700 | |
| Arts and humanities | 2 years before | 27,000 | 20,600 | 31,600 | 23,900 | 35,600 | 28,300 |
| 2 years after | 41,000 | 37,900 | 43,700 | 36,200 | 47,500 | 49,100 | |
| Social and behavioural sciences | 2 years before | 31,600 | 23,400 | 37,300 | 26,100 | 41,900 | 32,400 |
| 2 years after | 48,700 | 44,500 | 51,200 | 41,400 | 55,300 | 45,100 | |
| Legal professions and studies | 2 years before | X | X | X | X | X | X |
| 2 years after | X | X | X | X | X | X | |
| Health care | 2 years before | 61,000 | 59,100 | 63,600 | 66,700 | 64,100 | 59,800 |
| 2 years after | 64,800 | 71,100 | 64,700 | 76,200 | 65,000 | 62,500 | |
| Education and teaching | 2 years before | 37,800 | 31,400 | 42,000 | 40,700 | 44,800 | 39,900 |
| 2 years after | 47,500 | 44,300 | 49,100 | 52,200 | 51,000 | 51,800 | |
| Trades, services, natural resources and conservation | 2 years before | 38,000 | 26,500 | X | X | X | X |
| 2 years after | 51,400 | 39,400 | X | X | X | X | |
|
X suppressed to meet the confidentiality requirements of the Statistics Act Note: All amounts are expressed in 2017 constant dollars. Source: Statistics Canada. Postsecondary Student Information System (PSIS), 2009/2010 to 2015/2016 and T1 Family File (T1FF), 2011 to 2017 (subset compiled from linked microdata files, extracted June 19, 2019). |
|||||||
- Date modified: