
|
 |
Children with disabilities and the educational system — a provincial perspective
Dafna Kohen, Sharanjit Uppal, Anne Guevremont, and Fernando Cartwright
Health Analysis and Measurement Group
Statistics Canada
How many children have a reported disability?
In what kinds of classrooms are students with disabilities found?
Access to special education services
Parental perceptions of the school environment
Achievement of students with disabilities
Conclusion
Canadian provinces have education policies that seek to ensure free and
appropriate education for all students, including children who confront
a variety of disabling conditions. However, educational policies regarding
the education of children with disabilities vary across provinces, as well
as across school jurisdictions within provinces, and even across schools
within jurisdictions. Policy differences include differences in the criteria
used to determine the services for which children are eligible, in the services
provided to children with similar disabilities, and in the allocation
of resources for providing these services.
This article1 explores issues emerging from these provincial policy differences, making use of a variety of data sources to address the following questions: What are the prevalence rates for different categories of reported disability that children confront? In what kinds of classrooms are students with disabilities enrolled? How many students have access to special education services? What barriers to educational services do parents of children with disabilities perceive? How do disabilities affect student achievement in core areas of the curriculum?
2001 Participation and Activity Limitation Survey: Definitions
Types of reported disability
An individual is considered to have a disability if the parent reports a chronic condition, either a physical disability or a cognitive/emotional disability. In this context, a chronic condition limits the amount or kind of activity that a person can perform, the condition is expected to last at least six months and has been diagnosed by a health professional. A physical disability may be a difficulty in hearing, seeing, speaking or being understood, walking or dexterity. Chronic conditions classified as physical disabilities include, among others, asthma, heart conditions, cancer, epilepsy, spina bifida and muscular dystrophy. Cognitive/emotional disabilities include, among others, learning disabilities (attention problems, dyslexia); cognitive limitations due to a disorder such as Down syndrome or autism; and emotional, psychological or behavioural conditions.
Severity of reported disability
Children with mild to moderate disabilities include those whose health condition causes some activity limitations—for example, children who experience some or a lot of difficulty walking or moving their hands. Children with severe to very severe disabilities include those with multiple significant disabilities as well as those who suffer from the total loss of a function—for example, children who cannot walk or who have a total loss of sight.
The 2001 Participation and Activity Limitation Survey (PALS) estimated the number of Canadian children who experience difficulties in daily living or limitations in the kind or amount of activities they can do. Parents were given a range of intellectual, behavioural, and physical conditions that can affect children at home, at school and at play, and they indicated the way in which their child was limited. Parents were also asked about their needs for special education services and whether these needs were being met.
Based on data from PALS, it was estimated that 155,000 Canadian children
between the ages of 5 and 14, or 4% of all children in this age group,
had some form of activity limitation reported in 2001.2 The
proportion of children with a reported disability varied somewhat by
province, ranging from 2.5% in Quebec to 4.8% in Nova Scotia and Alberta.
Since there are large differences across provinces in terms of overall
population, there were also substantial differences in the overall numbers
of children with a reported disability. For example, 44% (68,000) of
all Canadian children reporting disabilities lived in Ontario, 14% (21,000)
lived in each of British Columbia and Quebec, and 13% (20,000) lived
in Alberta.
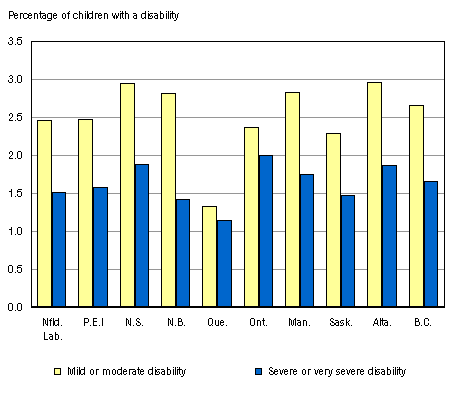
Approximately 2.3% of Canadian children had a reported mild or moderate disability, ranging from 1.3% in Quebec to 3.0% in Alberta. The 1.7% of all Canadian children who experienced a reported disability that was severe or very severe ranged between 1.1% in Quebec to 2.0% in Ontario (Chart 1).
Chart 1
The proportion of children with a reported disability varies by province, especially for mild or moderate disability, 2001

Sources: Statistics Canada, 2001 Participation and Activity Limitation Survey.
The use of special education classes varied considerably by province. Chart
2 shows that the proportion of 5- to 14-year-old students with disabilities
who were in regular classes (that is, not in special education classes or
schools) was highest in Prince Edward Island (73%), New Brunswick (72%) and
Nova Scotia (67%), and lowest in Quebec (48%) and British Columbia (51%).
The percentage of students in regular classes in the other provinces was close
to the national average (59%). In all provinces, most of the children with
reported disabilities who were not in regular classes attended some special
education classes or went to a special education school.
Chart 2
The percentage of disabled students in regular classes, by province, 2001

Sources: Statistics Canada, 2001 Participation and Activity Limitation Survey.
In 2001, of the 155,000 Canadian children with disabilities, 38% were receiving
special education services. Parents in Prince Edward Island (19%), Nova
Scotia (24%), New Brunswick (22%), and Manitoba (30%) were less likely than
the national average to report that their child received special education
services. No other province differed significantly from the national average.
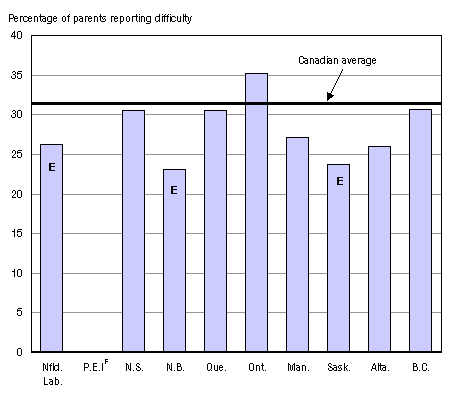
About one-third of all parents of children with disabilities reported experiencing
difficulty accessing special education services (Chart 3). Parents in Ontario
were most likely to report experiencing difficulties (35%).
Parents responding to the PALS were asked to offer one or more reasons why they were experiencing difficulties in accessing special education. In each province, an insufficient level of staffing or services was the most commonly reported reason for experiencing such difficulties. Nationally, 75% of parents reported this reason; 47% reported difficulties related to obtaining an assessment; 44% reported that they had communication problems with their child’s school; and 39% indicated that they could not access special education services because these services were not available locally.
A variety of professionals assess children’s eligibility for special education services. In Quebec, 59% of parents of children with disabilities reported that their child had been assessed by a speech and language therapist, a significantly greater proportion than the national average of 42%. Compared with the Canadian average of 63%, significantly fewer parents in Newfoundland and Labrador (48%), New Brunswick (43%) and Prince Edward Island (34%) reported having had their child assessed by a psychologist or psychiatrist. Parents in all provinces reported approximately the same percentage of children as having been assessed by a special education consultant (58%).These provincial differences may reflect differences in supply (i.e., in the availability of assessment professionals), in demand (i.e., the number of children requiring assessment) or in policy (i.e., the eligibility requirements for receiving an assessment).
Chart 3
Among parents of children with disabilities, about one-third reported experiencing difficulty in accessing special education services, 2001

Notes:
E Use with caution
F Too unreliable to be published
Sources: Statistics Canada, 2001 Participation and Activity Limitation Survey.
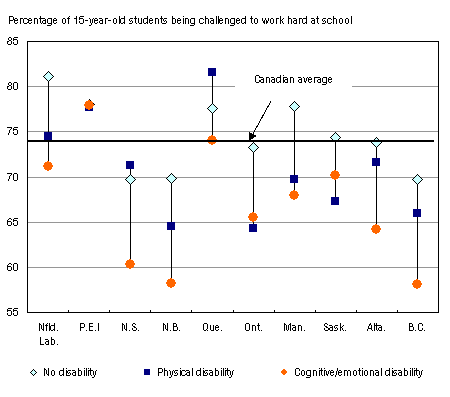
The Youth in Transition Survey (YITS), cycle 1, was used to examine one aspect of parental perceptions of the school environment. YITS was designed to examine the major transitions in the lives of youth, particularly with respect to education, training and work. YITS follows two cohorts of youth, one aged 15 in 2000 and the other aged 18 to 20 in 2000. In 2000, the survey for the 15-year-old cohort included questions for parents about limitations in the activities their child could perform due to a physical, mental, or health problem. Parents were also asked about whether they believed their child’s school was “pushing their 15-year-old to reach his or her full potential.” Most parents – about three in four – believed this to be the case. However, the parents of students with cognitive/emotional disabilities were on the whole less likely to report that their children were being challenged to achieve their full potential.
A note on youth with disabilities participating in PISA/YITS
It should be noted that the population of youth with disabilities who participated in PISA/YITS is not representative of all youth with disabilities. Since this study involved a three-hour in-school assessment, some youth were excluded from the study if their functional or cognitive disability was such that they could not perform under the conditions of the PISA testing environment. Consequently, youth with moderate or severe disabilities who did not participate in the study are excluded from this analysis.
Overall, parents of children in Prince Edward Island, Newfoundland and
Labrador, Quebec, and Manitoba were significantly more likely than
the national average to agree that schools were challenging their
children to meet their potential (78%, 81%, 78%, and 77%, respectively).
While 74% of all parents thought their child was being challenged
to meet their potential in 2000, this proportion was lower for children
with physical disabilities (70%) and lowest for those with cognitive/emotional
disabilities (64%). Significant differences in parental perceptions of the
school environment for students with cognitive/emotional disabilities and
those with no disabilities were only observed in New Brunswick and British
Columbia—in
both provinces, the percentage of parents who responded their child
was being challenged was 58% for those with cognitive/emotional disabilities,
compared with 70% for those with no disabilities (Chart 4). At the
national level, the percentage of parents of children with physical
disabilities who believed that schools were challenging their children
to reach their potential was statistically lower than for parents
of students with no disability; however, at the provincial level, these
differences were not significantly different
Chart 4
Parents of children with disabilities were less likely to believe that schools were challenging their children to meet their potential, 2000

Sources: Statistics Canada and Human Resources and Skills Development Canada, Youth in Transition Survey, cycle 1; Organisation for Economic Co-operation and Development, 2000, Programme for International Student Assessment (PISA).
The Programme for International Student Assessment (PISA) offers insights into how 15-year-olds with disabilities are faring academically relative to their non-disabled counterparts. Through tests administered in May 2000, PISA assessed the skills of 15-year-olds in three domains: reading, mathematics and science. Reading scores were grouped into five levels of reading proficiency, where Level 1 designates students with the lowest level of reading literacy, and Level 5 designates those students with the highest level of reading literacy.
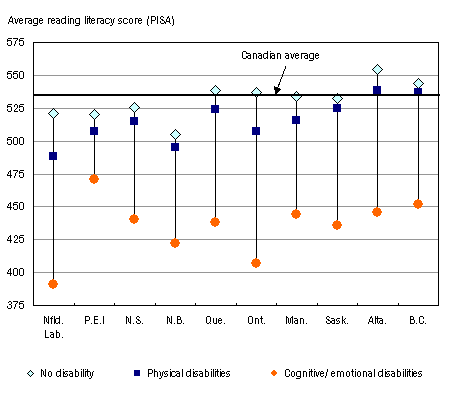
On the reading test, students with reported physical disabilities scored only slightly lower than students without disabilities. However, there was a substantial gap in performance between students with reported cognitive/emotional disabilities and those with no disabilities. The average reading score for students with cognitive/emotional disabilities was 430 (Level 2); the national average was 530 (Level 3).
The literacy gap between disabled and non-disabled students varied considerably by province. Chart 5 shows average reading scores by province for 15-year-old students with no disabilities, with physical disabilities, and with cognitive/emotional disabilities. Across the provinces, while the average scores of those with physical disabilities were lower than for those without disabilities, the difference was not statistically significant in any province with the exception of Newfoundland and Labrador. On the other hand, across all provinces, students with cognitive disabilities score significantly lower than those without disabilities. This difference was most pronounced in Newfoundland and Labrador, Ontario and Alberta and least pronounced in Prince Edward Island. In Alberta, students with no disabilities had the highest scores in Canada, but those with cognitive/emotional difficulties had reading literacy levels comparable to those for students with cognitive/emotional disabilities in the other provinces.
Chart 5
The literacy gap between disabled and non-disabled students, by province, 2000

Sources: Statistics Canada and Human Resources and Skills Development Canada, Youth in Transition Survey, cycle 1; Organisation for Economic Co-operation and Development, 2000, Programme for International Student Assessment (PISA).
Prevalence rates of reported childhood disability vary across the provinces, as do access to and barriers to educational services. For the most part, Canadian children with disabilities were educated in regular classrooms in 2001. In Prince Edward Island, Nova Scotia and New Brunswick, a higher than average proportion of disabled students attended regular classes, although the proportion of children with disabilities was similar to the Canadian average. Further research is needed to determine whether this is a result of inclusive policies such as “mainstreaming” or of a lack of availability of services such as special education classes.
In every province, close to one-third of parents of children with disabilities reported difficulty in receiving special education services. The proportion was highest in Ontario, where the largest number of children with disabilities lived in 2001. It should be noted that children with disabilities were as likely to receive professional assessments and special education services in Ontario as they were in the rest of the country.
Many parents in each province also believed that their children, particularly children with cognitive/emotional disabilities, were not being challenged to meet their full potential. This perception of the school climate was less pronounced in Prince Edward Island, Newfoundland and Labrador, and Quebec.
Prince Edward Island demonstrated the smallest gap between children with cognitive/emotional disabilities and non-disabled children. Moreover, parents in this province were the most likely to report that their children were being challenged to meet their potential. New Brunswick also had a high proportion of disabled students attending regular classes and while overall, students in this province demonstrated lower literacy scores on average than students in any of the other provinces, the disparity in scores between non-disabled children and those with cognitive/emotional disabilities was smaller than in other provinces, with the exception of Prince Edward Island.
Ontario showed the largest gap in literacy scores between cognitive/emotionally disabled students and non-disabled students. However in Ontario, while literacy scores for children with cognitive/emotional disabilities tended to be lower, they were not significantly different from those in other provinces.
While parents in Prince Edward Island and Newfoundland and Labrador reported that their children were being challenged at school, parents in the other Maritime Provinces and in Ontario were less likely to report that their children were being challenged to meet their potential. Other factors that may play a role in these differences include differences in the availability of resources for teachers and teacher’s aides or in the parental support.
These findings are a starting point for examining the pattern of academic participation and functioning by Canadian children with disabilities. Further study is warranted to understand the provincial differences in educational placement and availability of special educational services for children with disabilities, as well as the interplay of parental, school and classroom factors that are important determinants of children’s academic achievement.
Notes
-
This article is based on Kohen Dafna, Sharanjit Uppal, Saeeda Khan and Laura Visentin. 2006. Access and Barriers to Educational Services for Canadian Children with Disabilities. Working Paper for the Canadian Council on Learning. Ottawa. Also see Fellegi, Ivan. 2004. Children with Special Needs in Canada. Presentation for the Canadian Education Statistics Council. Statistics Canada. March 1.
Statistics Canada. 2003. Children with Disabilities and Their Families Tables. Statistics Canada. Catalogue no. 89-586-XIE. (accessed March 23, 2007).
|


