
|
||||||
Information identified as archived is provided for reference, research or recordkeeping purposes. It is not subject to the Government of Canada Web Standards and has not been altered or updated since it was archived. Please "contact us" to request a format other than those available.

|
Provincial Drop-out rates - Trends and ConsequencesGeoff Bowlby
Drop-out rate falling Whether from teachers, parents or government officials, we have all heard the mantra, "Stay in school." Life experiences have taught us that education improves one's lot in life. To support the notion, a large and continually growing body of evidence exists that suggests the more education, the better, especially when it comes to making a smooth transition into the workforce.A high school diploma is very important. Not only can it provide entry to postsecondary education (college or university), it sends a strong signal to prospective employers. In 2004, the unemployment rate among people aged 25 to 44 who did not have a high school diploma was 12.2%, while for those whose highest level of education was high school, it was much lower, at 6.8%. Moving to higher levels of education, the unemployment rate continues to drop, although not to the same extent. Around the world, teens are heeding the advice to stay in school. As more and more young people complete high school and postsecondary education, educational attainment continues to grow in most economically developed countries1. In Canada, school attendance rates for 15-19-year-olds peaked at around the 82% to 84% range in recent years, up considerably from 25 years earlier when only two-thirds of teens in this age bracket were attending school. In fact, from 1979 to 2004, the teen population fell by 13% (as the baby boomers left this group), but the number of teenagers in school was up almost 10%.Drop-out rate fallingDrop-out rates have declined significantly. During the 1990-1991 school year, the first year for which drop-out rates can be calculated using the Labour Force Survey (LFS), 16.7% of 20-to-24-year- olds were neither attending school, nor had a high school diploma; by 2004-2005, the drop-out rate had fallen to 9.8% (Figure 1).What does this mean in terms of number of people? During the 2004-2005 school year, there were there were 2.2 million 20-24-year-olds in Canada, 7.4% more than in 1990-1991. Approximately 212,000 of them had dropped out of high school, down 37.2% from 1990-1991. Figure 1. High school drop-outs1 as a percentage of all 20-24-year-olds, Canada, 1990-1991 to 2004-2005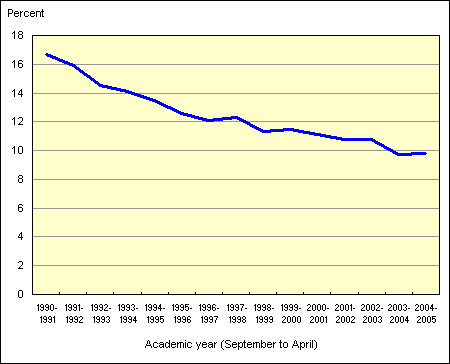 1 Defined as 20-24-year-olds without a high school diploma and not in school. Source: Table 1.
In terms of education data, the main elements produced using the LFS
are estimates of the educational attainment of the population, as well
as school attendance estimates. Combining these two estimates and using
the age information of the respondent, one can calculate a "drop-out rate." As a result, the drop-out rate is calculated as: This is the same definition used by the
Organization for Economic Cooperation and Development
in their international comparisons of drop-out rates. Comparing these LFS data to another key source of information on school
drop-outs, the Youth
in Transition Survey (YITS), the results are remarkably similar. For
example, for December 1999, YITS estimated the drop-out rate among 20-year-olds
to be 12.0%, almost identical to the LFS estimate for 20-24-year-olds
for that month (11.9%). Two years later, when new drop-out rates were
calculated for 22-year-olds still in the YITS sample, the rate had dropped
to 11.0%. For the 2000-2001 school year, the LFS shows a rate of 11.1%. Regional trends in drop-out ratesThe decline in the high school drop-out rate is pervasive dropping out is becoming less common in all parts of Canada.The decline has been most apparent in eastern Canada. On average for the 1990-1991 to 1992-1993 school year, about one in five 20-to-24-year-olds were without a high school diploma and were not attending school in Newfoundland and Labrador and in Prince Edward Island, the highest rates in the country at the time (Figure 2). Over the three most recent school years, the drop-out rate in both these provinces has been in the 8% to 10% range, ranking them among the lowest in Canada. Drop-out rates also fell sharply in Nova Scotia and New Brunswick. With drop-out rates falling as they have in Atlantic Canada, there now appears to be two groups of provinces - the first consisting of Atlantic Canada, Ontario and British Columbia, with relatively low drop-out rates, and the second, made up of Quebec and the Prairie provinces, with rates that have averaged above10% over the last three years (although also declining).Although drop-out rates have decreased in recent years, there remain pockets where dropping out remains relatively high. Rural areas, for example, tend to have higher drop-out rates than urban parts of Canada. Figure 2. High school drop-outs1 as a percentage of all 20-24-year-olds, Canada and provinces, average of 1990-1991 to 1992-1993 and 2002-2003 to 2004-2005 school years 1 Defined as 20-24-year-olds without a high school diploma and not in school. Source: Table 2. Outside of Canada's largest communities, the drop-out rate in the 2004-2005 school year was 16.4%, almost double the rate (9.2%) within Census Metropolitan Areas and Census Agglomerations (CMA/CA) (Table 3). In both small towns and more isolated rural areas, the drop-out rate was comparatively high. On average over the last four years, dropping out has been especially high in rural and small-town Alberta and Quebec. In both those areas, about one in five 20-24-year-olds had not completed high school and was no longer going to school. Drop-out rates were also high in rural and small-town Manitoba.In Alberta, there was a sharp divide between the rural areas and the cities. While drop-out rates in rural and small towns exceeded 20%, in the CMA/CA's, it was about 10%. Not only were drop-out rates also high in rural and small-town Manitoba and Quebec, they were higher than average in the urban parts of those provinces as well. On average over the 2001-2002 to 2004-2005 period, drop-out rates in urban Quebec and Manitoba averaged about 11%. In Ontario, the drop-out rate over the 2001-2002 to 2004-2005 period was 9.1%, about half of what it was at the start of the 1990s. In Toronto, the drop-out rate averaged 13.5% during the 1990-1991 to 1992-1993 period, but fell to 7.9% by the 2002-2003 to 2004-2005 period. There remain approximately 73,000 people in their early 20's in Ontario who have not yet completed their diploma. Where there were once around 45,000 drop-outs in Toronto, there are now about two-thirds that number.Who is dropping out?The majority of drop-outs are young men. Of the 212,000 drop-outs in Canada in 2004-2005, 135,000 were men (Figure 3). The rates of dropping out among young men was 12.2% in 2004-2005, compared with 7.2% for young women. For both men and women, the drop-out rate has fallen from 1990-1991, when they were 19.2% and 14.0%, respectively.Figure 3. Thousand of High school drop-outs1, by gender, Canada, 1990-1991 to 2004-2005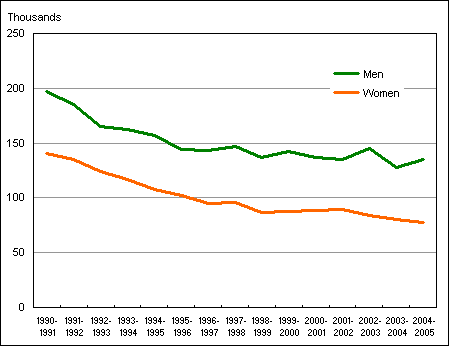 1 Defined as 20-24-year-olds without a high school diploma and not in school. Source: Table 4. The over-representation of males among drop-outs is not new. However, the share of school leavers who are male has increased in recent years. In 1990-1991, a sizable majority of drop-outs were men (58.3%), but by 2004-2005, that proportion had increased to 63.7%. This was not because more men were dropping out in fact, there has been a decrease in the number of male drop-outs but rather because the decrease in the rate of dropping out has been larger for young women. The finding that there are more male than female drop-outs holds across provinces. This tendency is strongest in Quebec, where in 2004-2005 seven in ten drop-outs were young men.As noted in the October 2004 issue of Education Matters,2 the reasons behind the decision to drop out of high school reported by 20-year-olds in the Youth in Transition Survey differed somewhat between males and females. Young men were less likely to be engaged in school than young women and were more likely to report wanting to work/earn money as a reason for dropping out of high school. In contrast, teenage pregnancy plays a larger role in the decision to drop out of high school for young women. According to the Youth in Transition Survey, 15.9% of female drop-outs left school because they were pregnant or because they needed to tend to their child.3 Labour Force Survey data show that almost four in ten young female drop-outs had children and were heading a household. But again, the trend is down - at the start of the 1990's, there were approximately 60,000 female drop-outs heading a household in Canada who had children, falling to about 30,000 in recent years. The share of female drop-outs who had children was high in every province, but was highest in eastern Canada and in Saskatchewan. On average over the last 16 years, over half of female drop-outs in those parts of the country were heading a household and had children.What are some of the labour market consequences of dropping out?As mentioned earlier, the labour market in Canada rewards those with education. It follows, then, that high school drop-outs have a harder time finding work than others who were able to follow high school through to completion and perhaps to continue in the education system.Approximately 61.7% of drop-outs were employed in 2004-2005 (Figure 4). This is up considerably from 1996-1997 (54.4%) when the youth labour market began to rebound from the severe recession of the early 1990s. That recession hit all youth hard, but especially young drop-outs. Although the employment rate for drop-outs has since trended up, it remains well below the employment rate for 20-24-year-olds as a whole (67.8%). While drop-outs have trouble landing a job, they nevertheless are active in the labour market. Since 1997-1998, they have been more likely to be looking for work than other people their age. This is positive in one sense - one might expect young drop-outs to quit the job hunt in discouragement. But while young drop-outs are active in the hunt for work, the demand for them by employers is weak. This is reflected in the unemployment rate which is very high among drop-outs. In 2004-2005, it was 19.4%, double the rate for all 20-24-year-olds.It was in Alberta where drop-outs were most likely to be working in 2004-2005. Over the last three school years, the employment rate for high school non-completers in that province averaged 68.7%, meaning that drop-outs in Alberta's hot economy were more likely to be working than those with a high school diploma in other provinces. Figure 4. Employment rates, high school drop-outs1 and all 20-24-year-olds, Canada, 1990-1991 to 2004-2005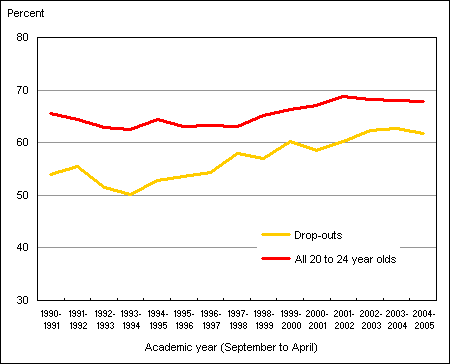 1 Defined as 20-24-year-olds without a high school diploma and not in school. Source: Table 5. How does Canada compare to other countries?With some understanding of the national and regional trends in dropping-out in Canada, who is dropping out and what some of the economic consequences are, it might seem natural to ask: how are we doing relative to other countries?Recently, the Organization for Economic Cooperation and Development (OECD) compiled drop-out rate data from Labour Force Surveys in 25 countries.4 Using the same definition as in this report, it showed that in 2002, Canada was near the middle of the pack. The drop-out rate in Canada for the 2002 calendar year was 10.9%, somewhat below the rate in the United States (12.3%) the year earlier. In the OECD study, the country with a drop-out rate most similar to Canada's was Finland. Although Canada has a lower drop-out rate than many countries, the rate is lower in nine other countries in the OECD study, most notably Norway, where the drop-out rate was only 4.6%.ConclusionThe evidence suggests that much progress has been made at a national level in reducing the high school drop-out rate among Canada's youth. This decline has touched all parts of Canada, but especially the Atlantic provinces.Not all sub-groups have made equal progress in this regard, however. Drop-out rates generally remain higher in rural areas and in small towns than in urban areas, especially in Quebec, Manitoba and Alberta. And clearly, young males continue to experience a higher likelihood of dropping-out than young females. In the end, despite the progress, there remain over 200,000 young Canadians who can be termed "drop-outs." This is concerning, especially given the evidence that some young drop-outs in fact do reasonably well in school in terms of their academic performance.5 The evidence is also clear that potential employers avoid hiring high school drop-outs. The unemployment rate among drop-outs is double that of other 20-24-year-olds, a reality that will be reflected in their earnings and their prospects in the longer term.The substantial decline in the drop-out rate over the past decade suggests that many of the programs that have been put in place to encourage young people to stay in school until they graduate are meeting with success. Programs have also been put in place to afford high school drop-outs a second chance, by offering the opportunity to return to school to complete the requirements for high school graduation. One can expect that take up of 'second-chance' programs is influenced in part by the early labour-market experiences of young drop-outs who find they face real difficulties in securing stable, long-term employment that actually pays a decent wage. Notes
Tables:Source: Statistics Canada, Labour Force Survey.
2 Since the Labour Force Survey is a sample survey subject to some inherent error, particularly among smaller geographies, provincial drop-out rates are averaged over three-year periods. This is done to improve the confidence in the trend. Source: Statistics Canada, Labour Force Survey.
2 Since the Labour Force Survey is a sample survey subject to some inherent error, particularly among smaller geographies, provincial drop-out rates are averaged over three-year periods. This is done to improve the confidence in the trend. For areas smaller than provincial, four-year averages were used. Source: Statistics Canada, Labour Force Survey.
Source: Statistics Canada, Labour Force Survey.
Source: Statistics Canada, Labour Force Survey. |
|
