
Income Research Paper Series
Improvements to the Canadian Income Survey Methodology for the 2022 Reference Year
Skip to text
Text begins
Introduction
The Canadian Income Survey (CIS) has introduced improvements to the methods and data sources used to produce income and poverty estimates with the release of its 2022 reference year estimates. Foremost among these improvements is a significant increase in the sample size for a large subset of the CIS content. Estimates for 2022 and moving forward also include improvements to the weighting methodology and the extension of the target population for the CIS from persons aged 16 years and over to persons aged 15 years and overNote .
This paper begins by explaining the changes leading to the increased sample size for the CIS. Next, it describes the updates to the weighting methodology. Finally, it presents the approximate net result of these changes on income estimates for the 2021 reference year. The changes described in this paper highlight the ways in which data quality has been improved while producing small impacts on key CIS estimates and trends.
This paper is a follow up to Improvements to the Canadian Income Survey Methodology for the 2021 Reference Year which detailed key changes to the methodology of the CIS introduced for 2021. The goal of these updates over the past two years was to stabilize and improve current and future income estimates and generate more reliable estimates in smaller domains for the CIS.
Increasing to the full Labour Force Survey sample size
The CIS questionnaire is asked to a sub-sample of respondents to the Labour Force Survey (LFS), gathering information on labour market activity, school attendance, support payments, child care expenses, personal income, disabilities, unmet health care needs, food security, and characteristics and costs of housing.
The LFS uses a rotating panel sample design so that selected dwellings remain in the LFS sample for six consecutive months. Each month, about one-sixth of the LFS sampled dwellings are in their first month of the survey, one-sixth are in their second month of the survey, and so on. Those answering the LFS for the last time (sixth month in the survey) are referred to as the “rotate-out” group. In most years, the CIS questionnaire was asked to rotate-out groups from January to June of the year following the reference year. The final CIS sample included all persons in households that responded to the CIS questionnaire.
In 2022, a new quarterly supplement to the LFS was developed: the Labour Market and Socioeconomic Indicators (LMSI). It is conducted from July to December every year, and similarly to the CIS, the questionnaire is asked for the rotate-out groups in these months. In addition to labour-related content, it includes some of the CIS modules: support payments and child care expenses, which are used in the production of poverty estimates, as well as disability and unmet health care needs.
For the 2022 reference year, the CIS sample size, which would have traditionally only included CIS respondents from January to June 2023, was increased to include the LMSI respondents from July to December 2022, as well the LFS respondents who did not respond to either LMSI or CIS, but were part of the rotate-out groups from July 2022 to June 2023. This population, which corresponds to the LFS sample size for a year, is referred to as “CIS-Plus”, and its goal is to improve and stabilize CIS income and poverty estimates. The CIS-Plus sample is more than double the traditional CIS-only sample.
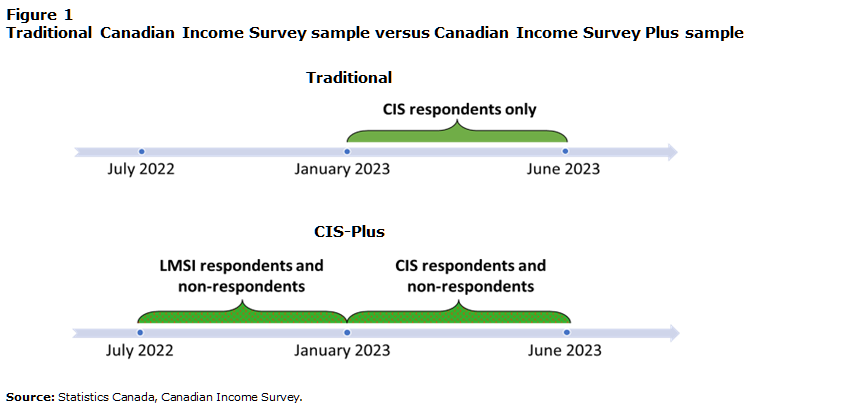
Description for Figure 1
The figure compares the traditional Canadian Income Survey (CIS) sample versus the Canadian Income Survey Plus (CIS-Plus) sample. The first image displays the traditional CIS sample showing that it includes only CIS respondents from January to June 2023, inclusive. The second image displays the CIS-Plus sample showing that it includes 1) LMSI respondents and non-respondents from July to December 2022, inclusive, and 2) CIS respondents and non-respondents from January to June 2023, inclusive.
The CIS-Plus sample is made possible by linking to income variables from the Administrative Personal Income Masterfile (APIM), which is a comprehensive, centrally processed source of personal income data generated from tax returns and associated tax slips from the Canada Revenue Agency (CRA). Additionally, the CIS content on the LMSI supplement allows poverty estimates to be produced for the whole CIS-Plus sampleNote . As a result, CIS estimates or tables that only include income or poverty variables, as well as variables derived from the LFS such as demographic information, main job characteristics or family composition, can now be produced using the whole CIS-Plus sample.
Canadian Income Survey tables that include content that is only available from the traditional CIS questionnaire must still be produced using the CIS-only (subset of CIS-Plus) sample. For example, annual labour force information, food insecurity, and most housing-related variables are only available for the CIS-only sample.
Following the methodology of the CIS questionnaire, the disability and unmet health care need modules in the LMSI supplement are asked for one randomly selected person per household. The inclusion of the disability and unmet health care need modules in the LMSI supplement doubles the sample for these estimates (but only for content also available for the CIS-Plus sample, such as income and poverty).
Updates to the weighting strategy
The calibration classes were adjusted to include economic family type, ensuring less frequently surveyed family types such as lone-parent families are properly represented. In addition, the number of social assistance recipients was introduced into the calibration strategy as social assistance recipients appear to be otherwise underrepresented among respondents. Calibration is the process of modifying the weights so that the estimates from the survey for relevant population characteristics respect population totals from other reliable sources. Calibration is applied to correct for coverage and non-response issues.
The first set of population totals used by the CIS are estimates provided by Statistics Canada's Centre for Demography of population counts based on the 2016 Census of Population. For each province, population counts by age/sex groups and economic family size are used. CIS also employs population counts for six Census Metropolitan Areas (Montreal, Toronto, Winnipeg, Calgary, Edmonton, and Vancouver).
The second set of totals is derived from the APIM and is intended to ensure that the weighted distribution of income (based on wages and salaries) in the data set matches that of the Canadian population.
For CIS 2020 and CIS 2021, two sets of totals were added to account for the changes in response patterns and new sources of income available due to the pandemic. The first set of totals, based on the 2021 Census results, adjusted the weights according to the number of households by housing tenure. The second set of totals, based on APIM estimates, adjusted the weights to reflect the number of Canada Emergency Response Benefit recipients and Canada Emergency Student Benefit recipients in 2020, and the number of Canada Recovery Benefit recipients in 2021.
For CIS 2022, the weight adjustment for the number of households by housing tenure remains. In addition, the weights are adjusted to reflect the number of families by economic family type and size, using estimates from Statistics Canada's Centre for Demography. The following categories are used:
- Non-senior males not in an economic family
- Non-senior females not in an economic family
- Senior males not in an economic family
- Senior females not in an economic family
- Couples without children or relatives
- Couples with one or more children under 18 years
- Couples with other relatives only
- Male lone-parent families
- Female lone-parent families
- Other
Where appropriate, the categories are further grouped by family size of two and three or more.
Further, the weights are adjusted to reflect the number of social assistance recipients. Control totals were created for the number of social assistance recipients by province from the APIM.
Inclusion of 15-year-olds in the CIS income universe
The in-scope age for the CIS income, demographic and labour variables was lowered from 16 years old to 15 years old. This change aligns with the LFS which collects labour information for individuals who are 15 years and older.
Impacts on the Canadian Income Survey estimates
This section will discuss some of the key changes resulting from implementing the methodological improvements described previously. For the tables presented, the published estimates for 2021 were produced before the aforementioned methodological changes, while the published estimates for 2022 incorporated all the improvements.
For analytical purposes, another set of estimates for 2021 (Experimental) were also produced incorporating the methodological changes for the purpose of assessing their impact. As the name suggests, the results of this analysis should be treated as experimental for 2021, as the changes weren’t fine-tuned as they were for the 2022 reference year. Therefore, the experimental estimates for 2021 should not be considered as replacements for the official (Published) estimates.
Note that although the following tables highlight the key impacts on the CIS estimates, other differences can be observed when looking at the data at more disaggregated levels.
Changes to the distribution of economic family types
Updating the weighting strategy to include economic family type in the calibration has an impact on the distribution of families by family type. Among economic families, senior families increased by 161,000 families (+7.5%) while non-senior families decreased by 160,000 families (-2.0%). Lone-parent families, which are traditionally underrepresented on the CIS increased by 161,000 families (+27.4%). Among persons not in an economic family, unattached seniors decreased by 242,000 (-11.8%) while unattached non-seniors increased by 242,000 (+5.7%).
| 2021 | 2022 | |||
|---|---|---|---|---|
| Published | Experimental | Difference | Published | |
| (in thousands) | ||||
| Economic families and persons not in an economic family | 16,425 | 16,425 | 0 | 16,679 |
| Economic families | 10,103 | 10,103 | 0 | 10,222 |
| Senior families | 2,153 | 2,314 | 161Note * | 2,400 |
| Non-senior families | 7,949 | 7,789 | -160Note * | 7,822 |
| Couples | 2,218 | 2,038 | -180Note * | 2,038 |
| Couples with children | 3,069 | 3,080 | 11 | 3,102 |
| Couples with other relatives | 1,024 | 1,148 | 124Note * | 1,146 |
| Lone-parent families | 588 | 749 | 161Note * | 735 |
| Male lone-parent families | 123 | 151 | 28Note * | 148 |
| Female lone-parent families | 464 | 598 | 134Note * | 586 |
| Other non-elderly families | 1,051 | 774 | -277Note * | 802 |
| Persons not in an economic family | 6,322 | 6,322 | 0 | 6,458 |
| Seniors not in an economic family | 2,059 | 1,817 | -242Note * | 1,859 |
| Non-seniors not in an economic family | 4,263 | 4,505 | 242Note * | 4,599 |
Source: Statistics Canada, Canadian Income Survey, custom tabulation. |
||||
Social assistance recipients increase
With the introduction of social assistance recipients into the calibration strategy, the number of families receiving social assistance benefits on the CIS increased by 34.9%. The increases are statistically significant across almost all family types, ranging from 30.8% for unattached individuals to 83.5% for lone-parent families. Both changes to the calibration strategy, i.e. the addition of the number of families by family type and the addition of the number of social assistance recipients, contributed to the increase in the number of lone-parent families receiving social assistance benefits.
| 2021 | 2022 | |||
|---|---|---|---|---|
| Published | Experimental | Difference | Published | |
| (in thousands) | percent | (in thousands) | ||
| Economic families and persons not in an economic family | 1,039 | 1,402 | 34.9Note * | 1,464 |
| Economic families | 601 | 829 | 37.9Note * | 871 |
| Senior families | 111 | 157 | 41.4Note * | 177 |
| Non-senior families | 490 | 671 | 36.9Note * | 694 |
| Couples | 38 | 61 | 60.5Note * | 70 |
| Couples with children | 110 | 155 | 40.9Note * | 162 |
| Couples with other relatives | 84 | 137 | 63.1Note * | 123 |
| Lone-parent families | 91 | 167 | 83.5Note * | 167 |
| Other non-elderly families | 168 | 152 | -9.5 | 172 |
| Persons not in an economic family | 438 | 573 | 30.8Note * | 593 |
| Seniors not in an economic family | 57 | 75 | 31.6Note * | 80 |
| Non-seniors not in an economic family | 380 | 498 | 31.1Note * | 513 |
|
||||
Relatively small changes to income estimates
As seen previously, changes made to the calibration strategy have impacted the distribution of families by family type as well as the number of social assistance recipients. These changes, along with the large increase in the sample size, will in turn have impacts on income estimates. Comparing the official 2021 estimates to the experimental 2021 estimates that incorporate the methodological changes, the experimental estimate of median after-tax income for economic families and persons not in an economic family was 1.2% lower for Canada in 2021. Nova Scotia (-2.8%) and Ontario (-2.8%) experienced decreases in their median after-tax income, while all other provinces remained relatively unchanged.
The introduction of social assistance recipients into the calibration strategy contributes to the decrease in after-tax income. Increasing the number of social assistance recipients to match APIM control totals increases the survey weights for this population. Since social assistance recipients typically have lower incomes on average, this will tend to decrease the median after-tax income.
The impact of changes in the distribution of families by family type is more difficult to assess. For example, the increase in the number of lone-parent families would tend to lower the median after-tax income, but the growth in the number of couples with other relatives would tend to increase the median. Other changes in the distribution of families by family type would also have contrary effects on the median, making it difficult to conclude on the net results of the addition of the family type in the calibration strategy.
| 2021 | 2022 | |||
|---|---|---|---|---|
| Published | Experimental | Difference | Published | |
| 2022 constant dollars | percent | 2022 constant dollars | ||
| Canada | 73,000 | 72,100 | -1.2Note * | 70,500 |
| Newfoundland and Labrador | 66,300 | 66,200 | -0.2 | 63,100 |
| Prince Edward Island | 66,700 | 65,400 | -1.9 | 63,300 |
| Nova Scotia | 64,300 | 62,500 | -2.8Note * | 58,500 |
| New Brunswick | 64,100 | 62,500 | -2.5 | 59,700 |
| Quebec | 65,500 | 64,700 | -1.2 | 64,600 |
| Ontario | 78,000 | 75,800 | -2.8Note * | 74,600 |
| Manitoba | 69,100 | 68,400 | -1.0 | 66,900 |
| Saskatchewan | 72,800 | 72,800 | 0.0 | 72,100 |
| Alberta | 82,300 | 83,400 | 1.3 | 82,700 |
| British Columbia | 73,200 | 72,600 | -0.8 | 70,600 |
|
||||
For the majority of family types, the median after-tax income remained relatively unchanged. Couples with children had a small increase of 1.7% in their median after-tax income, while other non-senior-families and unattached non-seniors had decreases of 8.6% and 3.5%, respectively.
| 2021 | 2022 | |||
|---|---|---|---|---|
| Published | Experimental | Difference | Published | |
| 2022 constant dollars | percent | 2022 constant dollars | ||
| Economic families and persons not in an economic family | 73,000 | 72,100 | -1.2Note * | 70,500 |
| Economic families | 101,600 | 101,000 | -0.6 | 99,800 |
| Senior families | 74,600 | 74,300 | -0.4 | 74,200 |
| Non-senior families | 110,100 | 110,400 | 0.3 | 109,500 |
| Couples | 98,400 | 97,800 | -0.6 | 96,700 |
| Couples with children | 121,500 | 123,600 | 1.7Note * | 122,000 |
| Couples with other relatives | 150,200 | 151,200 | 0.7 | 152,500 |
| Lone-parent families | 65,400 | 65,000 | -0.6 | 63,100 |
| Male lone-parent families | 78,400 | 74,600 | -4.8 | 71,700 |
| Female lone-parent families | 63,200 | 62,800 | -0.6 | 61,400 |
| Other non-elderly families | 94,000 | 85,900 | -8.6Note * | 85,300 |
| Persons not in an economic family | 38,600 | 38,500 | -0.3 | 37,800 |
| Seniors not in an economic family | 33,500 | 33,500 | 0.0 | 33,600 |
| Non-seniors not in an economic family | 42,300 | 40,800 | -3.5Note * | 40,100 |
|
||||
As could be expected given the previous findings, the new methodological changes also led to a decrease in the median market income. Similar to after-tax income, only couples with children showed an increase in their median market income.
| 2021 | 2022 | |||
|---|---|---|---|---|
| Published | Experimental | Difference | Published | |
| 2022 constant dollars | percent | 2022 constant dollars | ||
| Economic families and persons not in an economic family | 65,900 | 64,600 | -2.0Note * | 65,100 |
| Economic families | 98,300 | 96,100 | -2.2Note * | 98,500 |
| Senior families | 46,800 | 45,900 | -1.9 | 47,700 |
| Non-senior families | 111,700 | 112,700 | 0.9 | 115,600 |
| Couples | 109,000 | 108,000 | -0.9 | 109,300 |
| Couples with children | 123,900 | 127,100 | 2.6Note * | 129,700 |
| Couples with other relatives | 159,900 | 161,200 | 0.8 | 166,800 |
| Lone-parent families | 49,100 | 45,400 | -7.5 | 48,400 |
| Male lone-parent families | 80,700 | 74,600 | -7.6 | 70,700 |
| Female lone-parent families | 42,400 | 41,500 | -2.1 | 43,600 |
| Other non-elderly families | 84,200 | 78,800 | -6.4Note * | 80,000 |
| Persons not in an economic family | 32,300 | 32,300 | 0.0 | 32,800 |
| Seniors not in an economic family | 14,100 | 14,000 | -0.7 | 14,500 |
| Non-seniors not in an economic family | 43,800 | 41,800 | -4.6Note * | 41,600 |
|
||||
In terms of government transfers, although the overall median remained relatively unchanged, increases were observed for a few family types. Worth mentioning is the decrease in median government transfers for persons not in an economic family, even though the median rose for both seniors and non-seniors not in an economic family. This can be explained by the change in the distribution of family types. As seen in Table 1, the number of seniors not in an economic family decreased, while the number of non-seniors increased. Since non-seniors receive in general much lower government transfers than seniors, the median government transfers for all persons not in an economic family decreased.
| 2021 | 2022 | |||
|---|---|---|---|---|
| Published | Experimental | Difference | Published | |
| 2022 constant dollars | percent | 2022 constant dollars | ||
| Economic families and persons not in an economic family | 14,200 | 14,400 | 1.4 | 10,100 |
| Economic families | 17,900 | 18,800 | 5.0Note * | 13,700 |
| Senior families | 34,600 | 34,700 | 0.3 | 34,300 |
| Non-senior families | 11,400 | 12,000 | 5.3Note * | 8,600 |
| Couples | 2,200 | 2,600 | 18.2 | 2,000 |
| Couples with children | 14,300 | 14,300 | 0.0 | 10,700 |
| Couples with other relatives | 10,500 | 12,400 | 18.1Note * | 7,600 |
| Lone-parent families | 18,200 | 19,100 | 4.9 | 15,700 |
| Male lone-parent families | 9,000 | 10,300 | 14.4 | 10,000 |
| Female lone-parent families | 21,100 | 21,300 | 0.9 | 17,100 |
| Other non-elderly families | 20,400 | 19,400 | -4.9 | 13,100 |
| Persons not in an economic family | 8,000 | 6,800 | -15.0Note * | 3,200 |
| Seniors not in an economic family | 21,100 | 21,300 | 0.9Note * | 21,400 |
| Non-seniors not in an economic family | 1,000 | 1,200 | 20.0Note * | 1,300 |
|
||||
A look at poverty and low-income estimates
In this section, we will look at the impact the previously detailed changes have on the poverty and low-income estimates.
It should be noted that since the LMSI survey was only implemented in 2022, it was not possible to derive poverty estimates that include the whole CIS-Plus sample for 2021. Therefore, poverty estimates presented below only include the traditional CIS sample.
Comparing the official 2021 poverty estimate to the experimental estimates produced after implementing the methodological changes, the experimental estimate was 0.3 percentage points higher nationally, and also higher for some provinces and family types. For example, the experimental estimates were higher in Newfoundland and Labrador, Nova Scotia, New Brunswick, Quebec and Ontario. The experimental estimate was lower for senior families (-0.2 percentage points) in 2021, while non-senior families (+0.2 p.p.) and unattached non-seniors (+0.9 p.p.) saw slightly higher experimental estimates. The tendency towards higher poverty estimates under the new methodology is consistent with changes in the methods which yield more lone parent families and families receiving social assistance.
Nevertheless, the methodological updates to include economic family type and social assistance recipients into the calibration strategy result in better estimations for the distribution of family types, as well as more accurate income estimates for historically underrepresented family types and sources of income. This in turn produces a better picture of individuals experiencing poverty on the CIS, while having only a minor impact on the incidence of poverty.
| 2021 | 2022 | |||
|---|---|---|---|---|
| Published | Experimental | Difference | Published | |
| percent | percentage points | percent | ||
| Canada | 7.4 | 7.7 | 0.3Note * | 9.9 |
| Newfoundland and Labrador | 8.1 | 9.0 | 0.9Note * | 9.8 |
| Prince Edward Island | 7.4 | 7.1 | -0.3 | 9.8 |
| Nova Scotia | 8.6 | 9.0 | 0.4Note * | 13.1 |
| New Brunswick | 6.7 | 7.1 | 0.4Note * | 10.9 |
| Quebec | 5.2 | 5.6 | 0.4Note * | 6.6 |
| Ontario | 7.7 | 8.0 | 0.3Note * | 10.9 |
| Manitoba | 8.8 | 8.6 | -0.2 | 11.5 |
| Saskatchewan | 9.1 | 9.7 | 0.6 | 11.1 |
| Alberta | 7.8 | 8.0 | 0.2 | 9.7 |
| British Columbia | 8.8 | 8.8 | 0.0 | 11.6 |
|
||||
| 2021 | 2022 | |||
|---|---|---|---|---|
| Published | Experimental | Difference | Published | |
| percent | percentage points | percent | ||
| Economic families and persons not in an economic family | 7.4 | 7.7 | 0.3Note * | 9.9 |
| Economic families | 4.4 | 4.5 | 0.1 | 6.6 |
| Senior families | 3.0 | 2.8 | -0.2Note * | 4.3 |
| Non-senior families | 4.7 | 4.9 | 0.2Note * | 7.1 |
| Couples with children | 4.0 | 4.0 | 0.0 | 6.3 |
| Lone-parent families | 16.1 | 16.7 | 0.6 | 22.6 |
| Male lone-parent families | 11.6 | 10.6 | -1.0 | 17.6 |
| Female lone-parent families | 17.2 | 18.2 | 1.0 | 23.8 |
| Persons not in an economic family | 21.9 | 23.1 | 1.2Note * | 26.0 |
| Seniors not in an economic family | 13.0 | 13.1 | 0.1 | 13.8 |
| Non-seniors not in an economic family | 26.2 | 27.1 | 0.9Note * | 31.0 |
|
||||
Using the low income measure after tax (LIM-AT), it is possible to look at the impact of both the change in the calibration strategy and the use of the whole CIS-Plus sample.
| 2021 | 2022 | |||||
|---|---|---|---|---|---|---|
| CIS-only | CIS-Plus | Published | ||||
| Published | Experimental | Difference | Experimental | Difference from published | ||
| percent | percentage points | percent | percentage points | percent | ||
| Canada | 10.6 | 10.8 | 0.2Note * | 11.1 | 0.5Note * | 11.9 |
| Newfoundland and Labrador | 14.3 | 15.1 | 0.8Note * | 15.3 | 1.0 | 15.8 |
| Prince Edward Island | 12.2 | 12.8 | 0.6 | 13.0 | 0.8 | 13.5 |
| Nova Scotia | 12.9 | 13.4 | 0.5 | 14.0 | 1.1 | 16.5 |
| New Brunswick | 11.9 | 12.3 | 0.4 | 13.7 | 1.8Note * | 16.5 |
| Quebec | 11.7 | 11.9 | 0.2 | 11.5 | -0.2 | 10.5 |
| Ontario | 10.0 | 10.3 | 0.3Note * | 10.7 | 0.7Note * | 12.1 |
| Manitoba | 13.9 | 13.9 | 0.0 | 13.6 | -0.3 | 15.7 |
| Saskatchewan | 12.2 | 13.0 | 0.8Note * | 14.0 | 1.8Note * | 13.7 |
| Alberta | 8.9 | 9.1 | 0.2 | 9.0 | 0.1 | 10.0 |
| British Columbia | 9.5 | 9.8 | 0.3 | 10.5 | 1.0 | 11.6 |
|
||||||
As can be seen in Table 9, the low-income rate is slightly higher when including the whole CIS-Plus sample, although not in all provinces. This could be a result of random sampling variance between the two groups. Comparing with the published estimates, the low-income rate when all methodological changes are taken into account is higher for New Brunswick, Ontario, Saskatchewan, and Canada as a whole.
Impact of including 15-year-olds in the income universe
Extending the target population for income data from persons aged 16 years and over to persons aged 15 years and over has a minimal impact on median incomes at the family level. However, at the individual level, the inclusion of 15-year-olds decreases median incomes, especially for the younger age group (15 to 24 years old). As can be seen in Table 10, the median market income and median total income for those 15 years and over decreased slightly with the addition of 15-year-olds. For the younger age group, the medians were reduced by 6.6% for those with market and/or total income. Accounting for those with zero income resulted in the median market and total income being 17.2% and 15.8% lower, respectively, as 15-year-olds are less likely to earn income.
| 2022 | ||||||
|---|---|---|---|---|---|---|
| 16 years and over | 15 years and over | Difference | 16 to 24 years | 15 to 24 years | Difference | |
| dollars | percent | dollars | percent | |||
| Excluding zero incomes | ||||||
| Market income | 40,400 | 40,100 | -0.7 | 15,100 | 14,100 | -6.6 |
| Total income | 43,500 | 43,100 | -0.9 | 16,700 | 15,600 | -6.6 |
| Including zero incomes | ||||||
| Market income | 33,500 | 32,600 | -2.7 | 12,200 | 10,100 | -17.2 |
| Total income | 42,500 | 41,700 | -1.9 | 14,600 | 12,300 | -15.8 |
| Source: Statistics Canada, Canadian Income Survey, custom tabulation. | ||||||
Impact on data quality
The following tables show the coefficient of variations (CVs) for median after-tax income by province and selected family types. CVs are a widely used measure of sampling error which are the estimated standard error expressed as a percentage of the estimate.
The larger sample size resulting from the implementation of the CIS-Plus improves income estimates, as there is a reduction of the CVs for every province and family type in 2021 and 2022. The CVs tend to improve more for smaller domains, which is important for better quality estimates of smaller populations such as racialized groups or Indigenous people, and less common income sources.
| 2021 | 2022 | |||
|---|---|---|---|---|
| Published | Experimental | Difference | Published | |
| percent | percentage points | percent | ||
| Canada | 0.48 | 0.35 | -0.13 | 0.28 |
| Newfoundland and Labrador | 1.86 | 1.37 | -0.49 | 1.28 |
| Prince Edward Island | 2.16 | 1.48 | -0.68 | 1.63 |
| Nova Scotia | 1.34 | 0.99 | -0.35 | 1.02 |
| New Brunswick | 1.71 | 0.91 | -0.80 | 0.79 |
| Quebec | 1.00 | 0.74 | -0.26 | 0.62 |
| Ontario | 0.89 | 0.58 | -0.32 | 0.52 |
| Manitoba | 1.20 | 0.86 | -0.34 | 0.82 |
| Saskatchewan | 1.88 | 1.08 | -0.80 | 1.03 |
| Alberta | 1.19 | 0.79 | -0.39 | 1.06 |
| British Columbia | 1.39 | 0.89 | -0.50 | 0.74 |
| Source: Statistics Canada, Canadian Income Survey, custom tabulation. | ||||
| 2021 | 2022 | |||
|---|---|---|---|---|
| Published | Experimental | Difference | Published | |
| percent | percentage points | percent | ||
| Economic families and persons not in an economic family | 0.48 | 0.35 | -0.13 | 0.28 |
| Economic families | 0.48 | 0.31 | -0.16 | 0.27 |
| Senior families | 0.96 | 0.69 | -0.27 | 0.60 |
| Non-senior families | 0.58 | 0.30 | -0.28 | 0.29 |
| Couples with children | 0.81 | 0.54 | -0.27 | 0.47 |
| Lone-parent families | 2.12 | 1.60 | -0.52 | 1.00 |
| Male lone-parent families | 4.12 | 3.21 | -0.90 | 2.22 |
| Female lone-parent families | 2.62 | 1.58 | -1.05 | 1.08 |
| Persons not in an economic family | 1.11 | 0.65 | -0.47 | 0.55 |
| Seniors not in an economic family | 1.52 | 1.11 | -0.42 | 0.76 |
| Non-seniors not in an economic family | 1.49 | 0.83 | -0.66 | 0.69 |
| Source: Statistics Canada, Canadian Income Survey, custom tabulation. | ||||
Conclusion
The 2022 reference year Canadian Income Survey estimates featured key updates with the goal of improving data quality and accuracy. Notably, the survey sample size increased to utilize the full Labour Force Survey sample, and the calibration strategy was modified to include the family type and social assistance recipients. This paper described the main changes on CIS estimates resulting from these methodological updates.
The impact of these updates was measured using the 2021 reference year data. Overall, the median after-tax income was slightly lower in Canada when estimated using the new methods, while the poverty rate and the low-income rate were slightly higher. In both cases, differences were relatively small.
In conclusion, the introduction of methodological updates for the 2022 CIS had a small impact on key CIS estimates and trends, while making significant improvements in data quality.
- Date modified: