
Income Research Paper Series
Canadian Income Survey: Population rebasing, 2012 to 2019
Skip to text
Text begins
Abstract
Periodically, income statistics are updated to reflect the most recent population estimates derived after the census. Accordingly, with the release of the 2020 data from the Canadian Income Survey (CIS), Statistics Canada has revised estimates for 2012 to 2019 using totals from population estimates based on the 2016 Census. This paper presents a comparison between revised and unrevised estimates for key income series, and describes other modifications made to CIS variables.
1. Introduction
The Canadian Income Survey (CIS) was developed to provide information on the income and income sources of Canadians, with their individual and household characteristics. The CIS began to publish income estimates for the 2012 reference year, and reports on many of the same statistics as its predecessorsNote , allowing for a relatively long time series going back to 1976. In addition to its long time series, its periodicity and continuity of income concepts makes the CIS an important source for income data.
The CIS is a cross-sectional sample survey. It consists of a short questionnaire which is asked of a sub-sample of the Labour Force Survey (LFS). In addition to income concepts, it gathers information on a variety of other topics, such as labour market activity, school attendance, food security, shelter costs, disability, among others. Similar to the process employed by the LFSNote , the CIS periodically undergoes a revision process called, “population rebasing”. When the latest Census information becomes available, surveys can improve the representativeness of their samples by adjusting their survey weights. After reweighting to the latest totals from populations estimates based on the most recent census, income estimates are of better quality and the various estimates from the survey and from external sources are more comparable (Tremblay, 2005). Adjusting the weights is done by using the provincial counts for different demographic groups (e.g., individuals by age group and gender, economic families by size and households by size), population counts for six Census Metropolitan Areas (Montreal, Toronto, Winnipeg, Calgary, Edmonton and Vancouver), and distribution of individuals by wage class based on administrative tax data.
Previous to the 2020 CIS release, 2012 to 2019 CIS estimates were based on population estimates derived from the 2011 Census of Population. With the release of 2020 data, these CIS estimates have been adjusted to reflect the population estimates based on the 2016 Census and its coverage analysisNote . Overall, the total Canadian population fell slightly following the revision, while there were relatively larger revisions to the population counts based on economic family and household sizes. These new population estimates were used to recalculate the CIS weights back to 2012.
In addition to the revisions to the survey weights, geographical boundaries have also been updated. Census metropolitan areas (CMAs), economic regions (ERs) and census agglomerations (CAs) have been revised to reflect the 2016 Census boundaries. Geography variables were revised back to 2016.
The industry and occupation classifications have also been updated. The CIS now uses the North American Industry Classification System (NAICS) 2017 V3.0 and the National Occupational Classification (NOC) 2016 V1.3. No revisions were required for the occupation variables, while industry variables were revised back to 2012.
This paper presents a summary of the changes to national and provincial key estimates produced by CIS for the revised years. In Section 2, it briefly describes the geographic boundary changes. Section 3 discusses the impact of the rebasing on population counts for individuals, households and economic families. Section 4 deals with the corresponding impact on the main survey estimates (e.g., family type, income, low income and poverty estimates). Lastly, tables and charts comparing revised and unrevised estimates by province are provided for reference.
2. Geographic boundary changes
Changes to the Standard Geographical Classification (SGC) introduced in conjunction with the 2016 Census resulted in the modification of boundaries for some of the sub-provincial areas such as census metropolitan areas (CMA), economic regions (ER), and census agglomerations (CA).
Two CAs became CMAs: Belleville, Ontario; and Lethbridge, Alberta. As well, 11 existing CMAs had boundary modifications between the 2011 SGC and the 2016 SGC. These are: Moncton and Saint John (New Brunswick); Saguenay, Québec, Montréal (Quebec) and Ottawa-Gatineau (Quebec part); Ottawa-Gatineau (Ontario part), Kitchener-Cambridge-Waterloo and Greater Sudbury (Ontario); and Regina and Saskatoon (Saskatchewan).
The most significant change to the existing CMA boundaries was that the Montréal CMA now includes the CA of Saint-Jean-sur-Richelieu.
As a result of the move to the 2016 SGC , there were small boundary changes for two ERs: South Central and Southeast in Manitoba.
CIS geography variables were revised for the reference years 2016 to 2019.
3. Impact on population counts
Using the population estimates based on the 2016 Census produced by Statistics Canada’s Centre for Demography, the CIS control totals for reference years 2012 to 2019 were revised. Overall, at the Canada level, the population estimates were revised downward or remained unchanged for all years (Table 3.1). The largest difference between the revised and unrevised population count occurred in 2015 (down 0.5%), followed by more modest decreases in 2014 and 2016 (both down 0.3%).
3.1 Provincial
At the provincial level, British Columbia experienced the largest differences between revised and unrevised population estimates, with increases ranging from 0.8% in 2012 to 3.3% in 2018. Newfoundland and Labrador (0.5%, on average), New Brunswick (1.1%, on average) and Manitoba (0.4%, on average) also had their population estimates revised upwards over the revision period. Conversely, the largest decreases between unrevised and revised population counts were for Alberta, where population estimates were down 1.9% in both 2015 and 2016 (down 1.4%, on average). Quebec and Ontario also had their population estimates revised downwards, with decreases of 0.8% and 0.5% respectively, on average, over the revision period.
| 2012 | 2013 | 2014 | 2015 | 2016 | 2017 | 2018 | 2019 | |
|---|---|---|---|---|---|---|---|---|
| Percentage change (%) | ||||||||
| Canada | -0.1 | -0.2 | -0.3 | -0.5 | -0.3 | -0.1 | 0.0 | -0.1 |
| Newfoundland and Labrador | -0.2 | 0.1 | 0.6 | 0.7 | 0.5 | 0.4 | 0.6 | 1.0 |
| Prince Edward Island | -0.8 | -1.2 | -1.4 | -1.2 | -0.2 | 0.5 | 0.7 | 0.4 |
| Nova Scotia | -0.2 | -0.4 | -0.6 | -0.8 | -0.5 | -0.3 | 0.0 | 0.0 |
| New Brunswick | 0.3 | 0.6 | 0.8 | 1.0 | 1.3 | 1.4 | 1.6 | 1.6 |
| Quebec | -0.5 | -0.7 | -1.0 | -1.3 | -1.2 | -0.9 | -0.5 | -0.6 |
| Ontario | -0.2 | -0.4 | -0.5 | -0.6 | -0.5 | -0.4 | -0.5 | -0.7 |
| Manitoba | 0.1 | 0.0 | -0.1 | 0.1 | 0.6 | 0.7 | 0.9 | 0.9 |
| Saskatchewan | 0.0 | -0.2 | -0.5 | -0.7 | -0.3 | -0.2 | 0.2 | 0.4 |
| Alberta | -0.6 | -0.8 | -1.3 | -1.9 | -1.9 | -1.7 | -1.6 | -1.7 |
| British Columbia | 0.8 | 1.4 | 2.1 | 2.2 | 2.5 | 2.9 | 3.3 | 3.2 |
| Source: Statistics Canada, Centre for Demography. Custom tabulation. | ||||||||
3.2 Household sizes
In terms of household size, both the smallest household size (i.e., one person households) and largest household size (i.e., three or more person households) had similar upward revisions, averaging about 1.8% and 1.9%, respectively, over the revision period (Table 3.2). In contrast, the number of two-person households was revised downward, with relatively larger deceases ranging from 1.5% in 2012 to 5.8% in 2019. Over the revision period, the number of two person households was revised downwards by 4.2%, on average.
| 2012 | 2013 | 2014 | 2015 | 2016 | 2017 | 2018 | 2019 | |
|---|---|---|---|---|---|---|---|---|
| Percentage change (%) | ||||||||
| Households with 1 person | 0.4 | 0.8 | 1.0 | 1.2 | 1.8 | 2.9 | 3.2 | 3.2 |
| Households with 2 persons | -1.5 | -2.4 | -3.4 | -4.6 | -5.1 | -5.1 | -5.3 | -5.8 |
| Households with 3 or more persons | 0.6 | 1.1 | 1.5 | 1.9 | 2.2 | 2.7 | 2.7 | 2.4 |
| Source: Statistics Canada, Centre for Demography. Custom tabulation. | ||||||||
3.3 Economic family sizes
A similar trend was observed in the revisions to the number of economic families. The number of unattached individuals (i.e., persons not in an economic family) and largest family size (i.e., economic families with 3 or more persons) had upward revisions averaging around 2.8% and 1.5%, respectively, over the entire revision period (Table 3.3). Unattached individuals experienced the largest upward annual revisions, with 4.8% for both 2018 and 2019. Again, similar to the revisions to the number of households, the number of economic families with two persons was revised downward. On average, over the revision period, this family size was revised downward by about 4.0%, with 2019 having the largest downward annual revision at 5.8%.
| 2012 | 2013 | 2014 | 2015 | 2016 | 2017 | 2018 | 2019 | |
|---|---|---|---|---|---|---|---|---|
| Percentage change (%) | ||||||||
| Persons not in an economic family | 0.7 | 1.2 | 1.6 | 1.8 | 2.8 | 4.3 | 4.8 | 4.8 |
| Economic families with 2 persons | -1.4 | -2.2 | -3.1 | -4.3 | -4.8 | -5.0 | -5.3 | -5.8 |
| Economic families with 3 or more persons | 0.5 | 1.0 | 1.3 | 1.5 | 1.7 | 2.0 | 2.0 | 1.7 |
| Source: Statistics Canada, Centre for Demography. Custom tabulation. | ||||||||
4. Impact on survey estimates
Since the survey weights in CIS are calibrated to population estimates, updates to population control totals will have an impact on CIS survey estimates. Consequentially, the CIS estimates for the full period from 2012 to 2019 have been revised. In this section, impacts on population estimates by economic family type, on income estimates as well as on poverty and low-income estimates will be described. Since the CIS estimates are based on a probability sample, unrevised (2011 Census-based) and revised (2016 Census-based) estimates, as well as the differences between them are all subject to sampling error. Differences statistically significant at a 95% level of confidence have been identified. Finally, to simplify the presentation of tables, this analysis will focus on three representative years over the revision period: 2013, 2016 and 2019.
4.1 Population estimates
At the Canada level, most of the differences between the revised and unrevised population estimates are statistically significant. In general, the larger economic family types tended to experience smaller changes between the revised and unrevised data (Table 4.1). Additionally, larger differences occurred in the most recent reference years, which are further from the previous Census year. Comparing the population revisions for the two broader categories, “economic families” and “persons not in an economic family”, the estimated number of persons living in an economic family had downward changes (largest downward revision was 1.0% in 2019), while the number of persons not in an economic family had relatively larger upward revisions (largest upward revision was 4.8% in 2019).
Within the “economic families” category, downward population revisions were largely driven by couples, both senior and non-senior (down 6.7% and 6.8% in 2019, respectively). For persons not in an economic family, all categories were revised upward. Although a relatively small category, senior men not in an economic family had the largest upward revisions, peaking at 9.4% in 2019.
| 2013 | 2016 | 2019 | |||||||
|---|---|---|---|---|---|---|---|---|---|
| Unrevised | Revised | Change | Unrevised | Revised | Change | Unrevised | Revised | Change | |
| ('000) | % | ('000) | % | ('000) | % | ||||
| Economic families and persons not in an economic family | 34,367 | 34,286 | -0.2Note * | 35,436 | 35,322 | -0.3Note * | 36,858 | 36,831 | -0.1Note * |
| Economic families | 28,998 | 28,852 | -0.5Note * | 29,848 | 29,577 | -0.9Note * | 31,004 | 30,696 | -1.0Note * |
| Senior families | 3,794 | 3,740 | -1.4Note * | 4,102 | 3,965 | -3.3Note * | 4,610 | 4,426 | -4.0Note * |
| Senior couples | 2,729 | 2,664 | -2.4Note * | 3,023 | 2,890 | -4.4Note * | 3,303 | 3,082 | -6.7Note * |
| Other senior families | 1,064 | 1,076 | 1.1 | 1,078 | 1,075 | -0.3 | 1,307 | 1,344 | 2.8Note * |
| Non-senior families | 25,204 | 25,112 | -0.4Note * | 25,746 | 25,611 | -0.5Note * | 26,394 | 26,270 | -0.5Note * |
| Couples | 4,517 | 4,413 | -2.3Note * | 4,685 | 4,434 | -5.4Note * | 4,841 | 4,512 | -6.8Note * |
| Couples with children | 12,330 | 12,370 | 0.3Note * | 12,563 | 12,697 | 1.1Note * | 12,808 | 12,910 | 0.8Note * |
| Couples with other relatives | 3,834 | 3,809 | -0.7Note * | 4,011 | 4,006 | -0.1 | 4,106 | 4,157 | 1.2 |
| Lone-parent families | 1,696 | 1,741 | 2.7Note * | 1,756 | 1,794 | 2.2Note * | 1,667 | 1,677 | 0.6 |
| Male lone-parent families | 319 | 326 | 2.2 | 319 | 334 | 4.7 | 343 | 355 | 3.5 |
| Female lone-parent families | 1,377 | 1,415 | 2.8Note * | 1,436 | 1,460 | 1.7Note * | 1,324 | 1,322 | -0.2 |
| Other non-senior families | 2,827 | 2,778 | -1.7Note * | 2,731 | 2,679 | -1.9Note * | 2,973 | 3,013 | 1.3 |
| Persons not in an economic family | 5,369 | 5,434 | 1.2Note * | 5,588 | 5,745 | 2.8Note * | 5,854 | 6,135 | 4.8Note * |
| Seniors not in an economic family | 1,445 | 1,460 | 1.0Note * | 1,560 | 1,608 | 3.1Note * | 1,847 | 1,944 | 5.3Note * |
| Senior males not in an economic family | 457 | 468 | 2.4Note * | 497 | 525 | 5.6Note * | 627 | 686 | 9.4Note * |
| Senior females not in an economic family | 988 | 992 | 0.4Note * | 1,062 | 1,083 | 2.0Note * | 1,220 | 1,258 | 3.1Note * |
| Non-seniors not in an economic family | 3,924 | 3,974 | 1.3Note * | 4,028 | 4,137 | 2.7Note * | 4,006 | 4,191 | 4.6Note * |
| Non-senior males not in an economic family | 2,236 | 2,257 | 0.9Note * | 2,266 | 2,319 | 2.3Note * | 2,194 | 2,289 | 4.3Note * |
| Non-senior females not in an economic family | 1,688 | 1,717 | 1.7Note * | 1,762 | 1,818 | 3.2Note * | 1,812 | 1,902 | 5.0Note * |
|
|||||||||
At the provincial level, overall, British Columbia had the largest upward revisions (up 3.2% in 2019), mostly driven by non-seniors not in an economic family (up 12.1% in 2019)Note . In Alberta, which had the largest downward revisions (down 1.7% in 2019), non-senior couples and non-seniors not in an economic family contributed the most to the downward revisions (down 14.2% and 6.7% in 2019, respectively). In general, population estimates for those living in an economic family tended to have smaller changes than population estimates for persons not in an economic family, although there are a few exceptions. For example, senior and non-senior couples tended to have relatively large revisions in many provinces.
4.2 Income estimates
At the Canada level, overall, the median CIS income estimates were either revised downward or remained relatively unchanged (Table 4.2). In 2019, median income tax had the largest downward revision at 2.6%, while median total income (down 1.7%), after-tax income (down 1.6%) and market income (down 1.9%) all had similar average downward revisions.
For the broad category of economic families, income estimates were in general revised upwards in 2016, with the exception of government transfers, while they were little changed in 2019. For persons not living in an economic family, most estimates were relatively unchanged in 2013 and 2016, but there tended to be upward revisions in 2019.
| 2013 | 2016 | 2019 | |||||||
|---|---|---|---|---|---|---|---|---|---|
| Unrevised | Revised | Change | Unrevised | Revised | Change | Unrevised | Revised | Change | |
| 2019 constant dollars |
% | 2019 constant dollars |
% | 2019 constant dollars |
% | ||||
| Median market income | |||||||||
| Economic families and persons not in an economic family | 55,500 | 55,400 | -0.2 | 55,400 | 55,100 | -0.5Note * | 58,300 | 57,200 | -1.9Note * |
| Economic families | 80,900 | 81,100 | 0.2 | 81,400 | 82,100 | 0.9Note * | 85,600 | 86,000 | 0.5 |
| Persons not in an economic family | 25,800 | 26,000 | 0.8Note * | 25,200 | 25,400 | 0.8 | 27,200 | 26,600 | -2.2Note * |
| Median government transfers | |||||||||
| Economic families and persons not in an economic family | 5,700 | 5,700 | 0.0 | 7,800 | 7,700 | -1.3Note * | 8,200 | 8,100 | -1.2 |
| Economic families | 7,800 | 7,700 | -1.3Note * | 9,500 | 9,400 | -1.1 | 9,900 | 9,800 | -1.0 |
| Persons not in an economic family | 1,600 | 1,600 | 0.0 | 1,800 | 1,800 | 0.0 | 2,800 | 2,800 | 0.0 |
| Median total income | |||||||||
| Economic families and persons not in an economic family | 66,400 | 66,300 | -0.2Note * | 67,700 | 67,200 | -0.7Note * | 71,200 | 70,000 | -1.7Note * |
| Economic families | 92,100 | 92,300 | 0.2Note * | 94,600 | 95,100 | 0.5Note * | 99,100 | 99,300 | 0.2 |
| Persons not in an economic family | 34,300 | 34,500 | 0.6 | 33,300 | 33,300 | 0.0 | 35,700 | 35,100 | -1.7Note * |
| Median income tax | |||||||||
| Economic families and persons not in an economic family | 7,100 | 7,100 | 0.0 | 7,000 | 6,900 | -1.4 | 7,600 | 7,400 | -2.6Note * |
| Economic families | 10,900 | 11,000 | 0.9Note * | 11,300 | 11,500 | 1.8Note * | 12,200 | 12,200 | 0.0 |
| Persons not in an economic family | 2,700 | 2,700 | 0.0 | 2,400 | 2,500 | 4.2 | 2,800 | 2,600 | -7.1Note * |
| Median after-tax income | |||||||||
| Economic families and persons not in an economic family | 58,800 | 58,700 | -0.2Note * | 60,400 | 59,900 | -0.8Note * | 62,900 | 61,900 | -1.6Note * |
| Economic families | 80,300 | 80,400 | 0.1 | 83,100 | 83,600 | 0.6Note * | 86,700 | 86,800 | 0.1 |
| Persons not in an economic family | 31,200 | 31,300 | 0.3 | 30,600 | 30,700 | 0.3 | 32,200 | 31,900 | -0.9 |
|
|||||||||
Most provinces tended to have their median incomes revised downwardsNote . Prince Edward Island and British Columbia had relatively large downward revisions to their median after-tax income estimates in 2019, down 5.8% and 4.7% respectively. Four other provinces also had downward revisions to their after-tax median income estimates in 2019: New Brunswick (down 3.5%), Quebec (down 1.1%), Ontario (down 3.0%) and Manitoba (down 1.8%). Saskatchewan and Alberta had their median after-tax income estimates revised upwards in 2019, by 2.1% and 1.9%, respectively.
At the Canada level, the overall impact on the income estimates was relatively small and did not change the historical trends. As can be seen on Charts 4.1 to 4.3, the revised median after-tax income and market income series for the overall category of economic families and persons not in an economic family were lower than the unrevised series, while it was the opposite for economic families. Given that the income series were little changed for persons not in an economic family, the impact of the revision on the overall category may appear counterintuitive. This can be explained by the fact that the revisions led to changes in the composition of the population. As mentioned in section 4.1, the number of persons not in an economic family was revised upward, while the number of persons in economic families was revised downward. Consequently, since persons not in an economic family generally have lower incomes than economic families, the income series for the overall category were revised downward.

Data table for Chart 4.1
| Year | Unrevised median after-tax income | Revised median after-tax income | Unrevised median market income | Revised median market income |
|---|---|---|---|---|
| 2019 constant dollars | ||||
| 2012 | 58,500 | 58,400 | 55,200 | 55,200 |
| 2013 | 58,800 | 58,700 | 55,500 | 55,400 |
| 2014 | 60,400 | 60,100 | 56,600 | 56,500 |
| 2015 | 60,200 | 60,000 | 56,000 | 55,900 |
| 2016 | 60,400 | 59,900 | 55,400 | 55,100 |
| 2017 | 62,100 | 61,400 | 56,700 | 55,900 |
| 2018 | 62,600 | 61,600 | 58,200 | 57,100 |
| 2019 | 62,900 | 61,900 | 58,300 | 57,200 |
| Source: Statistics Canada, Canadian Income Survey. Table 11-10-0190-01. | ||||
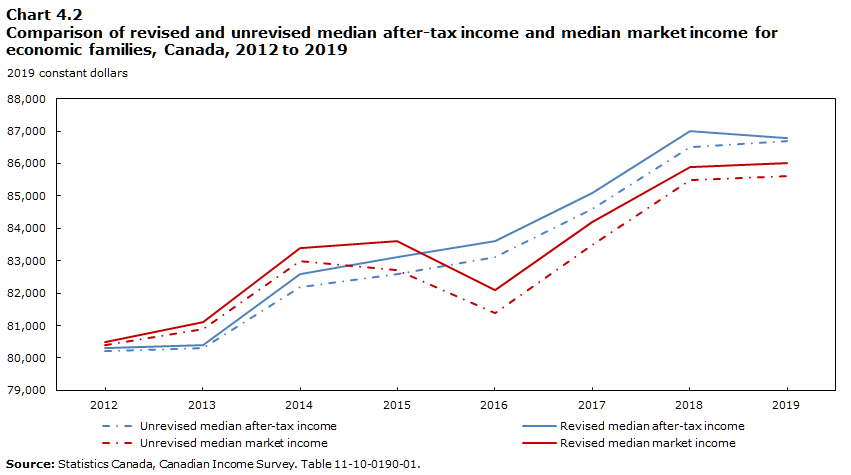
Data table for Chart 4.2
| Year | Unrevised median after-tax income | Revised median after-tax income | Unrevised median market income | Revised median market income |
|---|---|---|---|---|
| 2019 constant dollars | ||||
| 2012 | 80,200 | 80,300 | 80,400 | 80,500 |
| 2013 | 80,300 | 80,400 | 80,900 | 81,100 |
| 2014 | 82,200 | 82,600 | 83,000 | 83,400 |
| 2015 | 82,600 | 83,100 | 82,700 | 83,600 |
| 2016 | 83,100 | 83,600 | 81,400 | 82,100 |
| 2017 | 84,600 | 85,100 | 83,500 | 84,200 |
| 2018 | 86,500 | 87,000 | 85,500 | 85,900 |
| 2019 | 86,700 | 86,800 | 85,600 | 86,000 |
| Source: Statistics Canada, Canadian Income Survey. Table 11-10-0190-01. | ||||
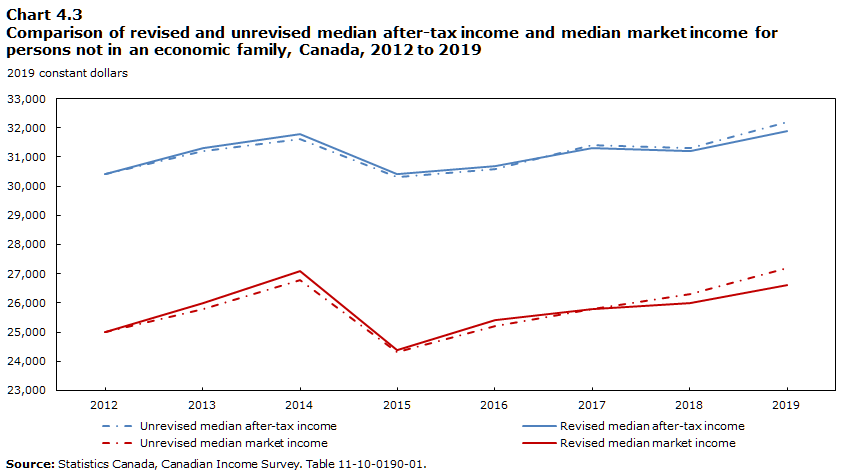
Data table for Chart 4.3
| Year | Unrevised median after-tax income | Revised median after-tax income | Unrevised median market income | Revised median market income |
|---|---|---|---|---|
| 2019 constant dollars | ||||
| 2012 | 30,400 | 30,400 | 25,000 | 25,000 |
| 2013 | 31,200 | 31,300 | 25,800 | 26,000 |
| 2014 | 31,600 | 31,800 | 26,800 | 27,100 |
| 2015 | 30,300 | 30,400 | 24,300 | 24,400 |
| 2016 | 30,600 | 30,700 | 25,200 | 25,400 |
| 2017 | 31,400 | 31,300 | 25,800 | 25,800 |
| 2018 | 31,300 | 31,200 | 26,300 | 26,000 |
| 2019 | 32,200 | 31,900 | 27,200 | 26,600 |
| Source: Statistics Canada, Canadian Income Survey. Table 11-10-0190-01. | ||||
4.3 Poverty and low Income
The revisions to population and income estimates resulting from the population rebasing also had an impact on the poverty and low-income estimates. Poverty estimates are based on the Market Basket Measure (MBM)Note , while low-income estimates are based on the low income measure after-tax (LIM-AT). The MBM establishes poverty thresholds based on the cost of a basket of food, clothing, shelter, transportation and other necessities. Persons whose family disposable income is less than the applicable thresholds, given their family size and region of residence, are deemed to be in poverty. The LIM-AT defines an individual as being in low income if their household after-tax income is less than half of the median income of all households in Canada, adjusted for household sizeNote .
| 2013 | 2016 | 2019 | |||||||
|---|---|---|---|---|---|---|---|---|---|
| Unrevised | Revised | Change | Unrevised | Revised | Change | Unrevised | Revised | Change | |
| % | p.p. | % | p.p. | % | p.p. | ||||
| Percentage of persons in poverty or low income | |||||||||
| Poverty rate (2018-base MBM) | Note ..: not available for a specific reference period | Note ..: not available for a specific reference period | Note ..: not available for a specific reference period | 12.8 | 12.9 | 0.1 | 10.1 | 10.3 | 0.2Note * |
| Poverty rate (2008-base MBM) | 12.1 | 12.1 | 0.0 | 10.6 | 10.6 | 0.0 | 8.2 | 8.3 | 0.1 |
| Low-income rate (LIM-AT) | 13.4 | 13.4 | 0.0 | 13.0 | 13.0 | 0.0 | 12.1 | 12.1 | 0.0 |
Source: Statistics Canada, Canadian Income Survey. Table 11-10-0135-01. |
|||||||||
Overall, the revisions to these poverty and low-income statistics were small. The only statistically significant change at the Canada level, for all persons, was the 2018-base MBM poverty rate for 2019 (Table 4.3), with a slight increase of 0.2 percentage points. With the exception of Prince Edward Island, which experienced larger changes, most of the statistically significant changes to the provincial poverty and low-income rates were below one percentage point, which reflects the generally modest revisionsNote .

Data table for Chart 4.4
| Year | 2008-base MBM - unrevised | 2018-base MBM - unrevised | LIM-AT - unrevised | 2008-base MBM - revised | 2018-base MBM - revised | LIM-AT - revised |
|---|---|---|---|---|---|---|
| percent | ||||||
| 2012 | 12.7 | Note ..: not available for a specific reference period | 13.7 | 12.7 | Note ..: not available for a specific reference period | 13.6 |
| 2013 | 12.1 | Note ..: not available for a specific reference period | 13.4 | 12.1 | Note ..: not available for a specific reference period | 13.4 |
| 2014 | 11.3 | Note ..: not available for a specific reference period | 13.0 | 11.3 | Note ..: not available for a specific reference period | 13.0 |
| 2015 | 12.1 | 14.5 | 14.2 | 12.1 | 14.5 | 14.3 |
| 2016 | 10.6 | 12.8 | 13.0 | 10.6 | 12.9 | 13.0 |
| 2017 | 9.5 | 11.7 | 12.6 | 9.7 | 11.9 | 12.6 |
| 2018 | 8.7 | 11.0 | 12.3 | 9.0 | 11.2 | 12.4 |
| 2019 | 8.2 | 10.1 | 12.1 | 8.3 | 10.3 | 12.1 |
|
.. not available for a specific reference period Source: Statistics Canada, Canadian Income Survey. Table 11-10-0135-01. |
||||||
In Prince Edward Island, there were statistically significant increases to the three poverty and low-income rates for 2019. For that year, all three rates increased by 1.4 percentage points as a result of the revisions. For 2016, although increases were larger in magnitude (around 2.0 p.p.), they are not statistically significant due to higher sampling variability at the timeNote .
In British Columbia, the three poverty and low-income rates were higher after the revisions in 2016 and 2019. Poverty rates were up by about 1.0 percentage point in 2019, while the low-income rate was up by 0.7 percentage points.
All three rates were higher after the revisions in Newfoundland and Labrador in 2019, as well as in New Brunswick in 2016. All three rates were lower after the revisions in only two provinces, Saskatchewan and Alberta, in 2016.
5. References
Djidel, Samir, Burton Gustajtis, Andrew Heisz, Keith Lam, Isabelle Marchand and Sarah McDermott (2020), “Report on the second comprehensive review of the Market Basket Measure”. Catalogue no. 75F0002M2020002.
Statistics Canada (2021). Improvements to the Labour Force Survey (LFS), “The 2021 Revisions of the Labour Force Survey (LFS)”. Catalogue no. 71F0031X. January 2021.
Statistics Canada (2019). “Coverage Technical Report, Census of Population 2016”, Catalogue no. 98-303-X. November 2019.
Statistics Canada (2016). “Population and Family Estimation Methods at Statistics Canada”. Catalogue no. 91-528-X. March 2016.
Tremblay, J. (2005). “Aperçu de la stratégie de calage harmonisée des statistiques du revenu de Statistique Canada”. Proceedings of the Survey Methods Section of the Annual Meeting of the Statistical Society of Canada, June 2005.
6. Charts

Data table for Chart 6.1
| Year | 2008-base MBM - unrevised | 2018-base MBM - unrevised | LIM-AT - unrevised | 2008-base MBM - revised | 2018-base MBM - revised | LIM-AT - revised |
|---|---|---|---|---|---|---|
| percent | ||||||
| 2012 | 11.1 | Note ..: not available for a specific reference period | 13.4 | 11.3 | Note ..: not available for a specific reference period | 13.6 |
| 2013 | 12.0 | Note ..: not available for a specific reference period | 12.8 | 11.9 | Note ..: not available for a specific reference period | 12.9 |
| 2014 | 11.6 | Note ..: not available for a specific reference period | 14.4 | 11.5 | Note ..: not available for a specific reference period | 14.6 |
| 2015 | 12.1 | 13.1 | 15.4 | 12.1 | 13.0 | 15.9 |
| 2016 | 10.8 | 12.4 | 15.6 | 10.8 | 12.2 | 15.8 |
| 2017 | 9.7 | 11.4 | 15.0 | 9.6 | 11.3 | 15.0 |
| 2018 | 9.7 | 11.2 | 16.0 | 9.8 | 11.4 | 16.1 |
| 2019 | 8.2 | 10.7 | 14.7 | 8.8 | 11.2 | 15.6 |
|
.. not available for a specific reference period Source: Statistics Canada, Canadian Income Survey. Table 11-10-0135-01. |
||||||

Data table for Chart 6.2
| Year | 2008-base MBM - unrevised | 2018-base MBM - unrevised | LIM-AT - unrevised | 2008-base MBM - revised | 2018-base MBM - revised | LIM-AT - revised |
|---|---|---|---|---|---|---|
| percent | ||||||
| 2012 | 12.9 | Note ..: not available for a specific reference period | 13.1 | 12.9 | Note ..: not available for a specific reference period | 13.3 |
| 2013 | 15.7 | Note ..: not available for a specific reference period | 15.7 | 15.6 | Note ..: not available for a specific reference period | 15.7 |
| 2014 | 10.7 | Note ..: not available for a specific reference period | 12.5 | 11.2 | Note ..: not available for a specific reference period | 13.0 |
| 2015 | 14.0 | 14.8 | 15.9 | 14.5 | 15.7 | 16.8 |
| 2016 | 11.3 | 11.8 | 14.4 | 13.3 | 13.9 | 16.3 |
| 2017 | 10.1 | 13.3 | 14.4 | 12.3 | 15.4 | 16.4 |
| 2018 | 9.1 | 11.9 | 14.6 | 10.5 | 13.4 | 16.1 |
| 2019 | 7.9 | 10.9 | 14.4 | 9.3 | 12.3 | 15.8 |
|
.. not available for a specific reference period Source: Statistics Canada, Canadian Income Survey. Table 11-10-0135-01. |
||||||
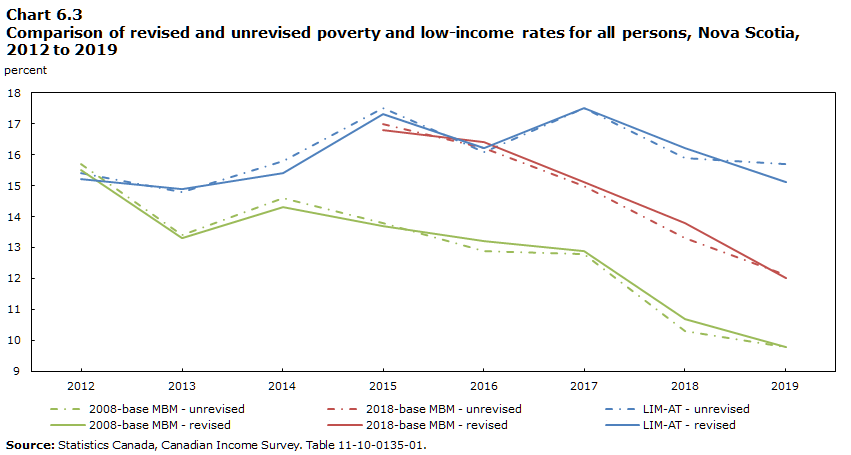
Data table for Chart 6.3
| Year | 2008-base MBM - unrevised | 2018-base MBM - unrevised | LIM-AT - unrevised | 2008-base MBM - revised | 2018-base MBM - revised | LIM-AT - revised |
|---|---|---|---|---|---|---|
| percent | ||||||
| 2012 | 15.7 | Note ..: not available for a specific reference period | 15.4 | 15.5 | Note ..: not available for a specific reference period | 15.2 |
| 2013 | 13.4 | Note ..: not available for a specific reference period | 14.8 | 13.3 | Note ..: not available for a specific reference period | 14.9 |
| 2014 | 14.6 | Note ..: not available for a specific reference period | 15.8 | 14.3 | Note ..: not available for a specific reference period | 15.4 |
| 2015 | 13.8 | 17.0 | 17.5 | 13.7 | 16.8 | 17.3 |
| 2016 | 12.9 | 16.2 | 16.1 | 13.2 | 16.4 | 16.2 |
| 2017 | 12.8 | 15.0 | 17.5 | 12.9 | 15.1 | 17.5 |
| 2018 | 10.3 | 13.3 | 15.9 | 10.7 | 13.8 | 16.2 |
| 2019 | 9.8 | 12.1 | 15.7 | 9.8 | 12.0 | 15.1 |
|
.. not available for a specific reference period Source: Statistics Canada, Canadian Income Survey. Table 11-10-0135-01. |
||||||

Data table for Chart 6.4
| Year | 2008-base MBM - unrevised | 2018-base MBM - unrevised | LIM-AT - unrevised | 2008-base MBM - revised | 2018-base MBM - revised | LIM-AT - revised |
|---|---|---|---|---|---|---|
| percent | ||||||
| 2012 | 14.2 | Note ..: not available for a specific reference period | 16.1 | 14.2 | Note ..: not available for a specific reference period | 16.1 |
| 2013 | 12.9 | Note ..: not available for a specific reference period | 14.7 | 12.8 | Note ..: not available for a specific reference period | 14.5 |
| 2014 | 12.3 | Note ..: not available for a specific reference period | 15.9 | 12.4 | Note ..: not available for a specific reference period | 16.0 |
| 2015 | 14.0 | 16.1 | 16.9 | 14.1 | 16.2 | 17.1 |
| 2016 | 11.8 | 13.6 | 14.7 | 12.1 | 13.9 | 15.0 |
| 2017 | 9.7 | 12.1 | 15.0 | 10.2 | 12.6 | 15.5 |
| 2018 | 7.9 | 10.0 | 13.8 | 8.5 | 10.8 | 14.2 |
| 2019 | 7.8 | 9.4 | 14.9 | 8.1 | 9.9 | 15.3 |
|
.. not available for a specific reference period Source: Statistics Canada, Canadian Income Survey. Table 11-10-0135-01. |
||||||
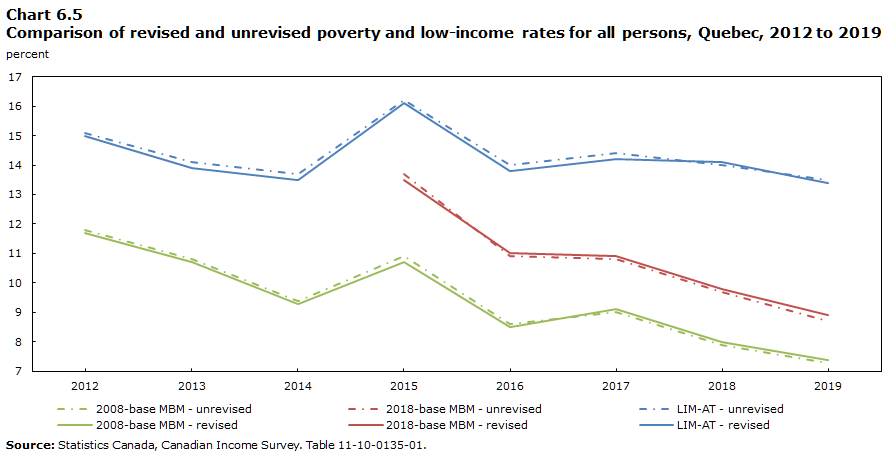
Data table for Chart 6.5
| Year | 2008-base MBM - unrevised | 2018-base MBM - unrevised | LIM-AT - unrevised | 2008-base MBM - revised | 2018-base MBM - revised | LIM-AT - revised |
|---|---|---|---|---|---|---|
| percent | ||||||
| 2012 | 11.8 | Note ..: not available for a specific reference period | 15.1 | 11.7 | Note ..: not available for a specific reference period | 15.0 |
| 2013 | 10.8 | Note ..: not available for a specific reference period | 14.1 | 10.7 | Note ..: not available for a specific reference period | 13.9 |
| 2014 | 9.4 | Note ..: not available for a specific reference period | 13.7 | 9.3 | Note ..: not available for a specific reference period | 13.5 |
| 2015 | 10.9 | 13.7 | 16.2 | 10.7 | 13.5 | 16.1 |
| 2016 | 8.6 | 10.9 | 14.0 | 8.5 | 11.0 | 13.8 |
| 2017 | 9.0 | 10.8 | 14.4 | 9.1 | 10.9 | 14.2 |
| 2018 | 7.9 | 9.7 | 14.0 | 8.0 | 9.8 | 14.1 |
| 2019 | 7.3 | 8.7 | 13.5 | 7.4 | 8.9 | 13.4 |
|
.. not available for a specific reference period Source: Statistics Canada, Canadian Income Survey. Table 11-10-0135-01. |
||||||
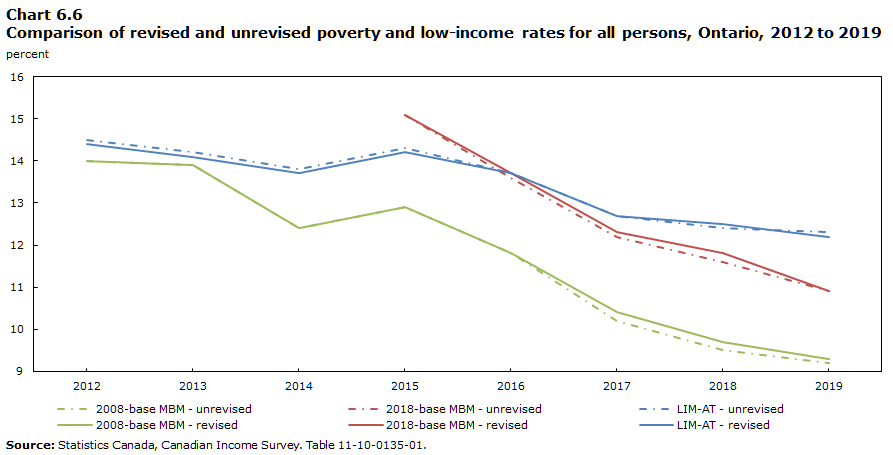
Data table for Chart 6.6
| Year | 2008-base MBM - unrevised | 2018-base MBM - unrevised | LIM-AT - unrevised | 2008-base MBM - revised | 2018-base MBM - revised | LIM-AT - revised |
|---|---|---|---|---|---|---|
| percent | ||||||
| 2012 | 14.0 | Note ..: not available for a specific reference period | 14.5 | 14.0 | Note ..: not available for a specific reference period | 14.4 |
| 2013 | 13.9 | Note ..: not available for a specific reference period | 14.2 | 13.9 | Note ..: not available for a specific reference period | 14.1 |
| 2014 | 12.4 | Note ..: not available for a specific reference period | 13.8 | 12.4 | Note ..: not available for a specific reference period | 13.7 |
| 2015 | 12.9 | 15.1 | 14.3 | 12.9 | 15.1 | 14.2 |
| 2016 | 11.8 | 13.6 | 13.7 | 11.8 | 13.7 | 13.7 |
| 2017 | 10.2 | 12.2 | 12.7 | 10.4 | 12.3 | 12.7 |
| 2018 | 9.5 | 11.6 | 12.4 | 9.7 | 11.8 | 12.5 |
| 2019 | 9.2 | 10.9 | 12.3 | 9.3 | 10.9 | 12.2 |
|
.. not available for a specific reference period Source: Statistics Canada, Canadian Income Survey. Table 11-10-0135-01. |
||||||
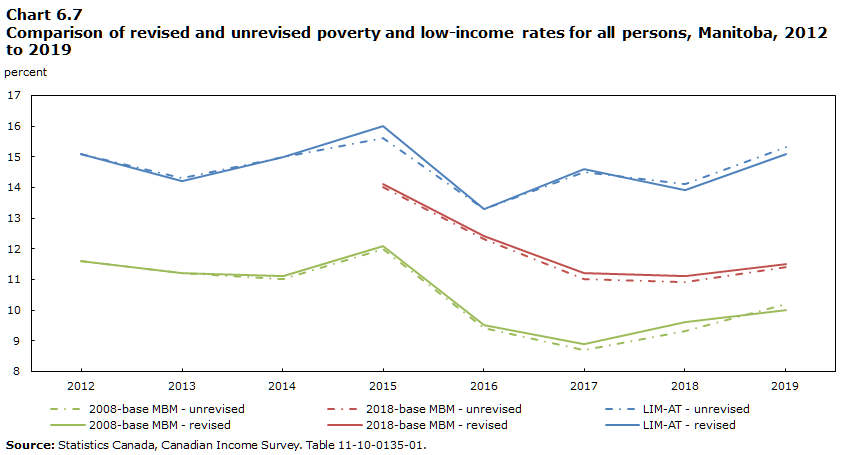
Data table for Chart 6.7
| Year | 2008-base MBM - unrevised | 2018-base MBM - unrevised | LIM-AT - unrevised | 2008-base MBM - revised | 2018-base MBM - revised | LIM-AT - revised |
|---|---|---|---|---|---|---|
| percent | ||||||
| 2012 | 11.6 | Note ..: not available for a specific reference period | 15.1 | 11.6 | Note ..: not available for a specific reference period | 15.1 |
| 2013 | 11.2 | Note ..: not available for a specific reference period | 14.3 | 11.2 | Note ..: not available for a specific reference period | 14.2 |
| 2014 | 11.0 | Note ..: not available for a specific reference period | 15.0 | 11.1 | Note ..: not available for a specific reference period | 15.0 |
| 2015 | 12.0 | 14.0 | 15.6 | 12.1 | 14.1 | 16.0 |
| 2016 | 9.4 | 12.3 | 13.3 | 9.5 | 12.4 | 13.3 |
| 2017 | 8.7 | 11.0 | 14.5 | 8.9 | 11.2 | 14.6 |
| 2018 | 9.3 | 10.9 | 14.1 | 9.6 | 11.1 | 13.9 |
| 2019 | 10.2 | 11.4 | 15.3 | 10.0 | 11.5 | 15.1 |
|
.. not available for a specific reference period Source: Statistics Canada, Canadian Income Survey. Table 11-10-0135-01. |
||||||

Data table for Chart 6.8
| Year | 2008-base MBM - unrevised | 2018-base MBM - unrevised | LIM-AT - unrevised | 2008-base MBM - revised | 2018-base MBM - revised | LIM-AT - revised |
|---|---|---|---|---|---|---|
| rate (%) | ||||||
| 2012 | 10.3 | Note ..: not available for a specific reference period | 12.4 | 10.3 | Note ..: not available for a specific reference period | 12.4 |
| 2013 | 10.2 | Note ..: not available for a specific reference period | 12.6 | 10.1 | Note ..: not available for a specific reference period | 12.5 |
| 2014 | 10.3 | Note ..: not available for a specific reference period | 12.2 | 10.0 | Note ..: not available for a specific reference period | 12.0 |
| 2015 | 10.7 | 12.7 | 12.6 | 10.3 | 12.2 | 12.4 |
| 2016 | 9.2 | 11.5 | 11.6 | 8.8 | 11.1 | 11.4 |
| 2017 | 9.5 | 12.2 | 13.0 | 9.2 | 11.9 | 12.8 |
| 2018 | 8.8 | 11.2 | 13.0 | 8.4 | 10.8 | 12.9 |
| 2019 | 9.2 | 12.4 | 13.5 | 8.6 | 11.9 | 13.1 |
|
.. not available for a specific reference period Source: Statistics Canada, Canadian Income Survey. Table 11-10-0135-01. |
||||||

Data table for Chart 6.9
| Year | 2008-base MBM - unrevised | 2018-base MBM - unrevised | LIM-AT - unrevised | 2008-base MBM - revised | 2018-base MBM - revised | LIM-AT - revised |
|---|---|---|---|---|---|---|
| percent | ||||||
| 2012 | 7.8 | Note ..: not available for a specific reference period | 6.8 | 7.9 | Note ..: not available for a specific reference period | 6.8 |
| 2013 | 7.9 | Note ..: not available for a specific reference period | 7.8 | 8.2 | Note ..: not available for a specific reference period | 8.1 |
| 2014 | 8.3 | Note ..: not available for a specific reference period | 6.9 | 8.2 | Note ..: not available for a specific reference period | 6.9 |
| 2015 | 8.2 | 10.0 | 6.9 | 7.7 | 9.4 | 6.9 |
| 2016 | 8.6 | 10.8 | 8.1 | 8.0 | 10.1 | 7.4 |
| 2017 | 6.8 | 9.0 | 7.2 | 6.4 | 8.5 | 6.9 |
| 2018 | 7.3 | 9.4 | 7.5 | 6.9 | 8.8 | 7.1 |
| 2019 | 6.3 | 8.2 | 7.1 | 6.0 | 7.7 | 6.7 |
|
.. not available for a specific reference period Source: Statistics Canada, Canadian Income Survey. Table 11-10-0135-01. |
||||||
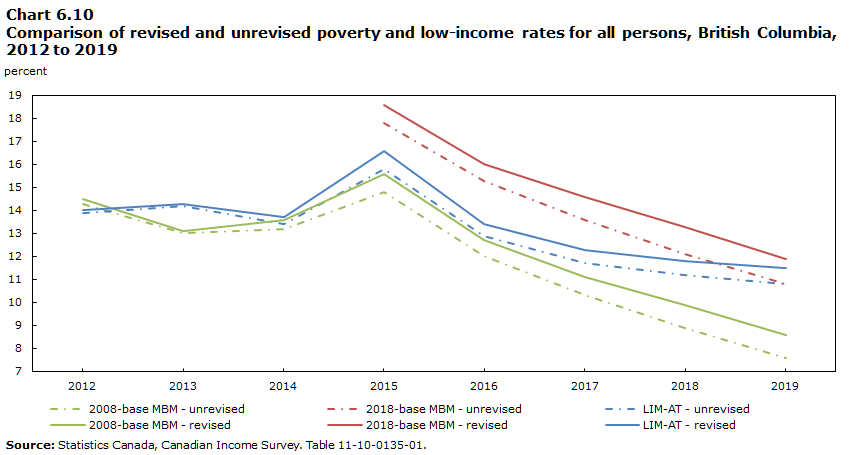
Data table for Chart 6.10
| Year | 2008-base MBM - unrevised | 2018-base MBM - unrevised | LIM-AT - unrevised | 2008-base MBM - revised | 2018-base MBM - revised | LIM-AT - revised |
|---|---|---|---|---|---|---|
| percent | ||||||
| 2012 | 14.3 | Note ..: not available for a specific reference period | 13.9 | 14.5 | Note ..: not available for a specific reference period | 14.0 |
| 2013 | 13.0 | Note ..: not available for a specific reference period | 14.2 | 13.1 | Note ..: not available for a specific reference period | 14.3 |
| 2014 | 13.2 | Note ..: not available for a specific reference period | 13.4 | 13.6 | Note ..: not available for a specific reference period | 13.7 |
| 2015 | 14.8 | 17.8 | 15.8 | 15.6 | 18.6 | 16.6 |
| 2016 | 12.0 | 15.3 | 12.9 | 12.7 | 16.0 | 13.4 |
| 2017 | 10.3 | 13.6 | 11.7 | 11.1 | 14.6 | 12.3 |
| 2018 | 8.9 | 12.1 | 11.2 | 9.9 | 13.3 | 11.8 |
| 2019 | 7.6 | 10.8 | 10.8 | 8.6 | 11.9 | 11.5 |
|
.. not available for a specific reference period Source: Statistics Canada, Canadian Income Survey. Table 11-10-0135-01. |
||||||
7. Tables
| 2013 | 2016 | 2019 | |||||||
|---|---|---|---|---|---|---|---|---|---|
| Unrevised | Revised | Change | Unrevised | Revised | Change | Unrevised | Revised | Change | |
| ('000) | % | ('000) | % | ('000) | % | ||||
| Economic families and persons not in an economic family | 520 | 520 | 0.0 | 519 | 522 | 0.6Note * | 511 | 516 | 1.0Note * |
| Economic families | 450 | 451 | 0.2Note * | 446 | 448 | 0.4Note * | 438 | 438 | 0.0 |
| Senior families | 70 | 70 | 0.0 | 73 | 72 | -1.4Note * | 90 | 91 | 1.1 |
| Senior couples | 55 | 55 | 0.0 | 59 | 58 | -1.7Note * | 66 | 63 | -4.5Note * |
| Other senior families | 15 | 15 | 0.0 | Note F: too unreliable to be published | Note F: too unreliable to be published | Note F: too unreliable to be published | 24 | 28 | 16.7Note * |
| Non-senior families | 380 | 381 | 0.3Note * | 373 | 376 | 0.8Note * | 348 | 347 | -0.3 |
| Couples | 87 | 87 | 0.0 | 86 | 84 | -2.3Note * | 77 | 75 | -2.6 |
| Couples with children | 165 | 166 | 0.6 | 152 | 154 | 1.3Note * | 151 | 148 | -2.0 |
| Couples with other relatives | 66 | 67 | 1.5 | 47 | 50 | 6.4Note * | 65 | 68 | 4.6 |
| Lone-parent families | 25 | 25 | 0.0 | 44 | 43 | -2.3Note * | 27 | 27 | 0.0 |
| Male lone-parent families | Note F: too unreliable to be published | Note F: too unreliable to be published | Note F: too unreliable to be published | Note F: too unreliable to be published | Note F: too unreliable to be published | Note F: too unreliable to be published | Note F: too unreliable to be published | Note F: too unreliable to be published | Note F: too unreliable to be published |
| Female lone-parent families | 20 | 20 | 0.0 | 40 | 39 | -2.5Note * | 22 | 22 | 0.0 |
| Other non-senior families | 36 | 36 | 0.0 | 45 | 46 | 2.2 | 29 | 29 | 0.0 |
| Persons not in an economic family | 70 | 70 | 0.0 | 73 | 74 | 1.4Note * | 73 | 78 | 6.8Note * |
| Seniors not in an economic family | 20 | 20 | 0.0 | 22 | 23 | 4.5Note * | 25 | 27 | 8.0Note * |
| Senior males not in an economic family | Note F: too unreliable to be published | Note F: too unreliable to be published | Note F: too unreliable to be published | 7 | 8 | 14.3Note * | 8 | 9 | 12.5Note * |
| Senior females not in an economic family | 14 | 14 | 0.0 | 15 | 15 | 0.0 | 18 | 18 | 0.0 |
| Non-seniors not in an economic family | 50 | 49 | -2.0Note * | 50 | 51 | 2.0 | 47 | 51 | 8.5Note * |
| Non-senior males not in an economic family | 28 | 28 | 0.0 | 29 | 29 | 0.0 | 26 | 28 | 7.7Note * |
| Non-senior females not in an economic family | 22 | 22 | 0.0 | 22 | 22 | 0.0 | 21 | 22 | 4.8Note * |
F too unreliable to be published
|
|||||||||
| 2013 | 2016 | 2019 | |||||||
|---|---|---|---|---|---|---|---|---|---|
| Unrevised | Revised | Change | Unrevised | Revised | Change | Unrevised | Revised | Change | |
| ('000) | % | ('000) | % | ('000) | % | ||||
| Economic families and persons not in an economic family | 143 | 142 | -0.7Note * | 146 | 146 | 0.0 | 155 | 156 | 0.6Note * |
| Economic families | 123 | 121 | -1.6Note * | 125 | 123 | -1.6Note * | 132 | 131 | -0.8Note * |
| Senior families | 19 | 19 | 0.0 | 25 | 23 | -8.0 | 22 | 22 | 0.0 |
| Senior couples | 13 | 13 | 0.0 | 15 | 14 | -6.7 | 16 | 16 | 0.0 |
| Other senior families | 5 | 6 | 20.0 | 10 | 9 | -10.0 | 6 | 6 | 0.0 |
| Non-senior families | 104 | 102 | -1.9Note * | 100 | 100 | 0.0 | 110 | 109 | -0.9Note * |
| Couples | 23 | 23 | 0.0 | 23 | 22 | -4.3 | 23 | 22 | -4.3Note * |
| Couples with children | 53 | 51 | -3.8Note * | 47 | 44 | -6.4 | 50 | 49 | -2.0 |
| Couples with other relatives | 15 | 15 | 0.0 | 16 | 15 | -6.3 | 15 | 15 | 0.0 |
| Lone-parent families | 7 | 8 | 14.3Note * | 7 | 11 | 57.1 | 9 | 10 | 11.1 |
| Male lone-parent families | Note F: too unreliable to be published | Note F: too unreliable to be published | Note F: too unreliable to be published | Note F: too unreliable to be published | Note F: too unreliable to be published | Note F: too unreliable to be published | Note F: too unreliable to be published | Note F: too unreliable to be published | Note F: too unreliable to be published |
| Female lone-parent families | 6 | 7 | 16.7 | 7 | 9 | 28.6 | 7 | 8 | 14.3 |
| Other non-senior families | 6 | 6 | 0.0 | 6 | 7 | 16.7 | 13 | 12 | -7.7 |
| Persons not in an economic family | 21 | 21 | 0.0 | 21 | 23 | 9.5Note * | 23 | 25 | 8.7Note * |
| Seniors not in an economic family | 6 | 7 | 16.7Note * | 6 | 7 | 16.7 | 7 | 8 | 14.3Note * |
| Senior males not in an economic family | Note F: too unreliable to be published | Note F: too unreliable to be published | Note F: too unreliable to be published | Note F: too unreliable to be published | Note F: too unreliable to be published | Note F: too unreliable to be published | 2 | 2 | 0.0 |
| Senior females not in an economic family | 4 | 4 | 0.0 | 4 | 5 | 25.0 | 5 | 5 | 0.0 |
| Non-seniors not in an economic family | 14 | 14 | 0.0 | 15 | 16 | 6.7 | 16 | 17 | 6.3Note * |
| Non-senior males not in an economic family | 8 | 8 | 0.0 | 8 | 9 | 12.5 | 8 | 9 | 12.5Note * |
| Non-senior females not in an economic family | 7 | 6 | -14.3 | 7 | 7 | 0.0 | 8 | 9 | 12.5 |
F too unreliable to be published
|
|||||||||
| 2013 | 2016 | 2019 | |||||||
|---|---|---|---|---|---|---|---|---|---|
| Unrevised | Revised | Change | Unrevised | Revised | Change | Unrevised | Revised | Change | |
| ('000) | % | ('000) | % | ('000) | % | ||||
| Economic families and persons not in an economic family | 913 | 910 | -0.3Note * | 921 | 916 | -0.5Note * | 946 | 946 | 0.0 |
| Economic families | 753 | 752 | -0.1Note * | 756 | 752 | -0.5Note * | 776 | 771 | -0.6Note * |
| Senior families | 120 | 120 | 0.0 | 146 | 145 | -0.7 | 144 | 142 | -1.4Note * |
| Senior couples | 86 | 85 | -1.2Note * | 99 | 96 | -3.0Note * | 109 | 106 | -2.8Note * |
| Other senior families | 34 | 35 | 2.9Note * | 47 | 48 | 2.1 | 35 | 36 | 2.9 |
| Non-senior families | 633 | 632 | -0.2Note * | 611 | 608 | -0.5Note * | 632 | 629 | -0.5Note * |
| Couples | 148 | 145 | -2.0Note * | 152 | 145 | -4.6Note * | 148 | 137 | -7.4Note * |
| Couples with children | 279 | 281 | 0.7Note * | 249 | 244 | -2.0Note * | 281 | 280 | -0.4 |
| Couples with other relatives | 88 | 89 | 1.1Note * | 85 | 86 | 1.2 | 83 | 86 | 3.6 |
| Lone-parent families | 47 | 47 | 0.0 | 61 | 68 | 11.5Note * | 53 | 56 | 5.7 |
| Male lone-parent families | Note F: too unreliable to be published | Note F: too unreliable to be published | Note F: too unreliable to be published | Note F: too unreliable to be published | Note F: too unreliable to be published | Note F: too unreliable to be published | Note F: too unreliable to be published | Note F: too unreliable to be published | Note F: too unreliable to be published |
| Female lone-parent families | 37 | 37 | 0.0 | 47 | 55 | 17.0Note * | 41 | 43 | 4.9 |
| Other non-senior families | 71 | 70 | -1.4Note * | 64 | 63 | -1.6 | 68 | 71 | 4.4 |
| Persons not in an economic family | 160 | 158 | -1.3Note * | 165 | 164 | -0.6Note * | 171 | 175 | 2.3Note * |
| Seniors not in an economic family | 48 | 48 | 0.0 | 44 | 44 | 0.0 | 57 | 60 | 5.3Note * |
| Senior males not in an economic family | 16 | 15 | -6.3 | 13 | 14 | 7.7Note * | 20 | 21 | 5.0Note * |
| Senior females not in an economic family | 33 | 33 | 0.0 | 31 | 30 | -3.2Note * | 37 | 38 | 2.7Note * |
| Non-seniors not in an economic family | 111 | 110 | -0.9Note * | 120 | 120 | 0.0 | 114 | 116 | 1.8 |
| Non-senior males not in an economic family | 58 | 56 | -3.4Note * | 61 | 61 | 0.0 | 58 | 57 | -1.7 |
| Non-senior females not in an economic family | 54 | 53 | -1.9 | 59 | 59 | 0.0 | 57 | 59 | 3.5Note * |
F too unreliable to be published
|
|||||||||
| 2013 | 2016 | 2019 | |||||||
|---|---|---|---|---|---|---|---|---|---|
| Unrevised | Revised | Change | Unrevised | Revised | Change | Unrevised | Revised | Change | |
| ('000) | % | ('000) | % | ('000) | % | ||||
| Economic families and persons not in an economic family | 731 | 735 | 0.5Note * | 731 | 741 | 1.4Note * | 744 | 756 | 1.6Note * |
| Economic families | 620 | 622 | 0.3Note * | 618 | 618 | 0.0 | 627 | 625 | -0.3Note * |
| Senior families | 100 | 99 | -1.0Note * | 107 | 105 | -1.9Note * | 112 | 108 | -3.6Note * |
| Senior couples | 72 | 71 | -1.4Note * | 86 | 83 | -3.5Note * | 85 | 80 | -5.9Note * |
| Other senior families | 28 | 29 | 3.6 | 21 | 22 | 4.8Note * | 27 | 28 | 3.7 |
| Non-senior families | 520 | 522 | 0.4Note * | 511 | 513 | 0.4Note * | 516 | 517 | 0.2 |
| Couples | 128 | 127 | -0.8 | 125 | 120 | -4.0Note * | 123 | 117 | -4.9Note * |
| Couples with children | 239 | 245 | 2.5Note * | 223 | 229 | 2.7Note * | 215 | 220 | 2.3Note * |
| Couples with other relatives | 71 | 72 | 1.4Note * | 72 | 76 | 5.6Note * | 78 | 84 | 7.7Note * |
| Lone-parent families | 43 | 39 | -9.3Note * | 51 | 49 | -3.9Note * | 53 | 49 | -7.5Note * |
| Male lone-parent families | Note F: too unreliable to be published | Note F: too unreliable to be published | Note F: too unreliable to be published | Note F: too unreliable to be published | Note F: too unreliable to be published | Note F: too unreliable to be published | Note F: too unreliable to be published | Note F: too unreliable to be published | Note F: too unreliable to be published |
| Female lone-parent families | 37 | 33 | -10.8Note * | 40 | 39 | -2.5Note * | 39 | 38 | -2.6 |
| Other non-senior families | 40 | 40 | 0.0 | 40 | 39 | -2.5 | 47 | 46 | -2.1 |
| Persons not in an economic family | 110 | 113 | 2.7Note * | 114 | 123 | 7.9Note * | 117 | 131 | 12.0Note * |
| Seniors not in an economic family | 33 | 34 | 3.0Note * | 38 | 41 | 7.9Note * | 47 | 53 | 12.8Note * |
| Senior males not in an economic family | 10 | 10 | 0.0 | 12 | 14 | 16.7Note * | 15 | 18 | 20.0Note * |
| Senior females not in an economic family | 23 | 24 | 4.3Note * | 26 | 28 | 7.7Note * | 32 | 35 | 9.4Note * |
| Non-seniors not in an economic family | 77 | 79 | 2.6Note * | 76 | 81 | 6.6Note * | 70 | 79 | 12.9Note * |
| Non-senior males not in an economic family | 45 | 46 | 2.2Note * | 41 | 45 | 9.8Note * | 40 | 44 | 10.0Note * |
| Non-senior females not in an economic family | 32 | 34 | 6.3Note * | 34 | 36 | 5.9Note * | 30 | 35 | 16.7Note * |
F too unreliable to be published
|
|||||||||
| 2013 | 2016 | 2019 | |||||||
|---|---|---|---|---|---|---|---|---|---|
| Unrevised | Revised | Change | Unrevised | Revised | Change | Unrevised | Revised | Change | |
| ('000) | % | ('000) | % | ('000) | % | ||||
| Economic families and persons not in an economic family | 8,024 | 7,967 | -0.7Note * | 8,194 | 8,096 | -1.2Note * | 8,417 | 8,370 | -0.6Note * |
| Economic families | 6,577 | 6,518 | -0.9Note * | 6,694 | 6,577 | -1.7Note * | 6,866 | 6,767 | -1.4Note * |
| Senior families | 873 | 855 | -2.1Note * | 1,000 | 957 | -4.3Note * | 1,032 | 973 | -5.7Note * |
| Senior couples | 703 | 684 | -2.7Note * | 759 | 721 | -5.0Note * | 805 | 746 | -7.3Note * |
| Other senior families | 170 | 171 | 0.6 | 241 | 235 | -2.5Note * | 227 | 227 | 0.0 |
| Non-senior families | 5,704 | 5,663 | -0.7Note * | 5,694 | 5,621 | -1.3Note * | 5,833 | 5,794 | -0.7Note * |
| Couples | 1,187 | 1,160 | -2.3Note * | 1,212 | 1,155 | -4.7Note * | 1,257 | 1,189 | -5.4Note * |
| Couples with children | 2,633 | 2,627 | -0.2 | 2,766 | 2,750 | -0.6 | 2,836 | 2,868 | 1.1 |
| Couples with other relatives | 786 | 783 | -0.4 | 757 | 754 | -0.4 | 796 | 792 | -0.5 |
| Lone-parent families | 418 | 427 | 2.2 | 409 | 427 | 4.4Note * | 380 | 370 | -2.6 |
| Male lone-parent families | 119 | 122 | 2.5 | 63 | 70 | 11.1 | 94 | 103 | 9.6 |
| Female lone-parent families | 299 | 305 | 2.0Note * | 346 | 358 | 3.5Note * | 286 | 267 | -6.6 |
| Other non-senior families | 681 | 667 | -2.1Note * | 550 | 535 | -2.7Note * | 564 | 574 | 1.8 |
| Persons not in an economic family | 1,448 | 1,449 | 0.1Note * | 1,500 | 1,519 | 1.3Note * | 1,551 | 1,603 | 3.4Note * |
| Seniors not in an economic family | 444 | 444 | 0.0 | 442 | 449 | 1.6Note * | 554 | 572 | 3.2Note * |
| Senior males not in an economic family | 137 | 140 | 2.2Note * | 145 | 154 | 6.2Note * | 197 | 217 | 10.2Note * |
| Senior females not in an economic family | 307 | 304 | -1.0Note * | 298 | 294 | -1.3Note * | 357 | 356 | -0.3 |
| Non-seniors not in an economic family | 1,003 | 1,005 | 0.2 | 1,058 | 1,070 | 1.1Note * | 997 | 1,031 | 3.4Note * |
| Non-senior males not in an economic family | 572 | 572 | 0.0 | 618 | 625 | 1.1Note * | 555 | 570 | 2.7Note * |
| Non-senior females not in an economic family | 431 | 433 | 0.5 | 440 | 446 | 1.4Note * | 442 | 461 | 4.3Note * |
|
|||||||||
| 2013 | 2016 | 2019 | |||||||
|---|---|---|---|---|---|---|---|---|---|
| Unrevised | Revised | Change | Unrevised | Revised | Change | Unrevised | Revised | Change | |
| ('000) | % | ('000) | % | ('000) | % | ||||
| Economic families and persons not in an economic family | 13,387 | 13,336 | -0.4Note * | 13,806 | 13,741 | -0.5Note * | 14,515 | 14,419 | -0.7Note * |
| Economic families | 11,538 | 11,450 | -0.8Note * | 11,873 | 11,695 | -1.5Note * | 12,459 | 12,201 | -2.1Note * |
| Senior families | 1,507 | 1,477 | -2.0Note * | 1,608 | 1,544 | -4.0Note * | 1,845 | 1,748 | -5.3Note * |
| Senior couples | 1,003 | 976 | -2.7Note * | 1,114 | 1,057 | -5.1Note * | 1,242 | 1,143 | -8.0Note * |
| Other senior families | 504 | 501 | -0.6Note * | 495 | 487 | -1.6Note * | 603 | 604 | 0.2 |
| Non-senior families | 10,031 | 9,972 | -0.6Note * | 10,264 | 10,151 | -1.1Note * | 10,614 | 10,454 | -1.5Note * |
| Couples | 1,483 | 1,430 | -3.6Note * | 1,597 | 1,488 | -6.8Note * | 1,638 | 1,504 | -8.2Note * |
| Couples with children | 4,989 | 5,015 | 0.5Note * | 5,026 | 5,063 | 0.7Note * | 5,128 | 5,100 | -0.5 |
| Couples with other relatives | 1,703 | 1,691 | -0.7Note * | 1,898 | 1,870 | -1.5Note * | 1,747 | 1,725 | -1.3 |
| Lone-parent families | 679 | 684 | 0.7Note * | 703 | 722 | 2.7Note * | 705 | 724 | 2.7 |
| Male lone-parent families | 90 | 91 | 1.1 | 114 | 121 | 6.1Note * | 125 | 133 | 6.4 |
| Female lone-parent families | 588 | 593 | 0.9Note * | 589 | 601 | 2.0Note * | 580 | 591 | 1.9 |
| Other non-senior families | 1,176 | 1,152 | -2.0Note * | 1,041 | 1,008 | -3.2Note * | 1,397 | 1,399 | 0.1 |
| Persons not in an economic family | 1,849 | 1,887 | 2.1Note * | 1,933 | 2,046 | 5.8Note * | 2,056 | 2,218 | 7.9Note * |
| Seniors not in an economic family | 489 | 502 | 2.7Note * | 550 | 584 | 6.2Note * | 666 | 725 | 8.9Note * |
| Senior males not in an economic family | 155 | 162 | 4.5Note * | 160 | 176 | 10.0Note * | 217 | 249 | 14.7Note * |
| Senior females not in an economic family | 333 | 340 | 2.1Note * | 390 | 408 | 4.6Note * | 450 | 476 | 5.8Note * |
| Non-seniors not in an economic family | 1,361 | 1,385 | 1.8Note * | 1,383 | 1,462 | 5.7Note * | 1,390 | 1,493 | 7.4Note * |
| Non-senior males not in an economic family | 770 | 787 | 2.2Note * | 754 | 805 | 6.8Note * | 758 | 820 | 8.2Note * |
| Non-senior females not in an economic family | 590 | 598 | 1.4Note * | 630 | 657 | 4.3Note * | 632 | 672 | 6.3Note * |
|
|||||||||
| 2013 | 2016 | 2019 | |||||||
|---|---|---|---|---|---|---|---|---|---|
| Unrevised | Revised | Change | Unrevised | Revised | Change | Unrevised | Revised | Change | |
| ('000) | % | ('000) | % | ('000) | % | ||||
| Economic families and persons not in an economic family | 1,185 | 1,184 | -0.1Note * | 1,228 | 1,235 | 0.6Note * | 1,277 | 1,288 | 0.9Note * |
| Economic families | 1,010 | 1,010 | 0.0 | 1,047 | 1,053 | 0.6Note * | 1,089 | 1,095 | 0.6Note * |
| Senior families | 127 | 128 | 0.8 | 130 | 130 | 0.0 | 162 | 160 | -1.2Note * |
| Senior couples | 98 | 99 | 1.0Note * | 98 | 97 | -1.0Note * | 114 | 111 | -2.6Note * |
| Other senior families | 29 | 29 | 0.0 | 32 | 33 | 3.1Note * | 48 | 48 | 0.0 |
| Non-senior families | 883 | 883 | 0.0 | 917 | 924 | 0.8Note * | 926 | 936 | 1.1Note * |
| Couples | 152 | 150 | -1.3Note * | 155 | 149 | -3.9Note * | 151 | 144 | -4.6Note * |
| Couples with children | 440 | 443 | 0.7Note * | 473 | 486 | 2.7Note * | 486 | 497 | 2.3Note * |
| Couples with other relatives | 125 | 125 | 0.0 | 132 | 131 | -0.8Note * | 143 | 144 | 0.7 |
| Lone-parent families | 72 | 74 | 2.8 | 59 | 61 | 3.4Note * | 58 | 63 | 8.6 |
| Male lone-parent families | 10 | 10 | 0.0 | F | F | Note F: too unreliable to be published | F | F | Note F: too unreliable to be published |
| Female lone-parent families | 63 | 64 | 1.6 | 52 | 53 | 1.9Note * | 46 | 51 | 10.9 |
| Other non-senior families | 93 | 92 | -1.1Note * | 97 | 96 | -1.0Note * | 89 | 88 | -1.1 |
| Persons not in an economic family | 175 | 174 | -0.6Note * | 181 | 182 | 0.6Note * | 189 | 193 | 2.1Note * |
| Seniors not in an economic family | 51 | 50 | -2.0Note * | 61 | 60 | -1.6Note * | 57 | 58 | 1.8 |
| Senior males not in an economic family | 15 | 15 | 0.0 | 20 | 20 | 0.0 | 19 | 19 | 0.0 |
| Senior females not in an economic family | 36 | 35 | -2.8Note * | 40 | 40 | 0.0 | 39 | 40 | 2.6 |
| Non-seniors not in an economic family | 124 | 124 | 0.0 | 120 | 122 | 1.7Note * | 131 | 135 | 3.1Note * |
| Non-senior males not in an economic family | 67 | 66 | -1.5Note * | 72 | 73 | 1.4Note * | 76 | 79 | 3.9Note * |
| Non-senior females not in an economic family | 57 | 58 | 1.8Note * | 48 | 49 | 2.1 | 55 | 56 | 1.8 |
F too unreliable to be published
|
|||||||||
| 2013 | 2016 | 2019 | |||||||
|---|---|---|---|---|---|---|---|---|---|
| Unrevised | Revised | Change | Unrevised | Revised | Change | Unrevised | Revised | Change | |
| ('000) | % | ('000) | % | ('000) | % | ||||
| Economic families and persons not in an economic family | 1,033 | 1,032 | -0.1Note * | 1,071 | 1,068 | -0.3Note * | 1,098 | 1,103 | 0.5Note * |
| Economic families | 865 | 867 | 0.2Note * | 898 | 903 | 0.6Note * | 921 | 932 | 1.2Note * |
| Senior families | 105 | 107 | 1.9 | 117 | 117 | 0.0 | 135 | 133 | -1.5 |
| Senior couples | 84 | 84 | 0.0 | 88 | 87 | -1.1Note * | 107 | 103 | -3.7Note * |
| Other senior families | 22 | 23 | 4.5 | 29 | 29 | 0.0 | 28 | 30 | 7.1Note * |
| Non-senior families | 760 | 761 | 0.1 | 781 | 787 | 0.8Note * | 786 | 799 | 1.7Note * |
| Couples | 153 | 148 | -3.3Note * | 161 | 147 | -8.7Note * | 160 | 143 | -10.6Note * |
| Couples with children | 397 | 399 | 0.5Note * | 408 | 422 | 3.4Note * | 406 | 432 | 6.4Note * |
| Couples with other relatives | 83 | 84 | 1.2Note * | 95 | 101 | 6.3Note * | 109 | 114 | 4.6Note * |
| Lone-parent families | 51 | 54 | 5.9Note * | 49 | 51 | 4.1 | 56 | 52 | -7.1 |
| Male lone-parent families | F | F | Note F: too unreliable to be published | 10 | 9 | -10.0 | F | F | Note F: too unreliable to be published |
| Female lone-parent families | 44 | 46 | 4.5Note * | 39 | 42 | 7.7 | 42 | 41 | -2.4 |
| Other non-senior families | 76 | 74 | -2.6Note * | 68 | 66 | -2.9Note * | 54 | 57 | 5.6 |
| Persons not in an economic family | 168 | 165 | -1.8Note * | 173 | 164 | -5.2Note * | 177 | 171 | -3.4Note * |
| Seniors not in an economic family | 48 | 49 | 2.1Note * | 51 | 52 | 2.0Note * | 47 | 50 | 6.4Note * |
| Senior males not in an economic family | 16 | 16 | 0.0 | 19 | 19 | 0.0 | 16 | 17 | 6.3Note * |
| Senior females not in an economic family | 33 | 33 | 0.0 | 32 | 33 | 3.1Note * | 31 | 33 | 6.5Note * |
| Non-seniors not in an economic family | 120 | 116 | -3.3Note * | 123 | 112 | -8.9Note * | 131 | 121 | -7.6Note * |
| Non-senior males not in an economic family | 69 | 66 | -4.3Note * | 70 | 64 | -8.6Note * | 73 | 68 | -6.8Note * |
| Non-senior females not in an economic family | 51 | 49 | -3.9Note * | 53 | 48 | -9.4Note * | 57 | 53 | -7.0Note * |
F too unreliable to be published
|
|||||||||
| 2013 | 2016 | 2019 | |||||||
|---|---|---|---|---|---|---|---|---|---|
| Unrevised | Revised | Change | Unrevised | Revised | Change | Unrevised | Revised | Change | |
| ('000) | % | ('000) | % | ('000) | % | ||||
| Economic families and persons not in an economic family | 3,961 | 3,928 | -0.8Note * | 4,189 | 4,110 | -1.9Note * | 4,365 | 4,292 | -1.7Note * |
| Economic families | 3,358 | 3,319 | -1.2Note * | 3,564 | 3,518 | -1.3Note * | 3,714 | 3,677 | -1.0Note * |
| Senior families | 327 | 326 | -0.3 | 346 | 338 | -2.3Note * | 435 | 424 | -2.5 |
| Senior couples | 251 | 246 | -2.0Note * | 281 | 272 | -3.2Note * | 298 | 276 | -7.4Note * |
| Other senior families | 76 | 79 | 3.9 | 65 | 66 | 1.5 | 137 | 149 | 8.8Note * |
| Non-senior families | 3,031 | 2,993 | -1.3Note * | 3,218 | 3,180 | -1.2Note * | 3,279 | 3,252 | -0.8Note * |
| Couples | 559 | 540 | -3.4Note * | 604 | 547 | -9.4Note * | 628 | 539 | -14.2Note * |
| Couples with children | 1,607 | 1,586 | -1.3 | 1,656 | 1,699 | 2.6Note * | 1,736 | 1,761 | 1.4 |
| Couples with other relatives | 427 | 394 | -7.7Note * | 460 | 459 | -0.2 | 503 | 528 | 5.0Note * |
| Lone-parent families | 137 | 184 | 34.3Note * | 166 | 159 | -4.2 | 132 | 137 | 3.8 |
| Male lone-parent families | F | F | Note F: too unreliable to be published | 63 | 65 | 3.2 | 33 | 33 | 0.0 |
| Female lone-parent families | 109 | 149 | 36.7Note * | 102 | 94 | -7.8 | 99 | 103 | 4.0 |
| Other non-senior families | 301 | 289 | -4.0 | 331 | 316 | -4.5Note * | 280 | 287 | 2.5 |
| Persons not in an economic family | 603 | 609 | 1.0Note * | 625 | 592 | -5.3Note * | 651 | 615 | -5.5Note * |
| Seniors not in an economic family | 106 | 109 | 2.8Note * | 131 | 134 | 2.3 | 145 | 143 | -1.4 |
| Senior males not in an economic family | 32 | 33 | 3.1Note * | 47 | 49 | 4.3 | 39 | 38 | -2.6 |
| Senior females not in an economic family | 75 | 76 | 1.3 | 84 | 85 | 1.2 | 106 | 105 | -0.9 |
| Non-seniors not in an economic family | 497 | 500 | 0.6Note * | 494 | 458 | -7.3Note * | 507 | 473 | -6.7Note * |
| Non-senior males not in an economic family | 290 | 289 | -0.3 | 280 | 250 | -10.7Note * | 290 | 266 | -8.3Note * |
| Non-senior females not in an economic family | 207 | 210 | 1.4 | 214 | 208 | -2.8Note * | 216 | 207 | -4.2Note * |
F too unreliable to be published
|
|||||||||
| 2013 | 2016 | 2019 | |||||||
|---|---|---|---|---|---|---|---|---|---|
| Unrevised | Revised | Change | Unrevised | Revised | Change | Unrevised | Revised | Change | |
| ('000) | % | ('000) | % | ('000) | % | ||||
| Economic families and persons not in an economic family | 4,470 | 4,532 | 1.4Note * | 4,631 | 4,747 | 2.5Note * | 4,828 | 4,984 | 3.2Note * |
| Economic families | 3,704 | 3,742 | 1.0Note * | 3,828 | 3,888 | 1.6Note * | 3,983 | 4,059 | 1.9Note * |
| Senior families | 545 | 540 | -0.9 | 550 | 535 | -2.7Note * | 632 | 625 | -1.1 |
| Senior couples | 363 | 352 | -3.0Note * | 426 | 404 | -5.2Note * | 461 | 437 | -5.2Note * |
| Other senior families | 181 | 188 | 3.9Note * | 124 | 131 | 5.6Note * | 171 | 188 | 9.9Note * |
| Non-senior families | 3,159 | 3,203 | 1.4Note * | 3,278 | 3,353 | 2.3Note * | 3,350 | 3,434 | 2.5Note * |
| Couples | 597 | 603 | 1.0Note * | 569 | 575 | 1.1 | 637 | 642 | 0.8 |
| Couples with children | 1,526 | 1,558 | 2.1Note * | 1,563 | 1,606 | 2.8Note * | 1,520 | 1,555 | 2.3Note * |
| Couples with other relatives | 470 | 490 | 4.3Note * | 449 | 465 | 3.6Note * | 567 | 600 | 5.8Note * |
| Lone-parent families | 218 | 200 | -8.3Note * | 208 | 203 | -2.4 | 194 | 189 | -2.6 |
| Male lone-parent families | 44 | 39 | -11.4Note * | 34 | 32 | -5.9 | 33 | 32 | -3.0 |
| Female lone-parent families | 174 | 161 | -7.5Note * | 174 | 171 | -1.7 | 161 | 156 | -3.1 |
| Other non-senior families | 348 | 352 | 1.1 | 489 | 503 | 2.9Note * | 433 | 448 | 3.5 |
| Persons not in an economic family | 767 | 790 | 3.0Note * | 803 | 859 | 7.0Note * | 845 | 925 | 9.5Note * |
| Seniors not in an economic family | 199 | 197 | -1.0Note * | 213 | 214 | 0.5 | 242 | 249 | 2.9 |
| Senior males not in an economic family | 70 | 68 | -2.9 | 71 | 69 | -2.8Note * | 96 | 96 | 0.0 |
| Senior females not in an economic family | 129 | 128 | -0.8 | 142 | 145 | 2.1Note * | 147 | 153 | 4.1Note * |
| Non-seniors not in an economic family | 568 | 593 | 4.4Note * | 589 | 645 | 9.5Note * | 603 | 676 | 12.1Note * |
| Non-senior males not in an economic family | 329 | 339 | 3.0Note * | 334 | 358 | 7.2Note * | 310 | 347 | 11.9Note * |
| Non-senior females not in an economic family | 238 | 254 | 6.7Note * | 256 | 286 | 11.7Note * | 294 | 329 | 11.9Note * |
|
|||||||||
| 2013 | 2016 | 2019 | |||||||
|---|---|---|---|---|---|---|---|---|---|
| Unrevised | Revised | Change | Unrevised | Revised | Change | Unrevised | Revised | Change | |
| 2019 constant dollars |
% | 2019 constant dollars |
% | 2019 constant dollars |
% | ||||
| Median market income | |||||||||
| Economic families and persons not in an economic family | 51,600 | 51,600 | 0.0 | 48,500 | 48,700 | 0.4 | 49,000 | 46,500 | -5.1Note * |
| Economic families | 68,000 | 68,600 | 0.9 | 67,600 | 68,200 | 0.9 | 69,000 | 68,300 | -1.0 |
| Persons not in an economic family | 21,400 | 19,700 | -7.9 | 20,400 | 19,500 | -4.4 | 19,700 | 18,000 | -8.6 |
| Median government transfers | |||||||||
| Economic families and persons not in an economic family | 11,800 | 12,000 | 1.7 | 14,000 | 14,300 | 2.1 | 15,000 | 15,300 | 2.0 |
| Economic families | 14,200 | 14,200 | 0.0 | 16,500 | 16,700 | 1.2 | 16,800 | 17,200 | 2.4 |
| Persons not in an economic family | 8,000 | 8,000 | 0.0 | 10,000 | 10,100 | 1.0 | 11,400 | 11,500 | 0.9 |
| Median total income | |||||||||
| Economic families and persons not in an economic family | 66,500 | 66,800 | 0.5 | 68,800 | 69,000 | 0.3 | 64,200 | 62,600 | -2.5 |
| Economic families | 85,500 | 85,500 | 0.0 | 86,700 | 87,000 | 0.3 | 86,400 | 85,800 | -0.7 |
| Persons not in an economic family | 34,200 | 33,600 | -1.8 | 29,400 | 29,400 | 0.0 | 33,700 | 31,700 | -5.9 |
| Median income tax | |||||||||
| Economic families and persons not in an economic family | 7,500 | 7,500 | 0.0 | 7,500 | 7,500 | 0.0 | 6,800 | 6,600 | -2.9 |
| Economic families | 10,300 | 10,400 | 1.0 | 10,800 | 10,800 | 0.0 | 12,100 | 12,000 | -0.8 |
| Persons not in an economic family | 2,700 | 2,700 | 0.0 | 1,300 | 1,300 | 0.0 | 3,100 | 2,900 | -6.5 |
| Median after-tax income | |||||||||
| Economic families and persons not in an economic family | 59,200 | 59,200 | 0.0 | 59,100 | 59,600 | 0.8 | 56,500 | 55,500 | -1.8 |
| Economic families | 75,500 | 75,500 | 0.0 | 76,300 | 76,600 | 0.4 | 74,000 | 73,600 | -0.5 |
| Persons not in an economic family | 30,900 | 30,300 | -1.9 | 27,900 | 28,000 | 0.4 | 30,400 | 30,100 | -1.0 |
| Unrevised | Revised | Change | Unrevised | Revised | Change | Unrevised | Revised | Change | |
| % | p.p. | % | p.p. | % | p.p. | ||||
| Percentage of persons in poverty or low income | |||||||||
| Poverty rate (2018-base MBM) | Note ..: not available for a specific reference period | Note ..: not available for a specific reference period | Note ..: not available for a specific reference period | 12.4 | 12.2 | -0.2 | 10.7 | 11.2 | 0.5Note * |
| Poverty rate (2008-base MBM) | 12.0 | 11.9 | -0.1 | 10.8 | 10.8 | 0.0 | 8.2 | 8.8 | 0.6Note * |
| Low-income rate (LIM-AT) | 12.8 | 12.9 | 0.1 | 15.6 | 15.8 | 0.2 | 14.7 | 15.6 | 0.9Note * |
.. not available for a specific reference period
Source: Statistics Canada, Canadian Income Survey. Tables 11-10-0190-01 and 11-10-0135-01. |
|||||||||
| 2013 | 2016 | 2019 | |||||||
|---|---|---|---|---|---|---|---|---|---|
| Unrevised | Revised | Change | Unrevised | Revised | Change | Unrevised | Revised | Change | |
| 2019 constant dollars |
% | 2019 constant dollars |
% | 2019 constant dollars |
% | ||||
| Median market income | |||||||||
| Economic families and persons not in an economic family | 44,400 | 44,700 | 0.7 | 46,300 | 43,600 | -5.8 | 48,100 | 46,900 | -2.5 |
| Economic families | 67,500 | 68,300 | 1.2 | 68,200 | 63,600 | -6.7 | 70,300 | 68,400 | -2.7 |
| Persons not in an economic family | 22,500 | 22,500 | 0.0 | 22,200 | 21,900 | -1.4 | 23,400 | 21,900 | -6.4 |
| Median government transfers | |||||||||
| Economic families and persons not in an economic family | 12,600 | 12,400 | -1.6 | 11,500 | 11,200 | -2.6 | 12,400 | 11,900 | -4.0 |
| Economic families | 14,000 | 13,700 | -2.1 | 14,700 | 13,600 | -7.5 | 16,400 | 15,700 | -4.3 |
| Persons not in an economic family | 9,000 | 9,100 | 1.1 | 7,000 | 7,000 | 0.0 | 6,300 | 6,600 | 4.8 |
| Median total income | |||||||||
| Economic families and persons not in an economic family | 61,900 | 61,800 | -0.2 | 61,700 | 58,500 | -5.2 | 68,100 | 64,400 | -5.4Note * |
| Economic families | 83,200 | 84,100 | 1.1 | 87,000 | 80,500 | -7.5 | 92,300 | 88,500 | -4.1Note * |
| Persons not in an economic family | 32,000 | 32,400 | 1.3 | 30,000 | 29,700 | -1.0 | 31,600 | 31,200 | -1.3 |
| Median income tax | |||||||||
| Economic families and persons not in an economic family | 7,200 | 7,200 | 0.0 | 7,300 | 6,600 | -9.6 | 7,700 | 7,200 | -6.5Note * |
| Economic families | 11,000 | 11,100 | 0.9 | 10,400 | 9,900 | -4.8 | 12,800 | 11,900 | -7.0Note * |
| Persons not in an economic family | 3,500 | 3,600 | 2.9 | 3,500 | 3,100 | -11.4 | 2,600 | 2,500 | -3.8 |
| Median after-tax income | |||||||||
| Economic families and persons not in an economic family | 54,000 | 53,900 | -0.2 | 54,600 | 52,800 | -3.3 | 60,300 | 56,800 | -5.8Note * |
| Economic families | 71,800 | 71,800 | 0.0 | 74,400 | 70,900 | -4.7 | 79,000 | 76,300 | -3.4Note * |
| Persons not in an economic family | 28,500 | 28,700 | 0.7 | 27,200 | 27,000 | -0.7 | 29,000 | 28,900 | -0.3 |
| Unrevised | Revised | Change | Unrevised | Revised | Change | Unrevised | Revised | Change | |
| % | p.p. | % | p.p. | % | p.p. | ||||
| Percentage of persons in poverty or low income | |||||||||
| Poverty rate (2018-base MBM) | Note ..: not available for a specific reference period | Note ..: not available for a specific reference period | Note ..: not available for a specific reference period | 11.8 | 13.9 | 2.1 | 10.9 | 12.3 | 1.4Note * |
| Poverty rate (2008-base MBM) | 15.7 | 15.6 | -0.1 | 11.3 | 13.3 | 2.0 | 7.9 | 9.3 | 1.4Note * |
| Low-income rate (LIM-AT) | 15.7 | 15.7 | 0.0 | 14.4 | 16.3 | 1.9 | 14.4 | 15.8 | 1.4Note * |
.. not available for a specific reference period
Source: Statistics Canada, Canadian Income Survey. Tables 11-10-0190-01 and 11-10-0135-01. |
|||||||||
| 2013 | 2016 | 2019 | |||||||
|---|---|---|---|---|---|---|---|---|---|
| Unrevised | Revised | Change | Unrevised | Revised | Change | Unrevised | Revised | Change | |
| 2019 constant dollars |
% | 2019 constant dollars |
% | 2019 constant dollars |
% | ||||
| Median market income | |||||||||
| Economic families and persons not in an economic family | 48,100 | 48,200 | 0.2 | 45,500 | 45,500 | 0.0 | 45,500 | 45,400 | -0.2 |
| Economic families | 69,200 | 69,800 | 0.9 | 68,000 | 68,000 | 0.0 | 72,400 | 73,600 | 1.7 |
| Persons not in an economic family | 22,600 | 22,700 | 0.4 | 22,000 | 22,000 | 0.0 | 22,800 | 22,100 | -3.1 |
| Median government transfers | |||||||||
| Economic families and persons not in an economic family | 8,000 | 8,000 | 0.0 | 8,900 | 8,900 | 0.0 | 9,600 | 9,600 | 0.0 |
| Economic families | 9,800 | 9,800 | 0.0 | 12,200 | 12,200 | 0.0 | 11,300 | 11,300 | 0.0 |
| Persons not in an economic family | 4,800 | 4,800 | 0.0 | 1,700 | 1,700 | 0.0 | 6,300 | 6,400 | 1.6 |
| Median total income | |||||||||
| Economic families and persons not in an economic family | 59,000 | 59,300 | 0.5 | 59,200 | 59,300 | 0.2 | 59,900 | 59,700 | -0.3 |
| Economic families | 82,300 | 83,300 | 1.2 | 84,100 | 84,600 | 0.6 | 87,900 | 88,300 | 0.5 |
| Persons not in an economic family | 32,300 | 32,400 | 0.3 | 31,000 | 30,600 | -1.3 | 31,600 | 31,300 | -0.9 |
| Median income tax | |||||||||
| Economic families and persons not in an economic family | 6,500 | 6,600 | 1.5 | 6,300 | 6,300 | 0.0 | 6,900 | 6,900 | 0.0 |
| Economic families | 10,300 | 10,500 | 1.9 | 10,900 | 11,000 | 0.9 | 11,500 | 11,700 | 1.7 |
| Persons not in an economic family | 2,600 | 2,700 | 3.8 | 2,300 | 2,300 | 0.0 | 3,100 | 2,700 | -12.9 |
| Median after-tax income | |||||||||
| Economic families and persons not in an economic family | 52,200 | 52,500 | 0.6 | 52,600 | 52,600 | 0.0 | 53,300 | 52,900 | -0.8 |
| Economic families | 71,300 | 71,300 | 0.0 | 73,000 | 73,100 | 0.1 | 74,500 | 75,100 | 0.8 |
| Persons not in an economic family | 29,200 | 29,300 | 0.3 | 28,300 | 28,100 | -0.7 | 28,400 | 28,400 | 0.0 |
| Unrevised | Revised | Change | Unrevised | Revised | Change | Unrevised | Revised | Change | |
| % | p.p. | % | p.p. | % | p.p. | ||||
| Percentage of persons in poverty or low income | |||||||||
| Poverty rate (2018-base MBM) | Note ..: not available for a specific reference period | Note ..: not available for a specific reference period | Note ..: not available for a specific reference period | 16.2 | 16.4 | 0.2 | 12.1 | 12.0 | -0.1 |
| Poverty rate (2008-base MBM) | 13.4 | 13.3 | -0.1Note * | 12.9 | 13.2 | 0.3Note * | 9.8 | 9.8 | 0.0 |
| Low-income rate (LIM-AT) | 14.8 | 14.9 | 0.1 | 16.1 | 16.2 | 0.1 | 15.7 | 15.1 | -0.6Note * |
.. not available for a specific reference period
Source: Statistics Canada, Canadian Income Survey. Tables 11-10-0190-01 and 11-10-0135-01. |
|||||||||
| 2013 | 2016 | 2019 | |||||||
|---|---|---|---|---|---|---|---|---|---|
| Unrevised | Revised | Change | Unrevised | Revised | Change | Unrevised | Revised | Change | |
| 2019 constant dollars |
% | 2019 constant dollars |
% | 2019 constant dollars |
% | ||||
| Median market income | |||||||||
| Economic families and persons not in an economic family | 44,400 | 44,400 | 0.0 | 44,600 | 43,400 | -2.7Note * | 47,000 | 44,600 | -5.1Note * |
| Economic families | 63,000 | 64,400 | 2.2 | 63,900 | 64,000 | 0.2 | 66,900 | 67,300 | 0.6 |
| Persons not in an economic family | 20,900 | 20,900 | 0.0 | 18,900 | 18,800 | -0.5 | 21,200 | 20,900 | -1.4 |
| Median government transfers | |||||||||
| Economic families and persons not in an economic family | 9,400 | 9,400 | 0.0 | 10,400 | 10,500 | 1.0 | 12,200 | 12,100 | -0.8 |
| Economic families | 11,700 | 11,900 | 1.7 | 12,400 | 12,500 | 0.8 | 13,600 | 13,500 | -0.7 |
| Persons not in an economic family | 5,500 | 5,500 | 0.0 | 7,600 | 7,600 | 0.0 | 10,400 | 10,400 | 0.0 |
| Median total income | |||||||||
| Economic families and persons not in an economic family | 57,200 | 57,200 | 0.0 | 59,800 | 58,200 | -2.7Note * | 63,700 | 60,700 | -4.7Note * |
| Economic families | 76,300 | 77,400 | 1.4 | 79,300 | 79,400 | 0.1 | 82,900 | 83,300 | 0.5 |
| Persons not in an economic family | 29,600 | 29,600 | 0.0 | 28,500 | 28,500 | 0.0 | 32,200 | 31,700 | -1.6 |
| Median income tax | |||||||||
| Economic families and persons not in an economic family | 5,900 | 6,000 | 1.7 | 5,900 | 5,600 | -5.1 | 6,800 | 6,500 | -4.4Note * |
| Economic families | 9,000 | 9,000 | 0.0 | 9,700 | 9,800 | 1.0 | 10,400 | 10,400 | 0.0 |
| Persons not in an economic family | 2,300 | 2,300 | 0.0 | 1,500 | 1,500 | 0.0 | 2,600 | 2,400 | -7.7 |
| Median after-tax income | |||||||||
| Economic families and persons not in an economic family | 51,900 | 51,900 | 0.0 | 53,900 | 52,700 | -2.2Note * | 56,400 | 54,400 | -3.5Note * |
| Economic families | 67,600 | 68,400 | 1.2 | 69,200 | 69,600 | 0.6 | 71,800 | 72,700 | 1.3 |
| Persons not in an economic family | 27,700 | 27,700 | 0.0 | 26,600 | 26,600 | 0.0 | 29,000 | 28,700 | -1.0 |
| Unrevised | Revised | Change | Unrevised | Revised | Change | Unrevised | Revised | Change | |
| % | p.p. | % | p.p. | % | p.p. | ||||
| Percentage of persons in poverty or low income | |||||||||
| Poverty rate (2018-base MBM) | Note ..: not available for a specific reference period | Note ..: not available for a specific reference period | Note ..: not available for a specific reference period | 13.6 | 13.9 | 0.3Note * | 9.4 | 9.9 | 0.5Note * |
| Poverty rate (2008-base MBM) | 12.9 | 12.8 | -0.1 | 11.8 | 12.1 | 0.3Note * | 7.8 | 8.1 | 0.3 |
| Low-income rate (LIM-AT) | 14.7 | 14.5 | -0.2Note * | 14.7 | 15.0 | 0.3Note * | 14.9 | 15.3 | 0.4Note * |
.. not available for a specific reference period
Source: Statistics Canada, Canadian Income Survey. Tables 11-10-0190-01 and 11-10-0135-01. |
|||||||||
| 2013 | 2016 | 2019 | |||||||
|---|---|---|---|---|---|---|---|---|---|
| Unrevised | Revised | Change | Unrevised | Revised | Change | Unrevised | Revised | Change | |
| 2019 constant dollars |
% | 2019 constant dollars |
% | 2019 constant dollars |
% | ||||
| Median market income | |||||||||
| Economic families and persons not in an economic family | 45,800 | 46,000 | 0.4 | 46,900 | 47,000 | 0.2 | 49,800 | 49,600 | -0.4 |
| Economic families | 69,500 | 70,100 | 0.9Note * | 70,600 | 71,200 | 0.8 | 77,800 | 78,600 | 1.0 |
| Persons not in an economic family | 21,500 | 21,800 | 1.4 | 23,300 | 23,600 | 1.3 | 22,200 | 22,200 | 0.0 |
| Median government transfers | |||||||||
| Economic families and persons not in an economic family | 8,700 | 8,700 | 0.0 | 9,900 | 9,800 | -1.0Note * | 10,100 | 10,000 | -1.0 |
| Economic families | 10,000 | 9,900 | -1.0 | 12,000 | 12,000 | 0.0 | 11,800 | 11,700 | -0.8 |
| Persons not in an economic family | 5,200 | 5,300 | 1.9 | 4,700 | 4,700 | 0.0 | 7,400 | 7,300 | -1.4 |
| Median total income | |||||||||
| Economic families and persons not in an economic family | 58,400 | 58,700 | 0.5 | 59,300 | 59,200 | -0.2 | 63,400 | 62,700 | -1.1Note * |
| Economic families | 83,200 | 83,400 | 0.2 | 85,800 | 86,100 | 0.3 | 91,700 | 92,600 | 1.0 |
| Persons not in an economic family | 30,800 | 31,000 | 0.6 | 31,600 | 31,700 | 0.3 | 31,200 | 31,100 | -0.3 |
| Median income tax | |||||||||
| Economic families and persons not in an economic family | 6,300 | 6,300 | 0.0 | 6,400 | 6,500 | 1.6 | 6,800 | 6,700 | -1.5 |
| Economic families | 10,600 | 10,700 | 0.9 | 11,200 | 11,300 | 0.9 | 11,700 | 11,800 | 0.9 |
| Persons not in an economic family | 2,000 | 2,100 | 5.0 | 2,400 | 2,500 | 4.2 | 1,700 | 1,700 | 0.0 |
| Median after-tax income | |||||||||
| Economic families and persons not in an economic family | 52,100 | 52,200 | 0.2 | 52,500 | 52,300 | -0.4 | 55,600 | 55,000 | -1.1Note * |
| Economic families | 72,000 | 72,300 | 0.4 | 74,500 | 75,000 | 0.7Note * | 79,600 | 80,600 | 1.3Note * |
| Persons not in an economic family | 28,500 | 28,600 | 0.4 | 28,900 | 28,900 | 0.0 | 29,100 | 29,000 | -0.3 |
| Unrevised | Revised | Change | Unrevised | Revised | Change | Unrevised | Revised | Change | |
| % | p.p. | % | p.p. | % | p.p. | ||||
| Percentage of persons in poverty or low income | |||||||||
| Poverty rate (2018-base MBM) | Note ..: not available for a specific reference period | Note ..: not available for a specific reference period | Note ..: not available for a specific reference period | 10.9 | 11.0 | 0.1 | 8.7 | 8.9 | 0.2 |
| Poverty rate (2008-base MBM) | 10.8 | 10.7 | -0.1Note * | 8.6 | 8.5 | -0.1Note * | 7.3 | 7.4 | 0.1 |
| Low-income rate (LIM-AT) | 14.1 | 13.9 | -0.2Note * | 14.0 | 13.8 | -0.2Note * | 13.5 | 13.4 | -0.1 |
.. not available for a specific reference period
Source: Statistics Canada, Canadian Income Survey. Tables 11-10-0190-01 and 11-10-0135-01. |
|||||||||
| 2013 | 2016 | 2019 | |||||||
|---|---|---|---|---|---|---|---|---|---|
| Unrevised | Revised | Change | Unrevised | Revised | Change | Unrevised | Revised | Change | |
| 2019 constant dollars |
% | 2019 constant dollars |
% | 2019 constant dollars |
% | ||||
| Median market income | |||||||||
| Economic families and persons not in an economic family | 57,000 | 56,900 | -0.2 | 58,900 | 58,400 | -0.8 | 61,900 | 60,800 | -1.8Note * |
| Economic families | 81,800 | 82,100 | 0.4 | 84,600 | 85,200 | 0.7 | 88,400 | 89,000 | 0.7 |
| Persons not in an economic family | 26,500 | 26,900 | 1.5 | 25,700 | 26,100 | 1.6 | 30,400 | 29,100 | -4.3 |
| Median government transfers | |||||||||
| Economic families and persons not in an economic family | 5,900 | 5,800 | -1.7 | 7,300 | 7,200 | -1.4Note * | 7,900 | 7,800 | -1.3 |
| Economic families | 7,800 | 7,800 | 0.0 | 8,900 | 8,800 | -1.1 | 9,400 | 9,300 | -1.1 |
| Persons not in an economic family | 1,600 | 1,600 | 0.0 | 1,700 | 1,700 | 0.0 | 2,500 | 2,400 | -4.0 |
| Median total income | |||||||||
| Economic families and persons not in an economic family | 67,500 | 67,400 | -0.1 | 70,800 | 69,900 | -1.3Note * | 75,600 | 73,400 | -2.9Note * |
| Economic families | 92,700 | 93,300 | 0.6Note * | 96,700 | 97,600 | 0.9Note * | 102,200 | 102,200 | 0.0 |
| Persons not in an economic family | 35,200 | 35,300 | 0.3 | 33,000 | 33,300 | 0.9 | 37,200 | 36,900 | -0.8 |
| Median income tax | |||||||||
| Economic families and persons not in an economic family | 6,900 | 6,900 | 0.0 | 6,800 | 6,700 | -1.5Note * | 7,800 | 7,600 | -2.6Note * |
| Economic families | 10,400 | 10,500 | 1.0Note * | 10,700 | 10,800 | 0.9 | 11,900 | 11,900 | 0.0 |
| Persons not in an economic family | 2,900 | 3,000 | 3.4 | 2,200 | 2,300 | 4.5 | 3,200 | 3,000 | -6.3 |
| Median after-tax income | |||||||||
| Economic families and persons not in an economic family | 61,100 | 60,900 | -0.3 | 62,900 | 62,300 | -1.0Note * | 66,600 | 64,600 | -3.0Note * |
| Economic families | 81,700 | 82,100 | 0.5Note * | 85,600 | 86,200 | 0.7Note * | 89,900 | 89,900 | 0.0 |
| Persons not in an economic family | 31,900 | 32,200 | 0.9 | 31,000 | 31,300 | 1.0 | 34,200 | 34,000 | -0.6 |
| Unrevised | Revised | Change | Unrevised | Revised | Change | Unrevised | Revised | Change | |
| % | p.p. | % | p.p. | % | p.p. | ||||
| Percentage of persons in poverty or low income | |||||||||
| Poverty rate (2018-base MBM) | Note ..: not available for a specific reference period | Note ..: not available for a specific reference period | Note ..: not available for a specific reference period | 13.6 | 13.7 | 0.1 | 10.9 | 10.9 | 0.0 |
| Poverty rate (2008-base MBM) | 13.9 | 13.9 | 0.0 | 11.8 | 11.8 | 0.0 | 9.2 | 9.3 | 0.1 |
| Low-income rate (LIM-AT) | 14.2 | 14.1 | -0.1Note * | 13.7 | 13.7 | 0.0 | 12.3 | 12.2 | -0.1 |
.. not available for a specific reference period
Source: Statistics Canada, Canadian Income Survey. Tables 11-10-0190-01 and 11-10-0135-01. |
|||||||||
| 2013 | 2016 | 2019 | |||||||
|---|---|---|---|---|---|---|---|---|---|
| Unrevised | Revised | Change | Unrevised | Revised | Change | Unrevised | Revised | Change | |
| 2019 constant dollars |
% | 2019 constant dollars |
% | 2019 constant dollars |
% | ||||
| Median market income | |||||||||
| Economic families and persons not in an economic family | 57,400 | 57,300 | -0.2 | 56,300 | 56,200 | -0.2 | 56,600 | 55,500 | -1.9Note * |
| Economic families | 80,900 | 80,900 | 0.0 | 79,000 | 79,200 | 0.3 | 79,000 | 77,600 | -1.8 |
| Persons not in an economic family | 28,000 | 28,000 | 0.0 | 28,100 | 28,000 | -0.4 | 28,800 | 26,900 | -6.6Note * |
| Median government transfers | |||||||||
| Economic families and persons not in an economic family | 4,900 | 4,900 | 0.0 | 6,900 | 6,900 | 0.0 | 8,300 | 8,400 | 1.2 |
| Economic families | 5,900 | 5,900 | 0.0 | 8,300 | 8,500 | 2.4 | 10,100 | 10,400 | 3.0 |
| Persons not in an economic family | 1,500 | 1,400 | -6.7 | 1,900 | 1,700 | -10.5 | 1,700 | 2,000 | 17.6 |
| Median total income | |||||||||
| Economic families and persons not in an economic family | 67,600 | 67,600 | 0.0 | 69,100 | 69,100 | 0.0 | 70,300 | 69,300 | -1.4 |
| Economic families | 90,000 | 90,100 | 0.1 | 91,700 | 91,900 | 0.2 | 93,300 | 92,500 | -0.9 |
| Persons not in an economic family | 35,600 | 35,500 | -0.3 | 36,400 | 36,200 | -0.5 | 36,700 | 35,400 | -3.5Note * |
| Median income tax | |||||||||
| Economic families and persons not in an economic family | 8,100 | 8,100 | 0.0 | 8,400 | 8,400 | 0.0 | 8,800 | 8,500 | -3.4Note * |
| Economic families | 12,000 | 12,000 | 0.0 | 12,300 | 12,300 | 0.0 | 12,500 | 12,200 | -2.4 |
| Persons not in an economic family | 3,900 | 3,900 | 0.0 | 3,900 | 3,800 | -2.6 | 3,900 | 3,600 | -7.7 |
| Median after-tax income | |||||||||
| Economic families and persons not in an economic family | 59,200 | 59,200 | 0.0 | 60,400 | 60,400 | 0.0 | 61,300 | 60,200 | -1.8Note * |
| Economic families | 77,600 | 77,600 | 0.0 | 79,000 | 79,200 | 0.3 | 79,900 | 79,600 | -0.4 |
| Persons not in an economic family | 32,200 | 32,100 | -0.3 | 32,100 | 31,900 | -0.6 | 32,400 | 31,300 | -3.4 |
| Unrevised | Revised | Change | Unrevised | Revised | Change | Unrevised | Revised | Change | |
| % | p.p. | % | p.p. | % | p.p. | ||||
| Percentage of persons in poverty or low income | |||||||||
| Poverty rate (2018-base MBM) | Note ..: not available for a specific reference period | Note ..: not available for a specific reference period | Note ..: not available for a specific reference period | 12.3 | 12.4 | 0.1Note * | 11.4 | 11.5 | 0.1 |
| Poverty rate (2008-base MBM) | 11.2 | 11.2 | 0.0 | 9.4 | 9.5 | 0.1Note * | 10.2 | 10.0 | -0.2 |
| Low-income rate (LIM-AT) | 14.3 | 14.2 | -0.1Note * | 13.3 | 13.3 | 0.0 | 15.3 | 15.1 | -0.2 |
.. not available for a specific reference period
Source: Statistics Canada, Canadian Income Survey. Tables 11-10-0190-01 and 11-10-0135-01. |
|||||||||
| 2013 | 2016 | 2019 | |||||||
|---|---|---|---|---|---|---|---|---|---|
| Unrevised | Revised | Change | Unrevised | Revised | Change | Unrevised | Revised | Change | |
| 2019 constant dollars |
% | 2019 constant dollars |
% | 2019 constant dollars |
% | ||||
| Median market income | |||||||||
| Economic families and persons not in an economic family | 61,400 | 62,400 | 1.6 | 61,100 | 62,600 | 2.5Note * | 57,900 | 58,500 | 1.0 |
| Economic families | 90,200 | 90,200 | 0.0 | 89,900 | 90,600 | 0.8 | 83,900 | 84,100 | 0.2 |
| Persons not in an economic family | 29,100 | 29,600 | 1.7 | 27,400 | 27,400 | 0.0 | 26,500 | 26,000 | -1.9 |
| Median government transfers | |||||||||
| Economic families and persons not in an economic family | 3,300 | 3,500 | 6.1 | 5,600 | 6,200 | 10.7Note * | 6,900 | 7,600 | 10.1Note * |
| Economic families | 4,200 | 4,200 | 0.0 | 6,900 | 7,100 | 2.9 | 9,700 | 9,700 | 0.0 |
| Persons not in an economic family | 1,400 | 1,600 | 14.3 | 1,500 | 1,900 | 26.7 | 1,600 | 2,300 | 43.8Note * |
| Median total income | |||||||||
| Economic families and persons not in an economic family | 71,900 | 72,600 | 1.0Note * | 72,100 | 73,400 | 1.8Note * | 71,700 | 73,000 | 1.8Note * |
| Economic families | 99,300 | 99,500 | 0.2 | 99,600 | 100,700 | 1.1 | 97,400 | 98,700 | 1.3Note * |
| Persons not in an economic family | 36,300 | 36,600 | 0.8 | 34,500 | 35,100 | 1.7 | 35,400 | 35,400 | 0.0 |
| Median income tax | |||||||||
| Economic families and persons not in an economic family | 7,700 | 7,800 | 1.3 | 7,600 | 7,800 | 2.6Note * | 7,700 | 7,700 | 0.0 |
| Economic families | 12,100 | 12,100 | 0.0 | 12,900 | 12,900 | 0.0 | 11,900 | 12,000 | 0.8 |
| Persons not in an economic family | 2,900 | 2,900 | 0.0 | 2,900 | 3,000 | 3.4 | 2,700 | 2,700 | 0.0 |
| Median after-tax income | |||||||||
| Economic families and persons not in an economic family | 63,000 | 63,800 | 1.3 | 63,200 | 65,100 | 3.0Note * | 62,700 | 64,000 | 2.1Note * |
| Economic families | 86,700 | 86,700 | 0.0 | 87,300 | 87,800 | 0.6 | 86,000 | 86,700 | 0.8 |
| Persons not in an economic family | 33,300 | 33,400 | 0.3 | 32,400 | 32,800 | 1.2 | 32,500 | 32,700 | 0.6 |
| Unrevised | Revised | Change | Unrevised | Revised | Change | Unrevised | Revised | Change | |
| % | p.p. | % | p.p. | % | p.p. | ||||
| Percentage of persons in poverty or low income | |||||||||
| Poverty rate (2018-base MBM) | Note ..: not available for a specific reference period | Note ..: not available for a specific reference period | Note ..: not available for a specific reference period | 11.5 | 11.1 | -0.4Note * | 12.4 | 11.9 | -0.5 |
| Poverty rate (2008-base MBM) | 10.2 | 10.1 | -0.1Note * | 9.2 | 8.8 | -0.4Note * | 9.2 | 8.6 | -0.6Note * |
| Low-income rate (LIM-AT) | 12.6 | 12.5 | -0.1 | 11.6 | 11.4 | -0.2Note * | 13.5 | 13.1 | -0.4 |
.. not available for a specific reference period
Source: Statistics Canada, Canadian Income Survey. Tables 11-10-0190-01 and 11-10-0135-01. |
|||||||||
| 2013 | 2016 | 2019 | |||||||
|---|---|---|---|---|---|---|---|---|---|
| Unrevised | Revised | Change | Unrevised | Revised | Change | Unrevised | Revised | Change | |
| 2019 constant dollars |
% | 2019 constant dollars |
% | 2019 constant dollars |
% | ||||
| Median market income | |||||||||
| Economic families and persons not in an economic family | 81,100 | 80,100 | -1.2 | 75,300 | 77,000 | 2.3Note * | 70,600 | 71,900 | 1.8Note * |
| Economic families | 111,300 | 109,100 | -2.0Note * | 102,800 | 104,100 | 1.3 | 102,400 | 105,200 | 2.7 |
| Persons not in an economic family | 40,500 | 40,500 | 0.0 | 35,000 | 35,400 | 1.1 | 36,400 | 36,800 | 1.1 |
| Median government transfers | |||||||||
| Economic families and persons not in an economic family | 1,300 | 1,300 | 0.0 | 3,700 | 3,800 | 2.7 | 5,300 | 5,500 | 3.8 |
| Economic families | 2,700 | 2,700 | 0.0 | 6,300 | 6,200 | -1.6 | 7,500 | 7,600 | 1.3 |
| Persons not in an economic family | 300 | 300 | 0.0 | 400 | 400 | 0.0 | 1,000 | 1,000 | 0.0 |
| Median total income | |||||||||
| Economic families and persons not in an economic family | 90,000 | 87,900 | -2.3Note * | 84,400 | 87,000 | 3.1Note * | 82,400 | 84,000 | 1.9Note * |
| Economic families | 118,800 | 117,600 | -1.0 | 114,900 | 115,900 | 0.9 | 114,900 | 117,800 | 2.5Note * |
| Persons not in an economic family | 44,500 | 44,500 | 0.0 | 41,000 | 41,800 | 2.0 | 41,900 | 42,800 | 2.1 |
| Median income tax | |||||||||
| Economic families and persons not in an economic family | 10,900 | 10,900 | 0.0 | 10,500 | 10,900 | 3.8Note * | 10,200 | 10,400 | 2.0 |
| Economic families | 16,300 | 16,000 | -1.8 | 15,500 | 16,200 | 4.5 | 15,400 | 15,700 | 1.9 |
| Persons not in an economic family | 4,700 | 4,700 | 0.0 | 4,100 | 4,100 | 0.0 | 4,000 | 4,200 | 5.0 |
| Median after-tax income | |||||||||
| Economic families and persons not in an economic family | 76,800 | 76,500 | -0.4 | 74,300 | 75,300 | 1.3 | 72,500 | 73,900 | 1.9Note * |
| Economic families | 101,400 | 100,600 | -0.8 | 98,300 | 99,500 | 1.2Note * | 99,400 | 101,600 | 2.2Note * |
| Persons not in an economic family | 39,400 | 39,400 | 0.0 | 36,400 | 37,200 | 2.2 | 37,500 | 38,100 | 1.6 |
| Unrevised | Revised | Change | Unrevised | Revised | Change | Unrevised | Revised | Change | |
| % | p.p. | % | p.p. | % | p.p. | ||||
| Percentage of persons in poverty or low income | |||||||||
| Poverty rate (2018-base MBM) | Note ..: not available for a specific reference period | Note ..: not available for a specific reference period | Note ..: not available for a specific reference period | 10.8 | 10.1 | -0.7Note * | 8.2 | 7.7 | -0.5 |
| Poverty rate (2008-base MBM) | 7.9 | 8.2 | 0.3Note * | 8.6 | 8.0 | -0.6Note * | 6.3 | 6.0 | -0.3 |
| Low-income rate (LIM-AT) | 7.8 | 8.1 | 0.3Note * | 8.1 | 7.4 | -0.7Note * | 7.1 | 6.7 | -0.4 |
.. not available for a specific reference period
Source: Statistics Canada, Canadian Income Survey. Tables 11-10-0190-01 and 11-10-0135-01. |
|||||||||
| 2013 | 2016 | 2019 | |||||||
|---|---|---|---|---|---|---|---|---|---|
| Unrevised | Revised | Change | Unrevised | Revised | Change | Unrevised | Revised | Change | |
| 2019 constant dollars |
% | 2019 constant dollars |
% | 2019 constant dollars |
% | ||||
| Median market income | |||||||||
| Economic families and persons not in an economic family | 56,300 | 55,800 | -0.9 | 55,100 | 53,100 | -3.6Note * | 61,300 | 57,000 | -7.0Note * |
| Economic families | 81,400 | 81,400 | 0.0 | 83,300 | 82,300 | -1.2 | 91,800 | 89,500 | -2.5Note * |
| Persons not in an economic family | 26,900 | 26,800 | -0.4 | 24,700 | 23,700 | -4.0 | 27,700 | 26,200 | -5.4Note * |
| Median government transfers | |||||||||
| Economic families and persons not in an economic family | 4,300 | 4,200 | -2.3 | 6,000 | 5,900 | -1.7 | 5,400 | 5,300 | -1.9 |
| Economic families | 6,400 | 6,600 | 3.1 | 8,300 | 8,500 | 2.4 | 7,900 | 8,100 | 2.5 |
| Persons not in an economic family | 700 | 600 | -14.3 | 600 | 600 | 0.0 | 1,300 | 1,200 | -7.7 |
| Median total income | |||||||||
| Economic families and persons not in an economic family | 66,500 | 65,300 | -1.8Note * | 66,300 | 64,200 | -3.2Note * | 73,600 | 70,600 | -4.1Note * |
| Economic families | 92,700 | 92,900 | 0.2 | 97,300 | 96,300 | -1.0 | 103,100 | 101,400 | -1.6Note * |
| Persons not in an economic family | 34,900 | 34,500 | -1.1 | 32,500 | 31,700 | -2.5 | 36,000 | 34,600 | -3.9 |
| Median income tax | |||||||||
| Economic families and persons not in an economic family | 6,200 | 6,000 | -3.2Note * | 5,900 | 5,500 | -6.8Note * | 7,100 | 6,500 | -8.5Note * |
| Economic families | 9,700 | 9,700 | 0.0 | 10,400 | 10,300 | -1.0 | 12,100 | 11,800 | -2.5Note * |
| Persons not in an economic family | 2,400 | 2,300 | -4.2 | 1,900 | 1,800 | -5.3 | 2,600 | 2,400 | -7.7 |
| Median after-tax income | |||||||||
| Economic families and persons not in an economic family | 59,700 | 59,200 | -0.8 | 60,200 | 58,300 | -3.2Note * | 65,700 | 62,600 | -4.7Note * |
| Economic families | 82,300 | 82,300 | 0.0 | 87,000 | 86,300 | -0.8 | 90,100 | 89,400 | -0.8 |
| Persons not in an economic family | 31,700 | 31,500 | -0.6 | 30,100 | 29,500 | -2.0 | 32,200 | 32,000 | -0.6 |
| Unrevised | Revised | Change | Unrevised | Revised | Change | Unrevised | Revised | Change | |
| % | p.p. | % | p.p. | % | p.p. | ||||
| Percentage of persons in poverty or low income | |||||||||
| Poverty rate (2018-base MBM) | Note ..: not available for a specific reference period | Note ..: not available for a specific reference period | Note ..: not available for a specific reference period | 15.3 | 16.0 | 0.7Note * | 10.8 | 11.9 | 1.1Note * |
| Poverty rate (2008-base MBM) | 13.0 | 13.1 | 0.1Note * | 12.0 | 12.7 | 0.7Note * | 7.6 | 8.6 | 1.0Note * |
| Low-income rate (LIM-AT) | 14.2 | 14.3 | 0.1 | 12.9 | 13.4 | 0.5Note * | 10.8 | 11.5 | 0.7Note * |
.. not available for a specific reference period
Source: Statistics Canada, Canadian Income Survey. Tables 11-10-0190-01 and 11-10-0135-01. |
|||||||||
- Date modified: