
Income Research Paper Series
Experimental estimates of family weekly income, January 2020 to March 2021
Skip to text
Text begins
Introduction
This note describes updates to the experimental estimates of family weekly income previously described in March 2021. Readers are advised to refer to the previous releases for additional context, analysis and caveats.
What’s new in this version?
The scope of the estimate is expanded in terms of population and time frame.
- the period covered is extended to March 2021
- results are presented which break down results by province, family type, gender, visible minority, Indigenous status and landed immigrant status
The results continue to exclude families with members aged 65 and over.
Definitions of family weekly income
For the purposes of the July 2021 update of these experimental estimates, family weekly income is comprised of
- Estimated weekly wages and salaries
- Estimated self-employment income
- GST/HST credits
- Canada and provincial child benefits
- Employment insurance benefits
- Canada Emergency Response Benefit (CERB), Canada Emergency Student Benefit (CESB), Canada Recovery Benefit (CRB), Canada Recovery Sickness Benefit (CRSB) and Canada Recovery Caregiving Benefit (CRCB)Note
Family weekly earnings is comprised of
- Estimated weekly wages and salaries
- Estimated self-employment incomeNote
All income sources are expressed as weekly amounts.
Concepts used to define weekly low income status
For the July 2021 update of these experimental family weekly income estimates, two concepts are used to describe weekly low-income status. The share of the population with weekly family earnings below the provincial threshold appropriate to their family size is referred to as having “low weekly earnings” and the share of the population with weekly family income below the threshold appropriate to their family size is referred to as having “low weekly income”.Note National figures are the total percentage of individuals below their respective provincial thresholds.
Values of median adjusted family weekly earnings and adjusted family weekly income of persons are also provided. Adjusted values are determined by dividing family earnings (or income) by the square root of family size, and assigning this value to all members of the family. The result is a single-person equivalent earnings or income measure that takes into account economies of scale associated with larger family sizes.
Data is disaggregated according to province, gender, family type and for population groups designated as visible minorities, by Indigenous identity and landed immigrant status.
Results
The outbreak of the COVID-19 pandemic disrupted the labor market with a degree of intensity and speed that was never seen before, resulting in the loss of over 3 million jobs in Canada in the month that followedNote. Rapidly, extensive pandemic assistance benefits were put in place by the federal government to soften the economic burden of the crisis that confronted Canadian families.
Evidence suggests that COVID-19 benefits limited the impact of job and income losses for many Canadian families, particularly those in the middle to lower end of the income scale. The data also suggest that the overall rate of low-income, which rose sharply at the beginning of the COVID-19 pandemic, stabilized and returned to pre-pandemic levels by August.
The rate of low-income stabilized below pre-pandemic levels
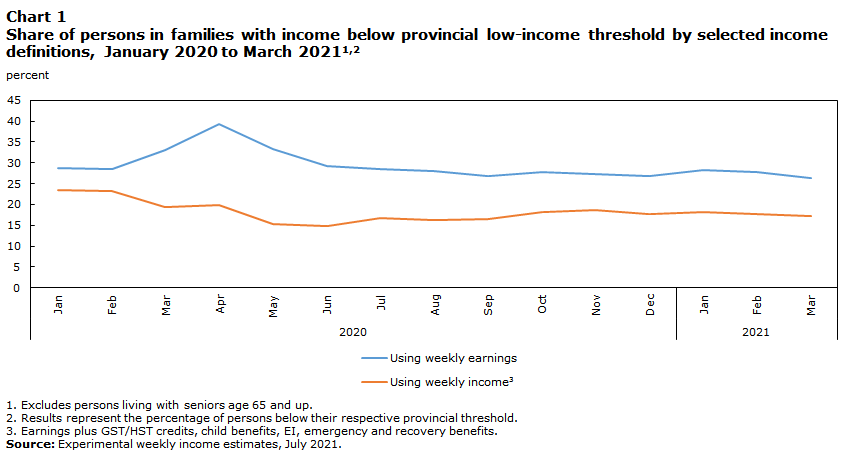
On an earnings basis a rapid increase in low-income rates took place beginning in March and peaked in April 2020. In the months that followed, the number of families in low-income stabilized and returned to levels comparable to the two months prior to the COVID-19 pandemic levelsNote.
On a family income basis, the share of Canadian families in low-income declined as early as March which demonstrated the rapid rollout of emergency benefits. By June, 14.8% of persons in families were below the low income threshold, down from 23.3% in February. Despite a slight upward trend through the second half of 2020, the share of persons in low-income families stabilized below pre-pandemic levels where it has remained through to March 2021.
Data table for Chart 1
| Population 0 to 64 years old | ||
|---|---|---|
| Using weekly earnings | Using weekly incomeData table for Chart 1 Note 3 | |
| percent | ||
| 2020 | ||
| Jan | 28.7 | 23.4 |
| Feb | 28.4 | 23.3 |
| Mar | 33.1 | 19.5 |
| Apr | 39.3 | 19.8 |
| May | 33.4 | 15.2 |
| Jun | 29.2 | 14.8 |
| Jul | 28.6 | 16.8 |
| Aug | 28.0 | 16.3 |
| Sep | 26.8 | 16.4 |
| Oct | 27.7 | 18.3 |
| Nov | 27.4 | 18.7 |
| Dec | 26.9 | 17.7 |
| 2021 | ||
| Jan | 28.3 | 18.3 |
| Feb | 27.7 | 17.6 |
| Mar | 26.3 | 17.2 |
|
||
Impact of the COVID-19 pandemic on the economic situation of immigrants
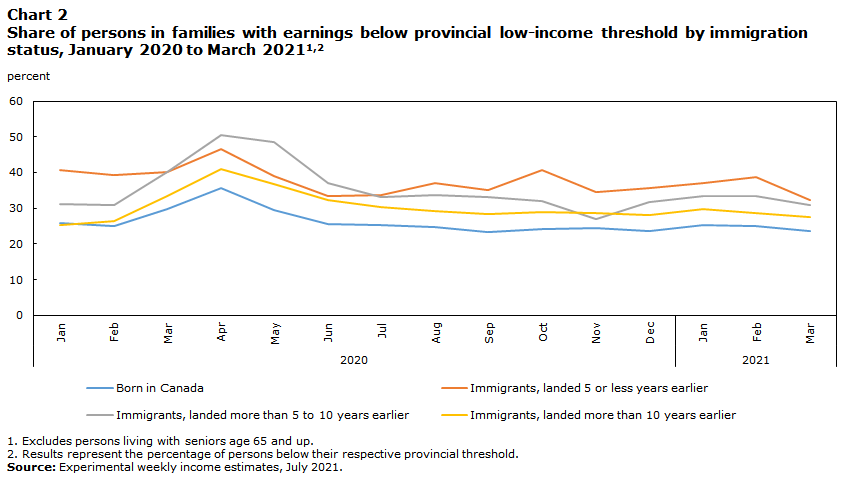
For this report, we use the Labour Force Survey definitions for immigrant status, grouping individuals into one of four groups: those born in Canada, very recent immigrants (those who obtained landed immigrant status 5 or less years ago), recent immigrants (those who obtained landed immigrant status between 5 and 10 years ago), and established immigrants (those who obtained landed immigrant status more than 10 years ago).
During the initial months of the pandemic, recent immigrants had the largest change in the share of persons with low weekly earnings, increasing from 30.9% in February 2020 to 50.6% in April 2020. The low-income rate for this group remained elevated for two months before decreasing to near pre-pandemic levels by July. By comparison, very recent immigrants, which originally had the largest share of persons below the low-income threshold, had its share increase to 46.5% in April and returned to pre-pandemic levels the following month.
Expanding the low-income concept to adjusted family income, the introduction of the Canada Emergency Response Benefit (CERB) and other emergency programs minimized the differences between landed immigrants and persons born in Canada. In January 2020, low weekly income rate ranged between 21.2% and 33.8%. By May 2020, this range was reduced to between 15.6% and 17.3%. Following, the end of the CERB, a modest increase in low-income rate was seen among very recent immigrants while rates remained relatively stable among other groups.
Data table for Chart 2
| Born in Canada | Immigrants, landed 5 or less years earlier | Immigrants, landed more than 10 years earlier | Immigrants, landed more than 5 to 10 years earlier | |
|---|---|---|---|---|
| percent | ||||
| 2020 | ||||
| Jan | 26.0 | 40.6 | 25.2 | 31.2 |
| Feb | 25.1 | 39.4 | 26.3 | 30.9 |
| Mar | 29.8 | 40.1 | 33.3 | 40.1 |
| Apr | 35.6 | 46.5 | 41.1 | 50.6 |
| May | 29.5 | 39.0 | 36.8 | 48.4 |
| Jun | 25.7 | 33.4 | 32.2 | 37.1 |
| Jul | 25.3 | 33.8 | 30.4 | 33.1 |
| Aug | 24.7 | 37.0 | 29.2 | 33.7 |
| Sep | 23.4 | 35.2 | 28.3 | 33.1 |
| Oct | 24.2 | 40.7 | 29.1 | 32.0 |
| Nov | 24.5 | 34.6 | 28.8 | 26.9 |
| Dec | 23.6 | 35.7 | 28.1 | 31.7 |
| 2021 | ||||
| Jan | 25.3 | 37.2 | 29.7 | 33.4 |
| Feb | 25.1 | 38.8 | 28.6 | 33.3 |
| Mar | 23.5 | 32.2 | 27.5 | 30.9 |
|
||||

Data table for Chart 3
| Born in Canada | Immigrants, landed 5 or less years earlier | Immigrants, landed more than 10 years earlier | Immigrants, landed more than 5 to 10 years earlier | |
|---|---|---|---|---|
| percent | ||||
| 2020 | ||||
| Jan | 22.0 | 33.8 | 21.2 | 24.8 |
| Feb | 21.4 | 33.0 | 22.2 | 24.7 |
| Mar | 18.9 | 23.3 | 17.9 | 18.4 |
| Apr | 19.0 | 24.7 | 17.6 | 21.1 |
| May | 15.6 | 17.3 | 15.8 | 16.0 |
| Jun | 14.8 | 15.5 | 13.9 | 11.0 |
| Jul | 16.2 | 18.9 | 15.4 | 15.2 |
| Aug | 15.4 | 18.9 | 15.3 | 16.7 |
| Sep | 15.8 | 17.8 | 15.3 | 17.1 |
| Oct | 17.3 | 24.1 | 18.1 | 17.9 |
| Nov | 17.6 | 23.8 | 19.5 | 16.8 |
| Dec | 16.5 | 23.3 | 17.3 | 17.8 |
| 2021 | ||||
| Jan | 17.5 | 24.2 | 18.1 | 18.9 |
| Feb | 17.0 | 25.9 | 16.7 | 20.7 |
| Mar | 16.5 | 20.5 | 16.5 | 18.4 |
|
||||
Impact of the COVID-19 pandemic on low-income rates of persons in visible minority groups
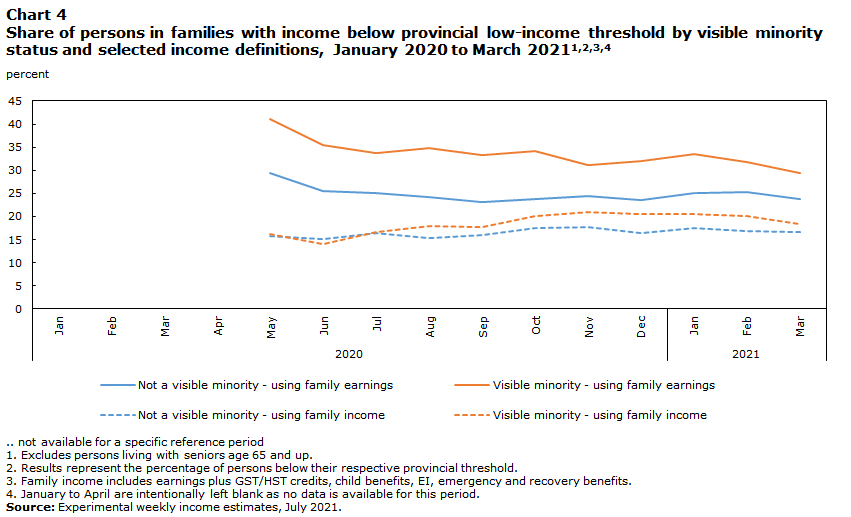
For people who identify as a member of a visible minority group, the economic situation based on family earnings has improved in the second half of 2020, a trend that continues into 2021. In May 2020, 41.1% of persons in a visible minority group lived in a family with low weekly earnings. By the end of the year, this share of persons had fallen to 32.1%. For the first three months of 2021, this rate decreased from 33.6% in January 2021 to 29.3% in March 2021. Meanwhile, persons not belonging to a visible minority group have also seen their economic situation improve during this same period, with their rate based on family earnings declining from 29.3% in May 2020 to 23.7% in March 2021. The rate differential between the two groups has also narrowed from a gap of 11.8 percentage points in May 2020 to a gap of 5.6 percentage points in March 2021.
Data table for Chart 4
| Not a visible minority - using family earnings | Visible minority - using family earnings | Not a visible minority - using family income | Visible minority - using family income | |
|---|---|---|---|---|
| percent | ||||
| 2020 | ||||
| Jan | Note ..: not available for a specific reference period | Note ..: not available for a specific reference period | Note ..: not available for a specific reference period | Note ..: not available for a specific reference period |
| Feb | Note ..: not available for a specific reference period | Note ..: not available for a specific reference period | Note ..: not available for a specific reference period | Note ..: not available for a specific reference period |
| Mar | Note ..: not available for a specific reference period | Note ..: not available for a specific reference period | Note ..: not available for a specific reference period | Note ..: not available for a specific reference period |
| Apr | Note ..: not available for a specific reference period | Note ..: not available for a specific reference period | Note ..: not available for a specific reference period | Note ..: not available for a specific reference period |
| May | 29.3 | 41.1 | 15.8 | 16.2 |
| Jun | 25.5 | 35.5 | 15.1 | 14.1 |
| Jul | 25.2 | 33.7 | 16.5 | 16.7 |
| Aug | 24.1 | 34.8 | 15.4 | 18.0 |
| Sep | 23.1 | 33.3 | 15.9 | 17.8 |
| Oct | 23.8 | 34.1 | 17.4 | 20.1 |
| Nov | 24.5 | 31.2 | 17.8 | 21.0 |
| Dec | 23.6 | 32.1 | 16.5 | 20.5 |
| 2021 | ||||
| Jan | 25.1 | 33.6 | 17.5 | 20.6 |
| Feb | 25.2 | 31.8 | 16.9 | 20.2 |
| Mar | 23.7 | 29.3 | 16.7 | 18.3 |
.. not available for a specific reference period
|
||||
Caveats
The estimates presented in this note make use of the data available at this time. The addition of families with self-employed members that was achieved in the previous release significantly improved population coverage, and this coverage was maintained in the current release. However, families with aged 65 or older are still excluded from this estimate.
While the CERB and EI benefits amounts are now derived entirely from administrative data, the other benefits listed in this note are still based on the responses provided by respondents. Furthermore, other sources of revenue, such as investment or interest income, and provincial social assistance, remain unaccounted for. As such, it is important to point out that the results here are preliminary and users are advised to use caution when interpreting the results.
Description of tables
Tables 1 to 4 provide a further breakdown of the situation by: province, gender, family type, visible minority and indigenous status.
For all tables, there are two populations targeted:
- Persons aged 0 to 64 are available for province, gender and family type
- Persons aged 15 to 64 are available for visible minority status, Indigenous identity and immigration status
From July 2020, a section was added to the LFS asking respondents which population groups they belonged to. Some respondent information was able to be carried back in time so that results for those groups could be presented here beginning in May. This proved to be the case for visible minorities as a whole, but less so for the more detailed groups of South Asian, Chinese and Black which were included for this study.
Table 1 and 2 can be used to compare the share of persons below the provincial low income threshold based on the income concept of family earnings (Table 1) and family income (Table 2).
Similarly, Tables 3 and 4 can be used to compare the adjusted median weekly family earnings (Table 3) and family income (Table 4).
| Family earnings alone | Share of persons in families below provincial low-income thresholds, family earnings | ||||||||||||||
|---|---|---|---|---|---|---|---|---|---|---|---|---|---|---|---|
| 2020 | 2021 | ||||||||||||||
| January | February | March | April | May | June | July | August | September | October | November | December | January | February | March | |
| percent | |||||||||||||||
| Population 0 to 64 years old | 28.7 | 28.4 | 33.1 | 39.3 | 33.4 | 29.2 | 28.6 | 28.0 | 26.8 | 27.7 | 27.4 | 26.9 | 28.3 | 27.7 | 26.3 |
| Newfoundland and Labrador | 38.7 | 35.4 | 39.3 | 45.5 | 39.9 | 33.2 | 33.7 | 31.1 | 29.9 | 30.4 | 31.7 | 32.4 | 33.1 | 38.3 | 35.2 |
| Prince Edward Island | 32.2 | 32.6 | 38.1 | 41.9 | 31.6 | 28.3 | 28.7 | 26.0 | 27.3 | 24.4 | 29.6 | 27.9 | 28.5 | 34.3 | 32.8 |
| Nova Scotia | 32.8 | 33.4 | 34.6 | 38.3 | 35.7 | 31.5 | 30.2 | 29.2 | 30.1 | 27.9 | 29.2 | 27.9 | 28.0 | 31.2 | 28.2 |
| New Brunswick | 31.0 | 29.1 | 33.8 | 36.9 | 31.9 | 27.3 | 27.2 | 25.3 | 24.0 | 25.5 | 26.6 | 25.8 | 30.1 | 29.5 | 28.1 |
| Quebec | 26.0 | 26.1 | 31.7 | 42.0 | 31.5 | 23.9 | 25.1 | 25.0 | 24.3 | 24.8 | 25.1 | 25.0 | 26.2 | 26.3 | 24.4 |
| Ontario | 27.9 | 28.3 | 33.7 | 39.1 | 34.9 | 31.8 | 29.0 | 29.0 | 27.8 | 28.3 | 27.2 | 27.2 | 29.5 | 27.5 | 26.5 |
| Manitoba | 28.4 | 27.3 | 29.4 | 34.2 | 33.5 | 27.8 | 28.6 | 28.8 | 26.0 | 29.2 | 29.7 | 28.4 | 27.5 | 28.3 | 24.4 |
| Saskatchewan | 31.5 | 31.7 | 32.7 | 36.6 | 34.2 | 27.9 | 27.5 | 28.5 | 25.8 | 27.1 | 29.4 | 30.1 | 26.6 | 28.7 | 28.6 |
| Alberta | 30.0 | 28.2 | 32.7 | 37.5 | 32.5 | 30.3 | 31.5 | 29.2 | 28.8 | 30.8 | 29.0 | 28.7 | 28.5 | 27.2 | 26.1 |
| British Columbia | 31.4 | 30.1 | 34.3 | 38.7 | 32.1 | 29.7 | 30.7 | 29.0 | 26.2 | 27.3 | 28.4 | 26.1 | 27.9 | 28.3 | 27.4 |
| Men | 28.2 | 27.7 | 32.3 | 38.8 | 33.3 | 28.4 | 27.7 | 27.0 | 26.1 | 26.6 | 26.5 | 26.0 | 28.1 | 27.3 | 25.9 |
| Women | 29.2 | 29.0 | 34.0 | 39.8 | 33.6 | 29.9 | 29.6 | 29.1 | 27.5 | 28.7 | 28.3 | 27.8 | 28.4 | 28.0 | 26.6 |
| In couple families with kids | 22.6 | 22.4 | 27.0 | 33.2 | 28.6 | 23.9 | 23.0 | 22.5 | 21.4 | 22.1 | 21.4 | 20.4 | 21.4 | 21.4 | 20.6 |
| In couple families without kids | 22.7 | 22.0 | 26.5 | 32.7 | 28.6 | 25.5 | 24.1 | 23.8 | 21.4 | 22.0 | 22.9 | 22.3 | 23.2 | 23.5 | 21.3 |
| In single parent families | 49.5 | 48.7 | 54.9 | 60.9 | 53.7 | 49.5 | 51.2 | 49.3 | 46.0 | 49.4 | 48.2 | 50.7 | 52.1 | 49.4 | 47.1 |
| In other family types | 29.8 | 31.1 | 36.5 | 41.7 | 38.6 | 35.4 | 31.9 | 31.1 | 36.0 | 34.5 | 31.7 | 33.6 | 38.7 | 35.4 | 30.6 |
| UnattachedTable 1 Note 3 | 43.9 | 43.7 | 49.0 | 55.4 | 48.1 | 42.1 | 43.5 | 42.8 | 41.4 | 42.1 | 42.6 | 41.9 | 43.2 | 42.3 | 41.4 |
| Population 15 to 64 years oldTable 1 Note 4 Table 1 Note 5 | 27.5 | 27.1 | 32.0 | 38.3 | 32.3 | 28.1 | 27.4 | 26.9 | 25.8 | 26.5 | 26.2 | 25.8 | 27.4 | 27.0 | 25.2 |
| IndigenousTable 1 Note 6 | 41.0 | 39.3 | 39.9 | 47.0 | 39.9 | 34.2 | 36.1 | 35.6 | 34.9 | 37.9 | 42.9 | 41.4 | 38.2 | 36.3 | 33.3 |
| First Nations | 45.8 | 44.2 | 44.0 | 50.6 | 42.1 | 41.2 | 46.4 | 44.4 | 41.5 | 45.6 | 47.3 | 43.8 | 43.7 | 43.1 | 39.0 |
| Métis | 36.1 | 34.5 | 35.0 | 42.9 | 36.8 | 27.7 | 27.2 | 27.8 | 27.7 | 30.5 | 38.8 | 38.6 | 32.5 | 28.9 | 27.1 |
| Inuit | Note F: too unreliable to be published | Note F: too unreliable to be published | Note F: too unreliable to be published | Note F: too unreliable to be published | Note F: too unreliable to be published | Note F: too unreliable to be published | Note F: too unreliable to be published | Note F: too unreliable to be published | Note F: too unreliable to be published | Note F: too unreliable to be published | Note F: too unreliable to be published | Note F: too unreliable to be published | Note F: too unreliable to be published | Note F: too unreliable to be published | Note F: too unreliable to be published |
| Non-Indigenous | 27.1 | 26.7 | 31.8 | 38.0 | 32.1 | 27.9 | 27.1 | 26.6 | 25.5 | 26.1 | 25.6 | 25.3 | 27.0 | 26.6 | 24.9 |
| Visible minorityTable 1 Note 7 | Note ..: not available for a specific reference period | Note ..: not available for a specific reference period | Note ..: not available for a specific reference period | Note ..: not available for a specific reference period | 41.1 | 35.5 | 33.7 | 34.8 | 33.3 | 34.1 | 31.2 | 32.1 | 33.6 | 31.8 | 29.3 |
| South Asian | Note ..: not available for a specific reference period | Note ..: not available for a specific reference period | Note ..: not available for a specific reference period | Note ..: not available for a specific reference period | 39.9 | 32.0 | 30.7 | 30.7 | 31.5 | 34.3 | 28.5 | 28.4 | 30.9 | 28.1 | 28.9 |
| Chinese | Note ..: not available for a specific reference period | Note ..: not available for a specific reference period | Note ..: not available for a specific reference period | Note ..: not available for a specific reference period | 39.3 | 39.9 | 38.4 | 37.9 | 37.8 | 37.6 | 37.2 | 33.0 | 33.4 | 36.7 | 35.5 |
| Black | Note ..: not available for a specific reference period | Note ..: not available for a specific reference period | Note ..: not available for a specific reference period | Note ..: not available for a specific reference period | 50.9 | 41.6 | 35.5 | 37.7 | 33.1 | 38.5 | 31.8 | 36.6 | 38.5 | 37.0 | 32.8 |
| Not a visible minority | Note ..: not available for a specific reference period | Note ..: not available for a specific reference period | Note ..: not available for a specific reference period | Note ..: not available for a specific reference period | 29.3 | 25.5 | 25.2 | 24.1 | 23.1 | 23.8 | 24.5 | 23.6 | 25.1 | 25.2 | 23.7 |
| Landed immigrantsTable 1 Note 8 | 29.1 | 29.7 | 35.8 | 43.8 | 39.3 | 33.2 | 31.5 | 31.3 | 30.3 | 31.4 | 29.4 | 30.3 | 31.7 | 31.0 | 28.9 |
| Immigrant, landed more than 10 years ago | 25.2 | 26.3 | 33.3 | 41.1 | 36.8 | 32.2 | 30.4 | 29.2 | 28.3 | 29.1 | 28.8 | 28.1 | 29.7 | 28.6 | 27.5 |
| Immigrant, landed 6 to 10 years ago | 31.2 | 30.9 | 40.1 | 50.6 | 48.4 | 37.1 | 33.1 | 33.7 | 33.1 | 32.0 | 26.9 | 31.7 | 33.4 | 33.3 | 30.9 |
| Immigrant, landed 5 or less years ago | 40.6 | 39.4 | 40.1 | 46.5 | 39.0 | 33.4 | 33.8 | 37.0 | 35.2 | 40.7 | 34.6 | 35.7 | 37.2 | 38.8 | 32.2 |
| Born in Canada | 26.0 | 25.1 | 29.8 | 35.6 | 29.5 | 25.7 | 25.3 | 24.7 | 23.4 | 24.2 | 24.5 | 23.6 | 25.3 | 25.1 | 23.5 |
|
.. not available for a specific reference period F too unreliable to be published
|
|||||||||||||||
| Family earnings plus GST/HST credit, child benefits, EI, emergency and recovery benefits | Share of persons in families below provincial low-income thresholds, family income | ||||||||||||||
|---|---|---|---|---|---|---|---|---|---|---|---|---|---|---|---|
| 2020 | 2021 | ||||||||||||||
| January | February | March | April | May | June | July | August | September | October | November | December | January | February | March | |
| percent | |||||||||||||||
| Population 0 to 64 years old | 23.4 | 23.3 | 19.5 | 19.8 | 15.2 | 14.8 | 16.8 | 16.3 | 16.4 | 18.3 | 18.7 | 17.7 | 18.3 | 17.6 | 17.2 |
| Newfoundland and Labrador | 26.7 | 25.1 | 20.6 | 23.0 | 20.0 | 16.7 | 18.8 | 18.9 | 15.8 | 16.9 | 18.2 | 17.2 | 16.7 | 20.7 | 18.9 |
| Prince Edward Island | 22.1 | 21.5 | 18.7 | 17.8 | 13.3 | 13.6 | 15.2 | 15.6 | 14.1 | 13.6 | 16.0 | 15.0 | 13.5 | 13.5 | 15.5 |
| Nova Scotia | 25.5 | 25.4 | 21.3 | 18.4 | 16.7 | 14.7 | 17.1 | 14.7 | 17.7 | 19.7 | 19.3 | 17.1 | 17.9 | 17.9 | 16.8 |
| New Brunswick | 21.9 | 20.1 | 18.0 | 16.7 | 14.3 | 13.3 | 15.5 | 14.0 | 15.6 | 17.2 | 16.5 | 14.4 | 14.7 | 15.1 | 14.6 |
| Quebec | 20.3 | 20.6 | 17.5 | 19.0 | 13.8 | 11.6 | 13.6 | 13.6 | 13.7 | 15.0 | 16.0 | 15.0 | 16.3 | 15.1 | 14.3 |
| Ontario | 22.7 | 23.5 | 19.6 | 19.8 | 15.6 | 15.3 | 16.7 | 16.7 | 16.9 | 19.4 | 19.1 | 18.6 | 19.1 | 17.9 | 17.8 |
| Manitoba | 23.0 | 22.3 | 16.7 | 16.8 | 14.7 | 12.4 | 16.4 | 16.8 | 14.8 | 17.9 | 18.6 | 16.6 | 15.7 | 17.2 | 15.7 |
| Saskatchewan | 25.5 | 26.2 | 20.7 | 19.8 | 15.7 | 15.2 | 17.8 | 16.1 | 17.9 | 18.9 | 21.3 | 20.4 | 18.3 | 18.6 | 20.0 |
| Alberta | 25.9 | 23.1 | 20.2 | 20.4 | 16.6 | 16.4 | 18.8 | 17.9 | 18.5 | 20.0 | 20.1 | 20.3 | 20.8 | 18.6 | 18.1 |
| British Columbia | 27.3 | 27.0 | 22.6 | 21.7 | 14.8 | 17.7 | 20.7 | 18.5 | 17.5 | 19.0 | 20.4 | 17.9 | 18.8 | 20.4 | 19.4 |
| Men | 23.1 | 22.8 | 19.2 | 19.5 | 14.6 | 14.4 | 16.3 | 15.5 | 15.9 | 17.5 | 18.2 | 17.0 | 18.3 | 17.2 | 16.9 |
| Women | 23.7 | 23.8 | 19.9 | 20.0 | 15.9 | 15.2 | 17.4 | 17.1 | 16.9 | 19.1 | 19.2 | 18.4 | 18.4 | 18.0 | 17.4 |
| In couple families with kids | 16.0 | 15.8 | 13.0 | 12.9 | 8.4 | 8.7 | 10.6 | 10.2 | 10.2 | 12.0 | 12.2 | 11.0 | 11.6 | 11.6 | 11.1 |
| In couple families without kids | 20.5 | 20.0 | 18.3 | 19.1 | 18.9 | 16.6 | 17.6 | 17.4 | 16.8 | 17.3 | 18.8 | 17.6 | 17.1 | 16.9 | 15.9 |
| In single parent families | 39.8 | 39.7 | 34.9 | 35.9 | 26.3 | 28.4 | 33.7 | 29.8 | 28.1 | 35.2 | 33.3 | 35.2 | 36.1 | 31.9 | 31.5 |
| In other family types | 25.9 | 27.8 | 19.8 | 21.0 | 24.2 | 17.7 | 15.9 | 18.1 | 21.5 | 22.1 | 19.3 | 19.9 | 23.4 | 22.7 | 19.1 |
| UnattachedTable 2 Note 3 | 41.3 | 41.5 | 34.9 | 34.4 | 29.2 | 28.5 | 31.9 | 31.1 | 32.2 | 33.4 | 35.1 | 32.8 | 33.7 | 32.3 | 33.5 |
| Population 15 to 64 years oldTable 2 Note 4 Table 2 Note 5 | 23.3 | 23.1 | 19.5 | 19.7 | 15.9 | 14.8 | 16.5 | 16.1 | 16.4 | 18.1 | 18.6 | 17.6 | 18.3 | 17.8 | 17.1 |
| IndigenousTable 2 Note 6 | 34.2 | 33.0 | 24.7 | 26.3 | 24.5 | 21.0 | 26.0 | 24.7 | 22.2 | 29.5 | 31.6 | 28.2 | 26.1 | 26.1 | 23.2 |
| First Nations | 38.9 | 37.2 | 27.2 | 30.3 | 25.2 | 26.5 | 33.3 | 31.1 | 24.8 | 36.7 | 38.2 | 30.4 | 28.1 | 31.5 | 29.4 |
| Métis | 29.4 | 28.7 | 21.8 | 21.6 | Note F: too unreliable to be published | 15.5 | 19.7 | 18.9 | 19.9 | 22.5 | 25.2 | 25.5 | 24.0 | 20.2 | 16.4 |
| Inuit | Note F: too unreliable to be published | Note F: too unreliable to be published | Note F: too unreliable to be published | Note F: too unreliable to be published | Note F: too unreliable to be published | Note F: too unreliable to be published | Note F: too unreliable to be published | Note F: too unreliable to be published | Note F: too unreliable to be published | Note F: too unreliable to be published | Note F: too unreliable to be published | Note F: too unreliable to be published | Note F: too unreliable to be published | Note F: too unreliable to be published | Note F: too unreliable to be published |
| Non-Indigenous | 23.0 | 22.8 | 19.3 | 19.5 | 15.6 | 14.6 | 16.2 | 15.8 | 16.2 | 17.7 | 18.2 | 17.2 | 18.1 | 17.5 | 16.9 |
| Visible minorityTable 2 Note 7 | Note ..: not available for a specific reference period | Note ..: not available for a specific reference period | Note ..: not available for a specific reference period | Note ..: not available for a specific reference period | 16.2 | 14.1 | 16.7 | 18.0 | 17.8 | 20.1 | 21.0 | 20.5 | 20.6 | 20.2 | 18.3 |
| South Asian | Note ..: not available for a specific reference period | Note ..: not available for a specific reference period | Note ..: not available for a specific reference period | Note ..: not available for a specific reference period | Note F: too unreliable to be published | Note F: too unreliable to be published | 15.2 | 16.3 | 13.9 | 19.5 | 18.9 | 19.1 | 18.8 | 19.2 | 17.3 |
| Chinese | Note ..: not available for a specific reference period | Note ..: not available for a specific reference period | Note ..: not available for a specific reference period | Note ..: not available for a specific reference period | Note F: too unreliable to be published | 22.4 | 23.3 | 21.7 | 24.4 | 23.3 | 26.0 | 20.1 | 19.7 | 26.0 | 23.7 |
| Black | Note ..: not available for a specific reference period | Note ..: not available for a specific reference period | Note ..: not available for a specific reference period | Note ..: not available for a specific reference period | Note F: too unreliable to be published | Note F: too unreliable to be published | 16.1 | 15.1 | 17.5 | 23.0 | 22.6 | 23.5 | 22.3 | 22.2 | 19.5 |
| Not a visible minority | Note ..: not available for a specific reference period | Note ..: not available for a specific reference period | Note ..: not available for a specific reference period | Note ..: not available for a specific reference period | 15.8 | 15.1 | 16.5 | 15.4 | 15.9 | 17.4 | 17.8 | 16.5 | 17.5 | 16.9 | 16.7 |
| Landed immigrantsTable 2 Note 8 | 24.2 | 24.7 | 19.0 | 19.5 | 16.0 | 13.6 | 15.9 | 16.1 | 16.1 | 18.9 | 19.7 | 18.6 | 19.4 | 18.9 | 17.6 |
| Immigrant, landed more than 10 years ago | 21.2 | 22.2 | 17.9 | 17.6 | 15.8 | 13.9 | 15.4 | 15.3 | 15.3 | 18.1 | 19.5 | 17.3 | 18.1 | 16.7 | 16.5 |
| Immigrant, landed 6 to 10 years ago | 24.8 | 24.7 | 18.4 | 21.1 | Note F: too unreliable to be published | 11.0 | 15.2 | 16.7 | 17.1 | 17.9 | 16.8 | 17.8 | 18.9 | 20.7 | 18.4 |
| Immigrant, landed 5 or less years ago | 33.8 | 33.0 | 23.3 | 24.7 | Note F: too unreliable to be published | 15.5 | 18.9 | 18.9 | 17.8 | 24.1 | 23.8 | 23.3 | 24.2 | 25.9 | 20.5 |
| Born in Canada | 22.0 | 21.4 | 18.9 | 19.0 | 15.6 | 14.8 | 16.2 | 15.4 | 15.8 | 17.3 | 17.6 | 16.5 | 17.5 | 17.0 | 16.5 |
|
.. not available for a specific reference period F too unreliable to be published
|
|||||||||||||||
| Family earnings alone | Median adjusted weekly family earnings | ||||||||||||||
|---|---|---|---|---|---|---|---|---|---|---|---|---|---|---|---|
| 2020 | 2021 | ||||||||||||||
| January | February | March | April | May | June | July | August | September | October | November | December | January | February | March | |
| current dollars | |||||||||||||||
| Population 0 to 64 years old | 860 | 875 | 793 | 684 | 811 | 867 | 866 | 880 | 919 | 879 | 881 | 918 | 888 | 886 | 933 |
| Newfoundland and Labrador | 703 | 743 | 665 | 525 | Note F: too unreliable to be published | 776 | 742 | 757 | 817 | 767 | 750 | 804 | 748 | 688 | 727 |
| Prince Edward Island | 712 | 739 | 600 | 577 | 655 | 777 | 731 | 739 | 798 | 713 | 699 | 769 | 716 | 658 | 700 |
| Nova Scotia | 714 | 712 | 665 | 612 | 644 | 731 | 720 | 755 | 749 | 748 | 730 | 769 | 768 | 744 | 799 |
| New Brunswick | 718 | 722 | 658 | 593 | 705 | 830 | 790 | 823 | 842 | 842 | 731 | 828 | 734 | 723 | 800 |
| Quebec | 815 | 843 | 744 | 585 | 771 | 891 | 877 | 874 | 888 | 833 | 861 | 868 | 857 | 840 | 867 |
| Ontario | 916 | 911 | 825 | 734 | 824 | 884 | 889 | 905 | 952 | 930 | 943 | 969 | 926 | 946 | 978 |
| Manitoba | 777 | 782 | 733 | 664 | 669 | 730 | 754 | 772 | 842 | 771 | 735 | 780 | 823 | 800 | 845 |
| Saskatchewan | 780 | 801 | 771 | 700 | 759 | 825 | 860 | 802 | 892 | 840 | 817 | 835 | 860 | 794 | 826 |
| Alberta | 929 | 969 | 911 | 808 | 939 | 972 | 945 | 960 | 962 | 923 | 893 | 965 | 961 | 960 | 985 |
| British Columbia | 840 | 864 | 780 | 722 | 835 | 821 | 801 | 866 | 924 | 900 | 873 | 919 | 903 | 887 | 952 |
| Men | 878 | 894 | 813 | 699 | 818 | 884 | 887 | 903 | 937 | 903 | 906 | 939 | 895 | 896 | 947 |
| Women | 841 | 850 | 777 | 670 | 794 | 859 | 846 | 865 | 900 | 858 | 860 | 896 | 880 | 877 | 916 |
| In couple families with kids | 945 | 954 | 868 | 774 | 865 | 939 | 928 | 962 | 970 | 948 | 946 | 995 | 967 | 966 | 999 |
| In couple families without kids | 1056 | 1089 | 966 | 833 | 979 | 1056 | 1047 | 1061 | 1123 | 1051 | 1087 | 1102 | 1064 | 1057 | 1085 |
| In single parent families | 485 | 496 | 409 | 293 | 404 | 481 | 448 | 486 | 549 | 499 | 506 | 477 | 462 | 498 | 530 |
| In other family types | 806 | 794 | 716 | 600 | 656 | 707 | 759 | 748 | 757 | 723 | 785 | 765 | 689 | 701 | 796 |
| UnattachedTable 3 Note 3 | 601 | 616 | 503 | Note F: too unreliable to be published | 559 | 647 | 628 | 640 | 680 | 644 | 640 | 660 | 670 | 660 | 701 |
| Population 15 to 64 years oldTable 3 Note 4 Table 3 Note 5 | 892 | 908 | 823 | 713 | 834 | 908 | 905 | 922 | 954 | 913 | 919 | 949 | 925 | 921 | 962 |
| IndigenousTable 3 Note 6 | 660 | 697 | 679 | 548 | 650 | 788 | 750 | 749 | 832 | 741 | 657 | 686 | 751 | 788 | 877 |
| First Nations | 555 | 615 | 614 | 485 | 554 | 656 | 583 | 595 | 662 | 535 | 528 | 632 | 643 | 673 | 754 |
| Métis | 783 | 808 | 729 | 600 | Note F: too unreliable to be published | 903 | 923 | 930 | 979 | 1007 | 770 | 775 | 880 | 952 | 996 |
| Inuit | Note F: too unreliable to be published | Note F: too unreliable to be published | Note F: too unreliable to be published | Note F: too unreliable to be published | Note F: too unreliable to be published | Note F: too unreliable to be published | Note F: too unreliable to be published | Note F: too unreliable to be published | Note F: too unreliable to be published | Note F: too unreliable to be published | Note F: too unreliable to be published | Note F: too unreliable to be published | Note F: too unreliable to be published | Note F: too unreliable to be published | Note F: too unreliable to be published |
| Non-Indigenous | 900 | 917 | 828 | 720 | 842 | 913 | 911 | 928 | 956 | 916 | 926 | 958 | 930 | 924 | 966 |
| Visible minorityTable 3 Note 7 | Note ..: not available for a specific reference period | Note ..: not available for a specific reference period | Note ..: not available for a specific reference period | Note ..: not available for a specific reference period | 656 | 722 | 736 | 722 | 760 | 748 | 788 | 785 | 778 | 770 | 828 |
| South Asian | Note ..: not available for a specific reference period | Note ..: not available for a specific reference period | Note ..: not available for a specific reference period | Note ..: not available for a specific reference period | 762 | 761 | 755 | 772 | 733 | 712 | 762 | 793 | 792 | 799 | 864 |
| Chinese | Note ..: not available for a specific reference period | Note ..: not available for a specific reference period | Note ..: not available for a specific reference period | Note ..: not available for a specific reference period | 699 | 654 | 675 | 737 | 780 | 764 | 769 | 818 | 923 | 772 | 796 |
| Black | Note ..: not available for a specific reference period | Note ..: not available for a specific reference period | Note ..: not available for a specific reference period | Note ..: not available for a specific reference period | Note F: too unreliable to be published | 603 | 714 | 655 | 769 | 666 | 762 | 753 | 710 | 661 | 693 |
| Not a visible minority | Note ..: not available for a specific reference period | Note ..: not available for a specific reference period | Note ..: not available for a specific reference period | Note ..: not available for a specific reference period | 899 | 991 | 975 | 1010 | 1017 | 979 | 973 | 1009 | 984 | 981 | 1021 |
| Landed immigrantsTable 3 Note 8 | 818 | 811 | 734 | 600 | 716 | 788 | 783 | 788 | 820 | 808 | 810 | 804 | 798 | 805 | 855 |
| Immigrant, landed more than 10 years ago | 885 | 884 | 795 | 653 | 758 | 788 | 816 | 826 | 888 | 849 | 864 | 883 | 865 | 876 | 913 |
| Immigrant, landed 6 to 10 years ago | 735 | 718 | 630 | 478 | Note F: too unreliable to be published | 770 | 695 | 774 | 750 | 785 | 766 | 741 | 778 | 742 | 799 |
| Immigrant, landed 5 or less years ago | 630 | 654 | 644 | 520 | 665 | 786 | 711 | 705 | 712 | 655 | 715 | 715 | 672 | 640 | 755 |
| Born in Canada | 944 | 961 | 874 | 766 | 888 | 981 | 972 | 997 | 1008 | 972 | 975 | 1009 | 984 | 977 | 1018 |
|
.. not available for a specific reference period F too unreliable to be published
|
|||||||||||||||
| Family earnings plus GST/HST credit, child benefits, EI, emergency and recovery benefits | Median adjusted weekly family income | ||||||||||||||
|---|---|---|---|---|---|---|---|---|---|---|---|---|---|---|---|
| 2020 | 2021 | ||||||||||||||
| January | February | March | April | May | June | July | August | September | October | November | December | January | February | March | |
| current dollars | |||||||||||||||
| Population 0 to 64 years old | 921 | 935 | 984 | 928 | 1047 | 1061 | 1030 | 1037 | 1045 | 992 | 986 | 1022 | 1016 | 1012 | 1039 |
| Newfoundland and Labrador | 792 | 840 | 846 | 828 | 901 | 998 | 968 | 935 | 935 | 937 | 911 | 952 | 915 | 870 | 942 |
| Prince Edward Island | 823 | 838 | 833 | 837 | 862 | 964 | 874 | 881 | 911 | 914 | 883 | 909 | 901 | 860 | 886 |
| Nova Scotia | 781 | 774 | 848 | 852 | 939 | 919 | 881 | 909 | 901 | 849 | 863 | 901 | 879 | 873 | 900 |
| New Brunswick | 822 | 819 | 857 | 842 | 921 | 958 | 937 | 945 | 963 | 950 | 873 | 932 | 877 | 891 | 945 |
| Quebec | 887 | 910 | 950 | 846 | 1022 | 1071 | 1033 | 1016 | 1006 | 948 | 959 | 980 | 978 | 973 | 992 |
| Ontario | 967 | 969 | 1021 | 979 | 1083 | 1085 | 1059 | 1081 | 1088 | 1044 | 1048 | 1060 | 1061 | 1067 | 1090 |
| Manitoba | 838 | 846 | 903 | 905 | 932 | 946 | 933 | 934 | 953 | 875 | 850 | 905 | 928 | 907 | 964 |
| Saskatchewan | 874 | 873 | 936 | 897 | 974 | 972 | 984 | 950 | 1000 | 936 | 896 | 949 | 963 | 909 | 941 |
| Alberta | 997 | 1027 | 1080 | 1029 | 1176 | 1138 | 1084 | 1095 | 1097 | 1026 | 1019 | 1080 | 1093 | 1053 | 1100 |
| British Columbia | 892 | 912 | 962 | 936 | 1003 | 1024 | 967 | 1030 | 1062 | 1007 | 976 | 1034 | 1030 | 1000 | 1067 |
| Men | 938 | 954 | 999 | 942 | 1054 | 1075 | 1048 | 1053 | 1062 | 1016 | 1004 | 1040 | 1021 | 1019 | 1054 |
| Women | 908 | 916 | 969 | 919 | 1039 | 1049 | 1015 | 1017 | 1029 | 972 | 969 | 1005 | 1009 | 1002 | 1025 |
| In couple families with kids | 1021 | 1026 | 1069 | 1018 | 1124 | 1133 | 1101 | 1112 | 1115 | 1070 | 1068 | 1114 | 1105 | 1100 | 1119 |
| In couple families without kids | 1088 | 1116 | 1135 | 1068 | 1175 | 1197 | 1167 | 1161 | 1235 | 1163 | 1157 | 1167 | 1170 | 1143 | 1191 |
| In single parent families | 589 | 605 | 644 | 619 | 756 | 756 | 691 | 699 | 768 | 645 | 653 | 655 | 622 | 677 | 697 |
| In other family types | 838 | 854 | 965 | 950 | 996 | 1023 | 1018 | 965 | 952 | 937 | 909 | 951 | 926 | 926 | 968 |
| UnattachedTable 4 Note 3 | 621 | 636 | 641 | 543 | 636 | 748 | 697 | 709 | 743 | 695 | 675 | 708 | 713 | 721 | 755 |
| Population 15 to 64 years oldTable 4 Note 4 Table 4 Note 5 | 949 | 960 | 1012 | 955 | 1066 | 1099 | 1065 | 1067 | 1079 | 1023 | 1015 | 1048 | 1045 | 1039 | 1069 |
| IndigenousTable 4 Note 6 | 756 | 778 | 893 | 799 | 941 | 1004 | 995 | 908 | 988 | 924 | 789 | 816 | 900 | 907 | 980 |
| First Nations | 666 | 694 | 826 | 746 | 764 | 901 | 767 | 739 | 878 | 737 | 643 | 768 | 809 | 828 | 882 |
| Métis | 866 | 882 | 967 | 870 | 1040 | 1061 | 1126 | 1077 | 1100 | 1060 | 856 | 870 | 1032 | 1066 | 1110 |
| Inuit | Note F: too unreliable to be published | Note F: too unreliable to be published | Note F: too unreliable to be published | Note F: too unreliable to be published | Note F: too unreliable to be published | Note F: too unreliable to be published | Note F: too unreliable to be published | Note F: too unreliable to be published | Note F: too unreliable to be published | Note F: too unreliable to be published | Note F: too unreliable to be published | Note F: too unreliable to be published | Note F: too unreliable to be published | Note F: too unreliable to be published | Note F: too unreliable to be published |
| Non-Indigenous | 955 | 964 | 1016 | 959 | 1073 | 1105 | 1068 | 1072 | 1080 | 1026 | 1023 | 1055 | 1051 | 1044 | 1074 |
| Visible minorityTable 4 Note 7 | Note ..: not available for a specific reference period | Note ..: not available for a specific reference period | Note ..: not available for a specific reference period | Note ..: not available for a specific reference period | 976 | 998 | 968 | 951 | 957 | 903 | 902 | 934 | 915 | 919 | 971 |
| South Asian | Note ..: not available for a specific reference period | Note ..: not available for a specific reference period | Note ..: not available for a specific reference period | Note ..: not available for a specific reference period | 988 | 1001 | 966 | 1006 | 957 | 888 | 901 | 915 | 962 | 930 | 973 |
| Chinese | Note ..: not available for a specific reference period | Note ..: not available for a specific reference period | Note ..: not available for a specific reference period | Note ..: not available for a specific reference period | 962 | 929 | 917 | 960 | 923 | 937 | 956 | 983 | 1067 | 962 | 902 |
| Black | Note ..: not available for a specific reference period | Note ..: not available for a specific reference period | Note ..: not available for a specific reference period | Note ..: not available for a specific reference period | 849 | 910 | 964 | 906 | 992 | 806 | 854 | 844 | 836 | 805 | 867 |
| Not a visible minority | Note ..: not available for a specific reference period | Note ..: not available for a specific reference period | Note ..: not available for a specific reference period | Note ..: not available for a specific reference period | 1114 | 1151 | 1106 | 1124 | 1122 | 1067 | 1057 | 1097 | 1096 | 1088 | 1117 |
| Landed immigrantsTable 4 Note 8 | 873 | 869 | 956 | 901 | 995 | 1030 | 984 | 984 | 1006 | 949 | 918 | 949 | 952 | 946 | 982 |
| Immigrant, landed more than 10 years ago | 940 | 933 | 1020 | 953 | 1003 | 1057 | 1012 | 1024 | 1048 | 988 | 979 | 999 | 1000 | 1012 | 1025 |
| Immigrant, landed 6 to 10 years ago | 806 | 778 | 866 | 767 | 986 | 971 | 892 | 958 | 963 | 952 | 876 | 896 | 881 | 856 | 904 |
| Immigrant, landed 5 or less years ago | 695 | 708 | 831 | 796 | 947 | 952 | 918 | 879 | 864 | 820 | 838 | 846 | 800 | 784 | 872 |
| Born in Canada | 991 | 1006 | 1047 | 995 | 1117 | 1149 | 1108 | 1119 | 1121 | 1061 | 1059 | 1097 | 1105 | 1084 | 1117 |
|
.. not available for a specific reference period F too unreliable to be published
|
|||||||||||||||
- Date modified: