
Income Research Paper Series
Experimental estimates of family weekly income, update
Skip to text
Text begins
Introduction
This note describes updates to the experimental estimates of family weekly income previously described in December 2020Note , which continue to build out the framework established and improving the precision of estimates. Readers are advised to refer to the December 2020 release of the experimental family weekly income indicator for additional context, analysis and caveats.
What’s new in this version?
The scope of the estimate is expanded in terms of population, time and program coverage.
- Canada Emergency Response Benefit (CERB) (March to September) are now based solely on administrative data rather than partially imputed from survey responses
- Canada Emergency Student Benefit (CESB) (June to September)Note are imputed using survey responses
- Canada Recovery Benefit (CRB), Canada Recovery Sickness Benefit (CRSB) and Canada Recovery Caregiving Benefit (October through December) are imputed using survey responsesNote
- a different low income threshold is utilized so as to take into consideration variation in the usual income levels earned across the country. A provincially-based low-income measure is developed which defines the low income threshold to be 50% of the provincial median after-tax income, adjusting for family sizeNote
- families with self-employed individuals are now included in the estimatesNote
- the period covered is extended to December 2020
- results are presented which break down results by province, family type, gender, visible minority and Indigenous status.
The results continue to exclude families with members aged 65 and over.
Definitions of family weekly income
For the purposes of the March 2021 update of these experimental estimates, family weekly income is comprised of
- Weekly wages and salaries
- Estimated self-employment income
- GST/HST credits
- Canada and provincial child benefits
- Employment insurance benefits
- Canada Emergency Response Benefit (CERB), Canada Emergency Student Benefit (CESB), Canada Recovery Benefit (CRB), Canada Recovery Sickness Benefit (CRSB) and Canada Recovery Caregiving Benefit (CRCB)
Family weekly earnings is comprised of
- Weekly wages and salaries
- Estimated self-employment income
All income sources are expressed as weekly amounts.
Concepts used to define weekly low income status
For the March 2021 update of these experimental family weekly income estimates, two concepts are used to describe weekly low-income status. The share of the population with weekly family earnings below the provincial threshold appropriate to their family size is referred to as having “weekly earnings below the provincial low-income threshold” or “low-weekly earnings” and the share of the population with weekly family income below the threshold appropriate to their family size is referred to as having “weekly income below the provincial low-income threshold” or “low-weekly income”. National figures are the total percentage of individuals below their respective provincial thresholds.
Values of median adjusted family weekly earnings and adjusted family weekly income of persons are also provided. Adjusted values are determined by dividing family earnings (or income) by the square root of family size, and assigning this value to all members of the family. The result is a single-person equivalent earnings or income measure that takes into account economies of scale associated with larger family sizes.
Data is disaggregated according to province, gender, family type and for population groups designated as visible minorities and based on Indigenous identity.
Results
The pandemic has led to considerable work interruptions in Canada and around the world since mid-March 2020. However, emerging evidence on 2020 trends suggests that COVID-related pandemic benefits may have mitigated the impact of declines in employment and earnings for many Canadian familiesNote .
According to the Labour Force Survey (LFS), in June 2020, more than one-quarter (28.3%) of Canadians aged 15 to 69 reported receiving some kind of federal income assistance payment since the beginning of the pandemic (the Canadian Emergency Response Benefit, the Canadian Emergency Student Benefit, regular Employment Insurance benefits, or new benefits for which they were unsure of the source). Results from this study suggest that the government pandemic relief benefits offset a potential surge in low income in March and April 2020 for a large portion of Canadian families.
These results show that while median weekly family earnings (wages, salaries and self-employment income) fell strongly from February 2020 to April 2020 (-21.9%), median weekly family income, including income from CERB and other pandemic relief programs, was relatively unchanged, reflecting the offsetting effect of the pandemic relief programs.
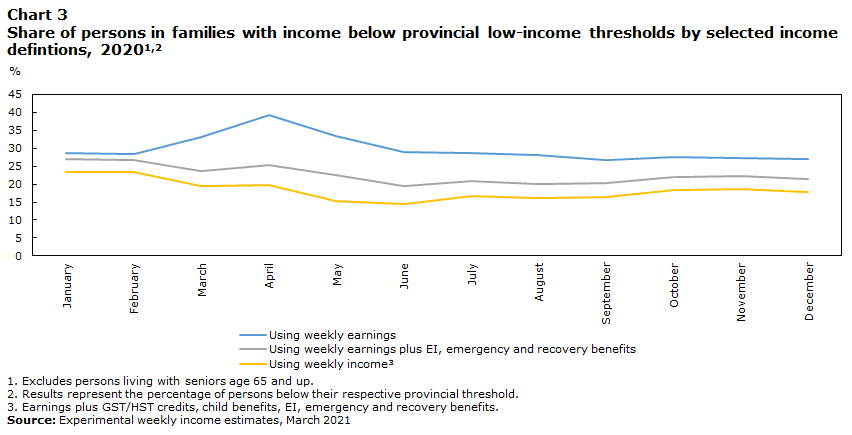
Likewise, from February to June 2020, a surge in the share of persons living in families with low-weekly earnings was more than offset by government pandemic relief benefits, such that there was a decline in the experimental low-weekly income rate from February (23.3%) to June 2020 (14.6%) (see chart 3).
The experimental low-weekly income rate climbed again during the second half of 2020, but remained below its pre-pandemic level in December 2020 (17.8%).
Results for different family types suggest that the drops in median weekly earnings observed between February 2020 to April 2020 were larger for lone-parent families (-40.9%), and unattached individuals (-69.1%), but these were also offset by government transfers for these groups. The surge in low-weekly earnings was similar for men and women, reflecting the fact that the family earnings measure would mask gender differences in the pandemic related economic shock.
Black Canadians, other visible minorities and Indigenous people also faced more difficult labour market situations over the pandemicNote . The experimental low-weekly income rate was also higher for Black Canadians (24.2% in December, 2020) and other visible minority groups as well as Indigenous people (28.4%) than for non-visible minorities (16.4%) over the last three months of the year.
These experimental estimates of family weekly income currently exclude families with persons 65 and over, as well as income sources such as provincial social assistance and some provincial pandemic benefits. They also do not reflect possible repayments of pandemic benefits, and do not include taxes. Continued development of the experimental weekly family income estimates is underway with the intention of expanding when possible population and income coverage, and considering other possible disaggregation of the data.
Caveats
As with the estimates presented in December 2020, these updated results contain caveats and areas for potential improvement.
The estimates presented in this note make use of the data available at this time, and will continue to be improved as new data becomes available. As such, it is important to point out that the results here are preliminary and users are advised to use caution when interpreting the results. Users are also advised to refer to the December 2020 release of the experimental family weekly income indicator for additional context, analysis and caveats.
With the inclusion of families with self-employed workers, population coverage has been improved substantially with this release. However, families with members aged 65 or over are still excluded from this estimate.
This note also expands income sources above those used previously, and there is no longer any imputation of CERB amounts. However, several income sources remain uncovered, such as income from investments or interest, and provincial social assistance.
Description of charts and tables
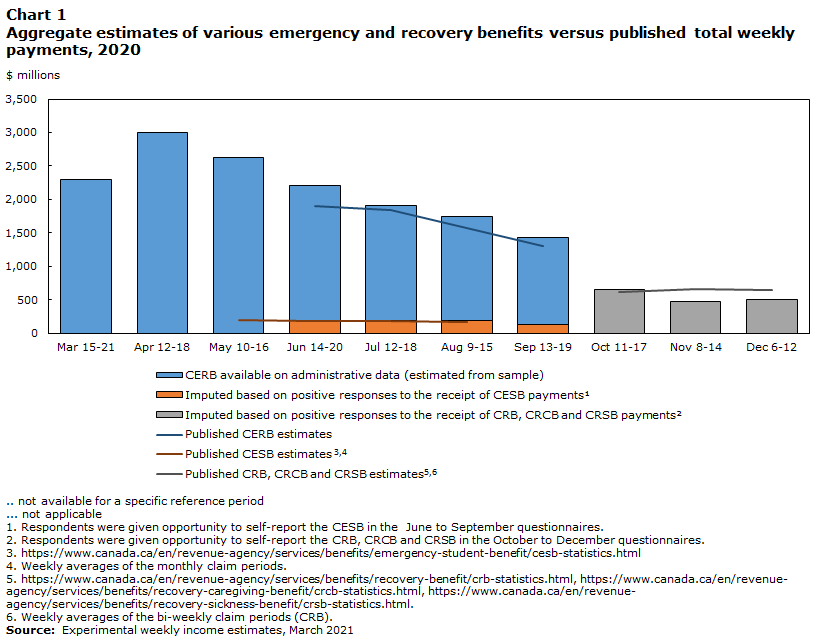
Chart 1 provides a comparison of the CERB, the CESB, and the CRB, CRCB and CRSB benefits for each reference week of the LFS, with the total benefit payments reported by the Government of Canada (referred to as the "published estimates"). The results show that the totals derived using the approaches described for the experimental family weekly income estimates line up well relatively with these aggregate totals.
Chart 2 gives additional information relevant to the construction of the experimental estimates. Specifically it shows estimates of the distribution of individual income under different income definitions: (1) income from wages and salaries and self-employment income (earnings alone) and (2) Earnings plus EI, emergency and recovery benefits. The results show that an important outcome from the emergency benefits was to reduce the increase in the share of persons with zero earnings, and increase the share of persons with $500.
Chart 3 presents experimental estimates of weekly income below the provincial low-income threshold, using different income concepts. Reflecting the state of the Canadian labour market, the share of persons with weekly family earnings below the provincial low-income threshold rose from 28.4% in February to 39.3% in April before progressively falling back below 29% in JulyNote .
With the addition of EI, CERB, and CESB, and then CRB, CRCB, and CRSB benefits introduced in the last quarter, there was no longer any sharp increase in the share of individuals whose family income was below the provincial threshold in April, but rather a slight increase compared to March. As a result, the proportion of people living in families with below-threshold weekly incomes remained between 19.4% and 25.3% in the months after February.
Chart 3 also presents estimates for below-threshold income considering child benefits and GST/HST credits, including exceptional top-up amounts in addition to the earnings, EI and emergency and recovery benefits (weekly income). These show that rates were about 23% before the pandemic and then declined from March onwards and did not return to pre-pandemic levels for the rest of the year, varying between 14.6% and 19.7%.
Tables 1 to 4 provide a further breakdown of the situation by: province, gender, family type, visible minority and indigenous status.
For all tables, there are two populations targeted:
- Persons aged 0 to 64 are available for province, gender and family type
- Persons aged 15 to 64 are available for visible minority status and Indigenous identity
From July 2020, a section was added to the LFS asking respondents which population groups they belonged to. Some respondent information was able to be carried back in time so that results for those groups could be presented here beginning in May. This proved to be the case for visible minorities as a whole, but less so for the more detailed groups of South Asian, Chinese and Black which were included for this study.
Table 1 and 2 can be used to compare the share of persons below the provincial low income threshold based on the income concept of family earnings (Table 1) and family income (Table 2).
Similarly, Tables 3 and 4 can be used to compare the adjusted median weekly family earnings (Table 3) and family income (Table 4).
Data table for Chart 1
| LFS reference week | CERB available on administrative data (estimated from sample) | Imputed based on positive responses to the receipt of CESB payments Chart 1 Aggregate estimates of various emergency and recovery benefits versus published total weekly payments, 2020Note 1 |
Imputed based on positive responses to the receipt of CRB, CRCB and CRSB payments Chart 1 Aggregate estimates of various emergency and recovery benefits versus published total weekly payments, 2020Note 2 |
Published CERB estimates | Published CESB estimates Chart 1 Aggregate estimates of various emergency and recovery benefits versus published total weekly payments, 2020Note 3 Chart 1 Aggregate estimates of various emergency and recovery benefits versus published total weekly payments, 2020Note 4 |
Published CRB, CRCB and CRSB estimates Chart 1 Aggregate estimates of various emergency and recovery benefits versus published total weekly payments, 2020Note 5 Chart 1 Aggregate estimates of various emergency and recovery benefits versus published total weekly payments, 2020Note 6 |
|---|---|---|---|---|---|---|
| $ millions | ||||||
| Mar 15-21 | 2296 | Note ...: not applicable | Note ...: not applicable | Note ..: not available for a specific reference period | Note ...: not applicable | Note ...: not applicable |
| Apr 12-18 | 3003 | Note ...: not applicable | Note ...: not applicable | Note ..: not available for a specific reference period | Note ...: not applicable | Note ...: not applicable |
| May 10-16 | 2619 | Note ..: not available for a specific reference period | Note ...: not applicable | Note ..: not available for a specific reference period | 197 | Note ...: not applicable |
| Jun 14-20 | 2209 | 194 | Note ...: not applicable | 1904 | 181 | Note ...: not applicable |
| Jul 12-18 | 1906 | 195 | Note ...: not applicable | 1848 | 183 | Note ...: not applicable |
| Aug 9-15 | 1738 | 182 | Note ...: not applicable | 1570 | 172 | Note ...: not applicable |
| Sep 13-19 | 1425 | 123 | Note ...: not applicable | 1310 | Note ...: not applicable | Note ...: not applicable |
| Oct 11-17 | Note ...: not applicable | Note ...: not applicable | 652 | Note ...: not applicable | Note ...: not applicable | 621 |
| Nov 8-14 | Note ...: not applicable | Note ...: not applicable | 466 | Note ...: not applicable | Note ...: not applicable | 661 |
| Dec 6-12 | Note ...: not applicable | Note ...: not applicable | 496 | Note ...: not applicable | Note ...: not applicable | 642 |
|
.. not available for a specific reference period ... not applicable
|
||||||

Data table for Chart 2
| Income level per month | Earnings alone | Earnings plus EI and emergency and recovery benefits |
|---|---|---|
| % | ||
| $0 | ||
| January | 35.4 | 32.9 |
| February | 34.9 | 32.5 |
| March | 42.7 | 30.7 |
| April | 51.9 | 30.9 |
| May | 47.6 | 30.1 |
| June | 41.3 | 26.7 |
| July | 39.9 | 27.0 |
| August | 38.9 | 27.0 |
| September | 36.7 | 27.7 |
| October | 36.4 | 29.5 |
| November | 36.5 | 29.8 |
| December | 36.8 | 29.6 |
| $1-499 | ||
| January | 15.1 | 15.9 |
| February | 14.8 | 15.7 |
| March | 12.1 | 8.8 |
| April | 7.9 | 7.2 |
| May | 8.5 | 7.0 |
| June | 10.8 | 9.6 |
| July | 11.9 | 10.6 |
| August | 12.0 | 10.9 |
| September | 13.1 | 11.7 |
| October | 14.4 | 12.5 |
| November | 14.1 | 12.8 |
| December | 13.2 | 11.8 |
| $500 | ||
| January | 0.2 | 0.2 |
| February | 0.2 | 0.2 |
| March | 0.1 | 9.3 |
| April | 0.1 | 17.9 |
| May | 0.1 | 15.2 |
| June | 0.1 | 11.2 |
| July | 0.1 | 10.0 |
| August | 0.1 | 9.3 |
| September | 0.2 | 7.0 |
| October | 0.1 | 4.8 |
| November | 0.2 | 4.4 |
| December | 0.1 | 4.7 |
| $501 to $1,000 | ||
| January | 22.1 | 23.6 |
| February | 22.6 | 24.0 |
| March | 19.2 | 22.7 |
| April | 16.0 | 18.3 |
| May | 17.3 | 19.6 |
| June | 20.1 | 23.1 |
| July | 20.9 | 24.0 |
| August | 21.1 | 23.7 |
| September | 21.3 | 23.8 |
| October | 22.0 | 25.3 |
| November | 21.7 | 24.8 |
| December | 21.0 | 24.4 |
| $1,001 to $1,500 | ||
| January | 14.0 | 14.1 |
| February | 13.9 | 13.9 |
| March | 12.9 | 14.7 |
| April | 11.8 | 12.8 |
| May | 13.2 | 14.1 |
| June | 13.9 | 15.0 |
| July | 13.8 | 14.6 |
| August | 14.3 | 15.0 |
| September | 14.2 | 15.0 |
| October | 13.6 | 14.2 |
| November | 13.9 | 14.3 |
| December | 14.3 | 14.7 |
| $1,501 and over | ||
| January | 13.2 | 13.3 |
| February | 13.6 | 13.7 |
| March | 13.0 | 13.9 |
| April | 12.2 | 13.0 |
| May | 13.4 | 14.1 |
| June | 13.8 | 14.5 |
| July | 13.5 | 14.0 |
| August | 13.6 | 14.1 |
| September | 14.5 | 14.8 |
| October | 13.5 | 13.7 |
| November | 13.7 | 13.8 |
| December | 14.6 | 14.9 |
|
||
Data table for Chart 3
| Month | Using weekly earnings | Using weekly earnings plus EI, emergency and recovery benefits | Using weekly incomeChart 3 Note 3 |
|---|---|---|---|
| % | |||
| January | 28.7 | 26.9 | 23.4 |
| February | 28.4 | 26.7 | 23.3 |
| March | 33.1 | 23.6 | 19.5 |
| April | 39.3 | 25.3 | 19.7 |
| May | 33.3 | 22.5 | 15.2 |
| June | 29.0 | 19.4 | 14.6 |
| July | 28.6 | 20.8 | 16.8 |
| August | 28.0 | 20.1 | 16.1 |
| September | 26.7 | 20.3 | 16.3 |
| October | 27.6 | 21.9 | 18.2 |
| November | 27.3 | 22.2 | 18.6 |
| December | 27.0 | 21.4 | 17.8 |
|
|||
| Share of persons in families below provincial low-income thresholds, family earnings | ||||||||||||
|---|---|---|---|---|---|---|---|---|---|---|---|---|
| January | February | March | April | May | June | July | August | September | October | November | December | |
| percent | ||||||||||||
| Family earnings alone | ||||||||||||
| Population 0 to 64 years old | 28.7 | 28.4 | 33.1 | 39.3 | 33.3 | 29.0 | 28.6 | 28.0 | 26.7 | 27.6 | 27.3 | 27.0 |
| Newfoundland and Labrador | 38.7 | 35.4 | 39.5 | 45.6 | 39.9 | 33.2 | 33.7 | 31.3 | 29.9 | 30.4 | 31.7 | 32.4 |
| Prince Edward Island | 32.2 | 32.6 | 38.2 | 42.0 | 31.4 | 28.3 | 30.0 | 26.5 | 27.4 | 24.1 | 30.0 | 27.9 |
| Nova Scotia | 32.9 | 33.4 | 34.6 | 38.3 | 35.2 | 31.5 | 30.2 | 29.2 | 30.1 | 27.9 | 29.0 | 27.5 |
| New Brunswick | 31.0 | 29.1 | 33.8 | 36.8 | 31.9 | 27.3 | 27.5 | 25.5 | 24.2 | 25.5 | 26.8 | 25.8 |
| Quebec | 26.0 | 26.1 | 31.7 | 42.0 | 31.5 | 23.8 | 25.1 | 25.1 | 24.1 | 24.7 | 25.1 | 25.0 |
| Ontario | 28.0 | 28.4 | 33.7 | 39.2 | 34.6 | 31.5 | 29.0 | 29.2 | 27.8 | 28.2 | 27.1 | 27.3 |
| Manitoba | 28.3 | 27.3 | 29.4 | 34.2 | 33.3 | 27.8 | 28.2 | 29.0 | 25.9 | 29.4 | 29.5 | 28.3 |
| Saskatchewan | 31.5 | 31.7 | 32.5 | 36.4 | 34.0 | 27.5 | 27.4 | 28.1 | 25.8 | 26.9 | 29.6 | 30.0 |
| Alberta | 30.0 | 28.1 | 32.6 | 37.6 | 32.5 | 29.9 | 31.3 | 29.0 | 28.5 | 30.8 | 28.7 | 28.4 |
| British Columbia | 31.4 | 30.0 | 34.4 | 38.5 | 32.1 | 29.7 | 30.6 | 28.6 | 26.5 | 27.6 | 28.6 | 26.4 |
| Men | 28.2 | 27.7 | 32.3 | 38.8 | 33.1 | 28.2 | 27.7 | 26.9 | 26.0 | 26.6 | 26.5 | 26.2 |
| Women | 29.2 | 29.0 | 34.0 | 39.8 | 33.4 | 29.8 | 29.5 | 29.2 | 27.5 | 28.7 | 28.2 | 27.8 |
| In couple families with kids | 22.6 | 22.4 | 27.0 | 33.3 | 28.5 | 23.7 | 22.9 | 22.5 | 21.5 | 22.0 | 21.2 | 20.4 |
| In couple families without kids | 22.7 | 22.0 | 26.5 | 32.6 | 28.2 | 25.4 | 24.3 | 23.7 | 21.3 | 22.2 | 22.7 | 22.3 |
| In single parent families | 49.5 | 48.7 | 54.9 | 60.9 | 53.7 | 48.7 | 50.9 | 49.4 | 46.0 | 49.4 | 48.8 | 50.7 |
| In other family types | 29.8 | 31.1 | 36.5 | 41.7 | 38.6 | 34.7 | 31.9 | 31.1 | 35.5 | 34.5 | 31.7 | 34.0 |
| UnattachedTable 1 Note 3 | 43.9 | 43.7 | 49.1 | 55.4 | 47.9 | 41.9 | 43.3 | 42.8 | 41.2 | 41.9 | 42.6 | 42.0 |
| Population 15 to 64 years oldTable 1 Note 4 | 27.5 | 27.1 | 32.0 | 38.3 | 32.2 | 27.9 | 27.4 | 26.9 | 25.8 | 26.5 | 26.2 | 25.9 |
| Indigenous identityTable 1 Note 5 | 40.9 | 39.3 | 39.8 | 46.9 | 39.6 | 34.1 | 35.9 | 35.8 | 35.0 | 37.8 | 43.1 | 41.5 |
| First Nations | 45.7 | 44.2 | 44.0 | 50.4 | 42.1 | 41.2 | 46.4 | 44.7 | 41.7 | 45.6 | 47.7 | 43.8 |
| Métis | 36.1 | 34.5 | 35.0 | 42.9 | 36.2 | 27.6 | 26.9 | 27.8 | 27.7 | 30.2 | 38.8 | 38.8 |
| Inuit | Note F: too unreliable to be published | Note F: too unreliable to be published | Note F: too unreliable to be published | Note F: too unreliable to be published | Note F: too unreliable to be published | Note F: too unreliable to be published | Note F: too unreliable to be published | Note F: too unreliable to be published | Note F: too unreliable to be published | Note F: too unreliable to be published | Note F: too unreliable to be published | Note F: too unreliable to be published |
| Non-indigenous | 27.1 | 26.7 | 31.8 | 38.0 | 31.9 | 27.6 | 27.0 | 26.7 | 25.4 | 26.1 | 25.6 | 25.3 |
| Visible minorityTable 1 Note 6 | Note ..: not available for a specific reference period | Note ..: not available for a specific reference period | Note ..: not available for a specific reference period | Note ..: not available for a specific reference period | 40.9 | 35.3 | 33.9 | 34.9 | 33.3 | 34.2 | 31.4 | 32.5 |
| South Asian | Note ..: not available for a specific reference period | Note ..: not available for a specific reference period | Note ..: not available for a specific reference period | Note ..: not available for a specific reference period | 39.2 | 31.6 | 30.6 | 30.7 | 31.5 | 34.2 | 28.5 | 29.8 |
| Chinese | Note ..: not available for a specific reference period | Note ..: not available for a specific reference period | Note ..: not available for a specific reference period | Note ..: not available for a specific reference period | 39.3 | 40.1 | 39.3 | 37.9 | 37.8 | 37.8 | 37.5 | 33.3 |
| Black | Note ..: not available for a specific reference period | Note ..: not available for a specific reference period | Note ..: not available for a specific reference period | Note ..: not available for a specific reference period | 50.9 | 41.7 | 35.8 | 37.7 | 33.1 | 38.7 | 32.8 | 36.6 |
| Not a visible minority | Note ..: not available for a specific reference period | Note ..: not available for a specific reference period | Note ..: not available for a specific reference period | Note ..: not available for a specific reference period | 29.2 | 25.3 | 25.1 | 24.2 | 23.1 | 23.7 | 24.3 | 23.5 |
|
.. not available for a specific reference period F too unreliable to be published
|
||||||||||||
| Share of persons in families below provincial low-income thresholds, family income | ||||||||||||
|---|---|---|---|---|---|---|---|---|---|---|---|---|
| January | February | March | April | May | June | July | August | September | October | November | December | |
| percent | ||||||||||||
| Family earnings plus GST/HST credit, child benefits, EI, emergency and recovery benefits | ||||||||||||
| Population 0 to 64 years old | 23.4 | 23.3 | 19.5 | 19.7 | 15.2 | 14.6 | 16.8 | 16.1 | 16.3 | 18.2 | 18.6 | 17.8 |
| Newfoundland and Labrador | 26.7 | 25.2 | 20.7 | 22.9 | 20.0 | 17.4 | 19.5 | 19.6 | 16.1 | 16.9 | 18.2 | 17.2 |
| Prince Edward Island | 22.0 | 21.4 | 18.8 | 17.4 | Note F: too unreliable to be published | 14.4 | 16.3 | 16.0 | 14.3 | 13.6 | 16.4 | 15.0 |
| Nova Scotia | 25.6 | 25.5 | 21.4 | 18.4 | 16.2 | 14.6 | 17.1 | 14.7 | 17.8 | 19.7 | 19.3 | 17.4 |
| New Brunswick | 21.9 | 20.1 | 18.0 | 16.6 | 14.3 | 13.3 | 15.6 | 14.3 | 15.8 | 17.1 | 16.7 | 14.7 |
| Quebec | 20.3 | 20.6 | 17.6 | 18.9 | 14.0 | 11.5 | 13.6 | 13.6 | 13.7 | 14.9 | 16.0 | 15.0 |
| Ontario | 22.8 | 23.6 | 19.6 | 19.9 | 15.5 | 15.1 | 16.8 | 16.5 | 16.8 | 19.3 | 18.8 | 18.8 |
| Manitoba | 22.7 | 22.1 | 16.7 | 16.7 | 14.8 | 12.4 | 16.1 | 16.5 | 14.5 | 18.1 | 18.4 | 16.6 |
| Saskatchewan | 25.4 | 26.1 | 20.6 | 19.7 | 15.5 | 15.2 | 17.5 | 16.4 | 17.8 | 18.7 | 21.5 | 20.6 |
| Alberta | 25.8 | 23.1 | 20.2 | 20.5 | 16.6 | 16.2 | 18.6 | 17.7 | 18.5 | 20.0 | 20.1 | 19.9 |
| British Columbia | 27.2 | 26.8 | 22.4 | 21.4 | 14.8 | 17.1 | 20.4 | 17.8 | 17.3 | 19.1 | 20.6 | 18.1 |
| Men | 23.0 | 22.8 | 19.2 | 19.5 | 14.7 | 14.1 | 16.2 | 15.2 | 15.8 | 17.4 | 18.0 | 17.2 |
| Women | 23.7 | 23.8 | 19.9 | 20.0 | 15.8 | 15.1 | 17.4 | 17.0 | 16.8 | 19.1 | 19.2 | 18.4 |
| In couple families with kids | 16.0 | 15.8 | 12.9 | 12.9 | 8.4 | 8.6 | 10.5 | 10.0 | 10.1 | 11.9 | 12.0 | 11.0 |
| In couple families without kids | 20.5 | 20.0 | 18.2 | 18.9 | 18.7 | 16.1 | 17.8 | 17.3 | 16.7 | 17.4 | 18.6 | 17.5 |
| In single parent families | 39.8 | 39.6 | 35.1 | 36.2 | 26.9 | 28.3 | 33.8 | 30.1 | 28.4 | 35.5 | 33.5 | 35.6 |
| In other family types | 25.8 | 27.8 | 20.0 | 21.2 | 24.2 | 18.4 | 16.4 | 17.8 | 21.6 | 22.1 | 19.0 | 20.7 |
| UnattachedTable 2 Note 3 | 41.2 | 41.5 | 35.1 | 34.4 | 29.3 | 28.2 | 31.5 | 31.1 | 32.0 | 33.0 | 35.2 | 33.1 |
| Population 15 to 64 years oldTable 2 Note 4 | 23.3 | 23.1 | 19.5 | 19.7 | 15.9 | 14.6 | 16.6 | 15.9 | 16.4 | 18.1 | 18.6 | 17.7 |
| Indigenous identityTable 2 Note 5 | 34.1 | 33.0 | 24.7 | 26.3 | 24.5 | 21.0 | 26.0 | 24.4 | 22.3 | 29.3 | 31.9 | 28.4 |
| First Nations | 38.9 | 37.2 | 27.2 | 30.2 | 25.2 | 26.5 | 33.1 | 30.3 | 24.9 | 36.7 | 38.8 | 30.0 |
| Métis | 29.3 | 28.7 | 21.7 | 21.6 | Note F: too unreliable to be published | 15.5 | 19.7 | 18.9 | 19.9 | 22.2 | 25.2 | 26.3 |
| Inuit | Note F: too unreliable to be published | Note F: too unreliable to be published | Note F: too unreliable to be published | Note F: too unreliable to be published | Note F: too unreliable to be published | Note F: too unreliable to be published | Note F: too unreliable to be published | Note F: too unreliable to be published | Note F: too unreliable to be published | Note F: too unreliable to be published | Note F: too unreliable to be published | Note F: too unreliable to be published |
| Non-indigenous | 22.9 | 22.8 | 19.4 | 19.5 | 15.6 | 14.4 | 16.2 | 15.7 | 16.2 | 17.7 | 18.1 | 17.3 |
| Visible minorityTable 2 Note 6 | Note ..: not available for a specific reference period | Note ..: not available for a specific reference period | Note ..: not available for a specific reference period | Note ..: not available for a specific reference period | 16.4 | 13.7 | 17.1 | 17.6 | 17.6 | 20.2 | 21.0 | 21.2 |
| South Asian | Note ..: not available for a specific reference period | Note ..: not available for a specific reference period | Note ..: not available for a specific reference period | Note ..: not available for a specific reference period | Note F: too unreliable to be published | Note F: too unreliable to be published | 15.4 | 15.9 | 13.5 | 19.3 | 18.5 | 20.6 |
| Chinese | Note ..: not available for a specific reference period | Note ..: not available for a specific reference period | Note ..: not available for a specific reference period | Note ..: not available for a specific reference period | Note F: too unreliable to be published | 20.4 | 24.2 | 21.7 | 24.1 | 23.4 | 26.2 | 21.1 |
| Black | Note ..: not available for a specific reference period | Note ..: not available for a specific reference period | Note ..: not available for a specific reference period | Note ..: not available for a specific reference period | Note F: too unreliable to be published | Note F: too unreliable to be published | 17.4 | 15.1 | 17.5 | 23.0 | 22.6 | 24.2 |
| Not a visible minority | Note ..: not available for a specific reference period | Note ..: not available for a specific reference period | Note ..: not available for a specific reference period | Note ..: not available for a specific reference period | 15.7 | 14.9 | 16.4 | 15.4 | 16.0 | 17.3 | 17.7 | 16.4 |
|
.. not available for a specific reference period F too unreliable to be published
|
||||||||||||
| Median adjusted weekly family earnings | ||||||||||||
|---|---|---|---|---|---|---|---|---|---|---|---|---|
| January | February | March | April | May | June | July | August | September | October | November | December | |
| current dollars | ||||||||||||
| Family earnings alone | ||||||||||||
| Population 0 to 64 years old | 860 | 875 | 793 | 683 | 812 | 870 | 867 | 880 | 920 | 879 | 884 | 920 |
| Newfoundland and Labrador | 703 | 742 | 663 | 523 | 589 | 775 | 741 | 757 | 817 | 767 | 749 | 803 |
| Prince Edward Island | 712 | 736 | 589 | 575 | 659 | 776 | 724 | 751 | 781 | 726 | 698 | 763 |
| Nova Scotia | 713 | 711 | 662 | 612 | 650 | 729 | 719 | 755 | 749 | 744 | 730 | 770 |
| New Brunswick | 717 | 725 | 658 | 593 | 705 | 830 | 786 | 814 | 836 | 841 | 741 | 830 |
| Quebec | 816 | 843 | 744 | 583 | 771 | 890 | 876 | 873 | 888 | 840 | 864 | 866 |
| Ontario | 913 | 910 | 824 | 734 | 831 | 887 | 889 | 903 | 955 | 929 | 943 | 972 |
| Manitoba | 777 | 782 | 732 | 665 | 675 | 725 | 750 | 775 | 841 | 770 | 735 | 781 |
| Saskatchewan | 779 | 802 | 770 | 700 | 758 | 827 | 860 | 798 | 895 | 832 | 810 | 835 |
| Alberta | 928 | 968 | 911 | 808 | 939 | 972 | 951 | 954 | 976 | 923 | 903 | 972 |
| British Columbia | 840 | 864 | 778 | 722 | 834 | 820 | 802 | 870 | 923 | 901 | 873 | 919 |
| Men | 878 | 894 | 812 | 699 | 817 | 887 | 887 | 903 | 941 | 906 | 910 | 940 |
| Women | 840 | 850 | 777 | 670 | 796 | 860 | 846 | 864 | 900 | 859 | 861 | 900 |
| In couple families with kids | 944 | 955 | 866 | 774 | 865 | 941 | 925 | 961 | 978 | 953 | 949 | 999 |
| In couple families without kids | 1,055 | 1,088 | 966 | 833 | 979 | 1,056 | 1,047 | 1,059 | 1,123 | 1,049 | 1,087 | 1,102 |
| In single parent families | 484 | 496 | 410 | 293 | 403 | 499 | 452 | 489 | 549 | 499 | 503 | 476 |
| In other family types | 805 | 794 | 718 | 600 | 656 | 718 | 774 | 763 | 754 | 720 | 807 | 764 |
| UnattachedTable 3 Note 3 | 601 | 618 | 502 | Note F: too unreliable to be published | 559 | 648 | 629 | 645 | 688 | 650 | 638 | 655 |
| Population 15 to 64 years oldTable 3 Note 4 | 892 | 907 | 823 | 713 | 836 | 910 | 903 | 921 | 956 | 913 | 921 | 950 |
| Indigenous identityTable 3 Note 5 | 664 | 697 | 679 | 548 | 647 | 788 | 750 | 748 | 827 | 742 | 657 | 686 |
| First Nations | 555 | 613 | 614 | 488 | 548 | 651 | 580 | 594 | 661 | 535 | 527 | 631 |
| Métis | 783 | 807 | 731 | 600 | 792 | 904 | 927 | 929 | 979 | 1018 | 770 | 772 |
| Inuit | Note F: too unreliable to be published | Note F: too unreliable to be published | Note F: too unreliable to be published | Note F: too unreliable to be published | Note F: too unreliable to be published | Note F: too unreliable to be published | Note F: too unreliable to be published | Note F: too unreliable to be published | Note F: too unreliable to be published | Note F: too unreliable to be published | Note F: too unreliable to be published | Note F: too unreliable to be published |
| Non-indigenous | 900 | 917 | 827 | 720 | 843 | 914 | 910 | 925 | 960 | 916 | 928 | 960 |
| Visible minorityTable 3 Note 6 | Note ..: not available for a specific reference period | Note ..: not available for a specific reference period | Note ..: not available for a specific reference period | Note ..: not available for a specific reference period | 656 | 724 | 741 | 721 | 760 | 748 | 780 | 781 |
| South Asian | Note ..: not available for a specific reference period | Note ..: not available for a specific reference period | Note ..: not available for a specific reference period | Note ..: not available for a specific reference period | 770 | 761 | 755 | 767 | 741 | 706 | 755 | 770 |
| Chinese | Note ..: not available for a specific reference period | Note ..: not available for a specific reference period | Note ..: not available for a specific reference period | Note ..: not available for a specific reference period | 694 | 653 | 668 | 725 | 775 | 749 | 762 | 809 |
| Black | Note ..: not available for a specific reference period | Note ..: not available for a specific reference period | Note ..: not available for a specific reference period | Note ..: not available for a specific reference period | Note F: too unreliable to be published | 603 | 714 | 651 | 769 | 666 | 754 | 750 |
| Not a visible minority | Note ..: not available for a specific reference period | Note ..: not available for a specific reference period | Note ..: not available for a specific reference period | Note ..: not available for a specific reference period | 900 | 997 | 974 | 1009 | 1,018 | 979 | 979 | 1,014 |
|
.. not available for a specific reference period F too unreliable to be published
|
||||||||||||
| Median adjusted weekly family income | ||||||||||||
|---|---|---|---|---|---|---|---|---|---|---|---|---|
| January | February | March | April | May | June | July | August | September | October | November | December | |
| current dollars | ||||||||||||
| Family earnings plus GST/HST credit, child benefits, EI, emergency and recovery benefits | ||||||||||||
| Population 0 to 64 years oldTable 4 Note 1 | 921 | 934 | 982 | 928 | 1,049 | 1,063 | 1,030 | 1,037 | 1,049 | 993 | 989 | 1,023 |
| Newfoundland and Labrador | 789 | 835 | 842 | 826 | 897 | 996 | 968 | 928 | 932 | 931 | 906 | 950 |
| Prince Edward Island | 822 | 835 | 833 | 836 | 869 | 965 | 868 | 882 | 907 | 915 | 888 | 902 |
| Nova Scotia | 781 | 774 | 842 | 847 | 943 | 912 | 879 | 909 | 900 | 838 | 864 | 903 |
| New Brunswick | 821 | 823 | 857 | 842 | 919 | 954 | 934 | 942 | 950 | 945 | 879 | 938 |
| Quebec | 890 | 912 | 950 | 844 | 1,024 | 1,070 | 1,034 | 1,016 | 1,010 | 951 | 961 | 980 |
| Ontario | 966 | 968 | 1,020 | 978 | 1,084 | 1,094 | 1,061 | 1,079 | 1,090 | 1,042 | 1,051 | 1,059 |
| Manitoba | 838 | 846 | 901 | 905 | 931 | 946 | 932 | 936 | 953 | 877 | 850 | 905 |
| Saskatchewan | 873 | 871 | 937 | 895 | 974 | 972 | 987 | 955 | 1,001 | 936 | 888 | 941 |
| Alberta | 996 | 1,027 | 1,080 | 1,029 | 1,174 | 1,142 | 1,090 | 1,092 | 1,119 | 1,026 | 1,025 | 1,089 |
| British Columbia | 891 | 912 | 957 | 938 | 1,001 | 1,023 | 970 | 1,032 | 1,058 | 1,007 | 979 | 1,032 |
| Men | 938 | 953 | 998 | 941 | 1,055 | 1,077 | 1,048 | 1,055 | 1,068 | 1,018 | 1,008 | 1,042 |
| Women | 908 | 916 | 968 | 918 | 1,039 | 1,052 | 1,015 | 1,018 | 1,032 | 972 | 972 | 1,006 |
| In couple families with kids | 1,021 | 1,026 | 1,068 | 1,017 | 1,125 | 1,133 | 1,100 | 1,112 | 1,120 | 1,072 | 1,070 | 1,115 |
| In couple families without kids | 1,088 | 1,115 | 1,135 | 1,068 | 1,179 | 1,202 | 1,169 | 1,160 | 1,230 | 1,157 | 1,156 | 1,168 |
| In single parent families | 589 | 605 | 643 | 617 | 756 | 757 | 690 | 695 | 767 | 644 | 649 | 647 |
| In other family types | 838 | 853 | 958 | 949 | 993 | 1020 | 1020 | 969 | 949 | 936 | 917 | 951 |
| UnattachedTable 4 Note 3 | 622 | 635 | 641 | 543 | 638 | 749 | 696 | 710 | 749 | 699 | 675 | 704 |
| Population 15 to 64 years oldTable 4 Note 4 | 949 | 960 | 1,011 | 954 | 1,069 | 1,102 | 1,066 | 1,067 | 1,081 | 1,022 | 1,017 | 1,049 |
| Indigenous identityTable 4 Note 5 | 756 | 777 | 892 | 800 | 939 | 1,004 | 990 | 912 | 992 | 931 | 794 | 811 |
| First Nations | 665 | 693 | 825 | 745 | 763 | 900 | 766 | 738 | 877 | 728 | 641 | 779 |
| Métis | 866 | 881 | 967 | 870 | 1,059 | 1,060 | 1,102 | 1,075 | 1,096 | 1,073 | 853 | 863 |
| Inuit | Note F: too unreliable to be published | Note F: too unreliable to be published | Note F: too unreliable to be published | Note F: too unreliable to be published | Note F: too unreliable to be published | Note F: too unreliable to be published | Note F: too unreliable to be published | Note F: too unreliable to be published | Note F: too unreliable to be published | Note F: too unreliable to be published | Note F: too unreliable to be published | Note F: too unreliable to be published |
| Non-indigenous | 954 | 964 | 1014 | 958 | 1,076 | 1,110 | 1,068 | 1,071 | 1,084 | 1,026 | 1,024 | 1,056 |
| Visible minorityTable 4 Note 6 | Note ..: not available for a specific reference period | Note ..: not available for a specific reference period | Note ..: not available for a specific reference period | Note ..: not available for a specific reference period | 974 | 999 | 970 | 952 | 962 | 902 | 897 | 933 |
| South Asian | Note ..: not available for a specific reference period | Note ..: not available for a specific reference period | Note ..: not available for a specific reference period | Note ..: not available for a specific reference period | 989 | 1,001 | 968 | 1,002 | 968 | 886 | 888 | 908 |
| Chinese | Note ..: not available for a specific reference period | Note ..: not available for a specific reference period | Note ..: not available for a specific reference period | Note ..: not available for a specific reference period | 961 | 927 | 916 | 955 | 932 | 923 | 953 | 967 |
| Black | Note ..: not available for a specific reference period | Note ..: not available for a specific reference period | Note ..: not available for a specific reference period | Note ..: not available for a specific reference period | 848 | 898 | 962 | 910 | 991 | 806 | 845 | 843 |
| Not a visible minority | Note ..: not available for a specific reference period | Note ..: not available for a specific reference period | Note ..: not available for a specific reference period | Note ..: not available for a specific reference period | 1,117 | 1,151 | 1,107 | 1,124 | 1,124 | 1,069 | 1,061 | 1,100 |
|
.. not available for a specific reference period F too unreliable to be published
|
||||||||||||
- Date modified: