
Income Research Paper Series
Experimental estimates of family weekly income for January to September 2020

Archived Content
Information identified as archived is provided for reference, research or recordkeeping purposes. It is not subject to the Government of Canada Web Standards and has not been altered or updated since it was archived. Please "contact us" to request a format other than those available.
Skip to text
Text begins
The unprecedented economic situation brought on by the COVID-19 pandemic has increased the demand for trusted information on the economy and society. For example, there is interest in knowing the effect that government income support programs, such as the Canadian Emergency Response Benefit (CERB), have had on the incomes of Canadian families during the pandemic. Given that the pandemic disproportionately impacted lower-wage workers, did the COVID emergency benefits prevent a surge in the proportion of low-income families in 2020? Unfortunately, annual low-income estimates based on family income are generated using tax-filer data and are usually only available about 14 months after the end of the reference year.
To help fill the need for up-to-date data on family income trends during the pandemic, Statistics Canada is developing an experimental method for examining family weekly income patterns. The approach integrates weekly earnings available from the Canadian Labour Force Survey (LFS) together with information specific to government transfers including special COVID-19 benefits collected through administrative data sources and imputation. In the future, as the experimental weekly family income estimates are further developed, they can be used to assess the impact of government COVID relief programs for different family types, for visible minorities, by sex, or other demographic characteristics.
The objective of this paper is to describe the initial experimental family weekly income estimates and to elicit feedback on how the methods can be improved in future iterations. In particular, there are notable limitations to the approach at this time. For instance, the experimental family weekly income estimate only applies to persons living in provinces, covers selected income sources, and can (presently) only be computed for families without self-employed persons or seniors. Nevertheless, the initial findings suggest that CERB benefits offset a potential surge in low income from February 2020 to April 2020 for a large portion of Canadian families. Similar results have emerged in the United States, whereby poverty declined in the first few months after the start of the pandemic as a result of emergency response measures in that country.
The paper proceeds as follows. Section 1 provides an overview of the Canadian labour market during the pandemic and some of the emergency benefits that were made available to Canadians. Section 2 summarises findings from the United States on how their emergency benefits served to stabilize incomes and Section 3 describes the data sources and methodology used to create experimental family weekly income estimates for Canada. Findings from these estimates are discussed in Section 4, caveats and potential improvements are discussed in Section 5.
1. The Canadian labour market during the pandemic and the Federal government’s response
The pandemic-induced economic shutdown precipitated large declines in employment, from 19.2 million workers in February to 16.2 million workers in April. While much improved at 18.6 million workers, employment had still not returned to pre-pandemic levels by November.Note Among paid employees, the lowest earners were hit hardest by job losses.Note
The Federal government responded to the pandemic with a number of emergency relief packages that provided income support directly to Canadians. Most prominent in these measures was the CERB, which provided employed or self-employed Canadians directly affected by COVID-19 with payments of $500 a week, reflecting roughly the equivalent of minimum wage earnings for full-time employees.Note Financial support was also provided to post-secondary students via the Canadian Emergency Student Benefit (CESB).
Several one-time increases to payments under various means-tested programs were also introduced during the pandemic. In particular, individuals who received the Goods and Services Tax Credit (GST) received an additional payment in April and monthly Canada Child Benefit (CCB) payments were supplemented in May.
While aggregate labour income declined sharply, disposable income increased 10.8% in the second quarter due to the decline in wages and salaries being more than offset by the pandemic relief programs such as the CERB and CESBNote . Although COVID-emergency relief benefits were large enough to offset aggregate earnings losses, there are still many unanswered questions about the effectiveness of the emergency benefits in providing income security to Canadians. For example, given that the pandemic largely impacted lower-wage workers, did the COVID emergency benefits prevent a surge in low-income families in 2020? The experimental family weekly income measures being developed in this paper are intended to answer questions such as these.
2. Results from the United States
Researchers in the United States have made gains in measuring the impact of the pandemic on poverty in that country. Drawing from the monthly Current Population Survey (CPS)Note , Saenz and Sherman (2020) show that labour market disruptions resulted in an increase in persons with below-poverty family earnings in the US between February and April. Also drawing on the CPS but expanding the income concept to include government relief measures introduced during the pandemic, Han, Meyer and Sullivan (2020) show a reduction in the percent of people below the US poverty line between February and June. Parolin et al (2020) also show a reduction in poverty in March through May, with poverty stabilising near pre-pandemic levels after May.
What’s novel about these studies is the use of monthly data to measure income and poverty concepts that are often tackled with annual data. Given the nature of the pandemic and the urgent need for timely information on the economic impact of the pandemic-driven disruption on individuals and their families, these new approaches add a complementary perspective that responds to that need.
3. Developing experimental family weekly income estimates for Canada
The LFS is the underlying data source used to develop experimental family weekly income estimates described in this study. The LFS provides weekly earnings information which are defined here as usual weekly earnings adjusted by the ratio of actual hours to usual hours to account for the fact that during the pandemic period, many workers may work less than their usual hours. The LFS has also recently been asking respondents to report their self-employment income, however these data are often reported on an annual basis and have not been fully assessed yet. Therefore we exclude families with self-employed persons from the initial approach. As the approach becomes more refined, future iterations could include families with self-employed persons.
The strategy for estimating weekly family income is to add selected government transfers to the weekly wages and salaries of families in the LFS. In this experimental estimate, benefit entitlements information from the following administrative data programs have been merged to the LFS data: the CCB, the Goods and Services and Harmonized Sales Tax credit (G/HST), Employment Insurance (EI) and the Canada Emergency Response Benefit (CERB) programs. Provincial child benefits are computed based upon information retrieved from the CCB administrative file.
Income for seniors is largely composed of private pension income, Canada and Quebec Pension Plan income, Old Age Security and Guaranteed Income Supplement benefits. These sources are presently not available to Statistics Canada on a sub-annual basis for 2020, so families with seniors are also excluded from the experimental estimates.
After removing families with self-employed persons and families with seniors, families captured by the experimental income estimates account for roughly 60% of Canadians in provincesNote . Income sources included in the experimental estimates are also incomplete. For example, sources such as social assistance, alimony and child support received and investment income are not captured. However, in 2018, the income sources included did account for about 90% of total income for non-senior, non-self-employed families.
Most of the government benefits included in the experimental family weekly income estimates are drawn from high quality administrative data which are linked to Labour Force Survey records. Lump-sum, monthly and quarterly benefit payments are divided by the number of weeks to convert to a weekly estimate where appropriate. The additional CCB payment introduced in May for instance, is converted to a weekly amount and appears as income in the LFS reference week in May alone. The GST supplement introduced in April on the other hand, is converted to a weekly amount and distributed over the three LFS reference weeks (April – June) that correspond to the quarterly GST benefit period. EI and CERB administrative records correspond to the specific LFS reference week and are linked to the LFS directly with no need for weekly conversions.
However, at the time of writing, CERB administrative data was only available to Statistics Canada for a portion of CERB payments (full CERB data is now available to Statistics Canada). The remaining CERB records are imputed based upon questions on the Labour Force Survey – Fast Track Option (LFS-FTO) that asked respondents whether they had applied for or received CERB benefits. These questions changed over the pandemic period, and may be a source of error in the estimates. For instance, in April and May respondents were asked if they made a new application for CERB since March 15 and in June respondents were asked if they received a payment for CERB since March 15. The question changed again over July to September where respondents were asked if they received a CERB payment in the last monthNote .
As such, responses to these questions are cleaned before CERB amounts are imputed to yield a relatively conservative imputation at this step. In particular, CERB amounts are not imputed for LFS respondents who reported having applied for or received CERB over the previous period but report working their usual hours (or more) during the LFS reference week. In the future, when Statistics Canada incorporates all CERB administrative data, the estimates will be reproduced without the need for this type of imputation.
Chart 1 shows benchmark estimates of aggregate CERB benefits in each LFS reference week, comparing total benefits from the integrated LFS and CERB administrative data (labelled “Available on Administrative data” in the chart) plus the imputed CERB benefits (labelled “Imputed using edited responses” in the chart) to total benefit payments reported by the Government of Canada (labelled “published estimates”)Note . This chart includes CERB benefits given to paid employees as well as the self-employed. Generally CERB benefits imputed in this study account for 50% to 60% of aggregate benefits. Overall, the benefits accounted for in this study compare well to statistics published by the government of CanadaNote .

Data table for Chart 1
| LFS reference week | Available on administrative data | Imputed using edited responses | Published estimates |
|---|---|---|---|
| $ millions | |||
| Mar 15-21 | 412 | Note ..: not available for a specific reference period | Note ..: not available for a specific reference period |
| Apr 12-18 | 1,196 | 1,293 | Note ..: not available for a specific reference period |
| May 10-16 | 1,054 | 1,436 | Note ..: not available for a specific reference period |
| Jun 14-20 | 404 | 1,378 | 1,904 |
| Jul 12-18 | 759 | 830 | 1,848 |
| Aug 9-15 | 571 | 794 | 1,570 |
| Sep 13-19 | 588 | 605 | 1,310 |
.. not available for a specific reference period
|
|||
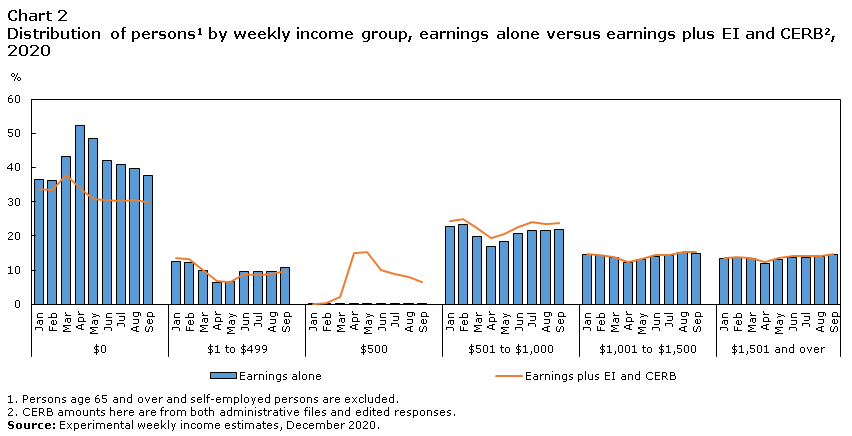
Chart 2 gives additional information relevant to the construction of the experimental estimates. Specifically it shows estimates of the distribution of individual income under different income definitions: (1) income from wages and salaries (earnings alone) and (2) income from wages and salaries + EI and CERB (earnings plus EI and CERB). The results show that an important outcome from CERB was to reduce the increase in the share of persons with zero earnings, and increase the share of persons with $500.
Data table for Chart 2
| Income level | Month | Earnings alone | Earnings plus EI and CERB |
|---|---|---|---|
| % | |||
| $0 | Jan | 36.6 | 33.8 |
| Feb | 36.1 | 33.4 | |
| Mar | 43.1 | 37.9 | |
| Apr | 52.4 | 34.1 | |
| May | 48.5 | 30.7 | |
| Jun | 42.0 | 30.4 | |
| Jul | 40.8 | 30.2 | |
| Aug | 39.6 | 30.5 | |
| Sep | 37.6 | 30.0 | |
| $1 to $499 | Jan | 12.6 | 13.6 |
| Feb | 12.4 | 13.3 | |
| Mar | 10.0 | 10.1 | |
| Apr | 6.4 | 6.8 | |
| May | 6.8 | 6.6 | |
| Jun | 9.5 | 8.7 | |
| Jul | 9.6 | 8.5 | |
| Aug | 9.7 | 8.8 | |
| Sep | 10.9 | 9.7 | |
| 500 | Jan | 0.2 | 0.2 |
| Feb | 0.2 | 0.3 | |
| Mar | 0.1 | 2.2 | |
| Apr | 0.1 | 15.0 | |
| May | 0.2 | 15.4 | |
| Jun | 0.1 | 10.0 | |
| Jul | 0.1 | 8.9 | |
| Aug | 0.1 | 7.9 | |
| Sep | 0.2 | 6.4 | |
| $501 to $1,000 | Jan | 22.7 | 24.4 |
| Feb | 23.2 | 24.8 | |
| Mar | 19.9 | 22.3 | |
| Apr | 17.0 | 19.4 | |
| May | 18.4 | 20.6 | |
| Jun | 20.7 | 22.5 | |
| Jul | 21.5 | 24.0 | |
| Aug | 21.6 | 23.4 | |
| Sep | 21.8 | 23.7 | |
| $1,001 to $1,500 | Jan | 14.6 | 14.6 |
| Feb | 14.4 | 14.4 | |
| Mar | 13.6 | 13.9 | |
| Apr | 12.2 | 12.4 | |
| May | 13.0 | 13.2 | |
| Jun | 13.9 | 14.3 | |
| Jul | 14.3 | 14.5 | |
| Aug | 15.0 | 15.3 | |
| Sep | 15.0 | 15.3 | |
| $1,501 and over | Jan | 13.3 | 13.4 |
| Feb | 13.7 | 13.8 | |
| Mar | 13.3 | 13.5 | |
| Apr | 11.9 | 12.3 | |
| May | 13.1 | 13.6 | |
| Jun | 13.8 | 14.1 | |
| Jul | 13.7 | 14.0 | |
| Aug | 13.9 | 14.1 | |
| Sep | 14.6 | 14.8 | |
|
|||
4. Experimental measures of below-LIM weekly income
For this study, the share of the population with weekly family earnings below the threshold appropriate to their family size is referred to as having “below-LIM weekly earnings” and the share of the population with experimental weekly family income below the threshold appropriate to their family size is referred to as having “below-LIM weekly income”. Low income thresholds are determined based upon dividing thresholds for the Low-Income Measure – After-Tax (LIM-AT)Note for 2018 by 52 to represent the amount of income that would be needed each week to sum up to the LIM value, then inflated to monthly values using the Consumer Price Index (CPI). For example, the low weekly income threshold for a one person family in September 2020 was $477 and for a four person family it was $954.
Chart 3 presents experimental estimates of low-family weekly income according to various income measures. Reflecting the state of the Canadian labour market, the share of persons in non-senior, non-self-employed families with below-LIM weekly earnings rose from 26% in February to 38% in April before steadily returning to below 26% by AugustNote .
Adding child benefits and Goods and Services Tax and Harmonised Sales Tax credits (GST/HST) shifted the levels of low income down, but even with the one-time increases April and May, did not “smooth out” the dramatic rise in low income associated with the loss in family earnings among families.
With the addition of EI and CERB income, it is seen that the large peak in low-weekly family income in April was virtually eliminated, and that the share persons in families with below-LIM weekly income was estimated to be roughly 16% from May through September. Estimates using the same methodology are presented for 2018 and 2019, indicating a low weekly family-income estimate of about 20% in the months of 2018 and 2019, through February 2020.
Chart 3 also shows estimates for low income without the imputation of CERB records. Each source for CERB data (the administrative data and the imputed data) account for about equal shares of the reduction in low income resulting from CERB. As mentioned earlier, the attempt has been made to impute a conservative number of CERB records where administrative data is missing, though there is still the possibility that the imputation could contribute to an over or understatement of the size of the reduction in low income implied by CERB.

Data table for Chart 3
| Month | Weekly income, 2018 | Weekly income, 2019 | Weekly earnings, 2020 | Weekly earnings plus child benefits and GST/HST credits, 2020 | Weekly income (CERB available from admininstrative data only), 2020 | Weekly income, 2020 |
|---|---|---|---|---|---|---|
| % | ||||||
| Jan | 21.1 | 22.2 | 27.1 | 23.6 | 21.7 | 21.7 |
| Feb | 21.2 | 21.9 | 26.4 | 23.1 | 21.4 | 21.4 |
| Mar | 21.4 | 21.7 | 30.3 | 26.7 | 23.3 | 23.3 |
| Apr | 22.3 | 22.5 | 38.2 | 33.9 | 26.7 | 22.1 |
| May | 21.2 | 20.0 | 34.0 | 28.2 | 21.1 | 15.9 |
| Jun | 21.2 | 19.4 | 29.7 | 25.6 | 22.5 | 17.5 |
| Jul | 21.7 | 20.2 | 26.4 | 23.1 | 19.1 | 16.9 |
| Aug | 21.7 | 20.4 | 25.3 | 22.1 | 19.0 | 16.1 |
| Sep | 21.0 | 20.0 | 24.2 | 20.8 | 17.7 | 15.8 |
| Oct | 22.8 | 21.7 | Note ..: not available for a specific reference period | Note ..: not available for a specific reference period | Note ..: not available for a specific reference period | Note ..: not available for a specific reference period |
| Nov | 21.4 | 21.2 | Note ..: not available for a specific reference period | Note ..: not available for a specific reference period | Note ..: not available for a specific reference period | Note ..: not available for a specific reference period |
| Dec | 21.1 | 20.8 | Note ..: not available for a specific reference period | Note ..: not available for a specific reference period | Note ..: not available for a specific reference period | Note ..: not available for a specific reference period |
.. not available for a specific reference period
Source: Experimental weekly income estimates, December 2020. |
||||||
5. Caveats and potential improvements
The estimates presented in this paper make use of the data available at this time and will be improved as new data becomes available. As such, it is important to point out that results presented here are preliminary and due to the experimental nature of these estimates, users are advised to use caution when interpreting the results. That said, feedback on how these estimates can be improved is encouraged.
Over the course of the pandemic, the LFS collection was adapted by replacing face-to-face interviews by telephone interviews, resulting in a lower response rate. While considerable efforts has been put into minimizing this decline and into monitoring the characteristics of LFS respondents over this period, no study has been completed regarding the effects of declining LFS response rates on weekly earnings. This suggests one reason for interpreting the results with caution. Analytical work such as conducting robustness checks and computing sampling errors also remains to be done.
One key area for improvement is to expand coverage of the population included in these estimates. In particular, expanding coverage to include the self-employed is a priority as the impact of the COVID-induced shutdown was very different for the self-employed compared to employees. Although employment losses were less pronounced for the self-employed, as of November, employment for this group was still far away from pre-pandemic levelsNote . Moreover, the self-employed experienced a much larger drop in hours worked compared to employeesNote . The CERB may have been particularly useful to these persons, who would often not have been eligible for regular EI.
Expanding the income concepts captured by the estimates and improving data sources will also be a focus going forward. For instance, the current approach includes only payments of CERB benefits – not any repayments. Moreover, as indicated earlier, some CERB administrative data was not available to Statistics Canada when this paper was written, therefore some CERB receipts have been imputed based upon survey responses. Future iterations of the experimental family income estimate will also include additional income sources such as the Canada Emergency Student Benefit (CESB) and newer programs such as the Canada Recovery Benefit (CRB) which have replaced the CERB. Other government benefits such as provincial income assistance or special pandemic-related amounts may also be added.
Ultimately, once the methodology becomes firm, the estimates will, where possible, be disaggregated to different provinces, by age, sex or family type, by visible minority status and for Indigenous Peoples. Understanding the impact of the pandemic on these populations is paramount to policy development work to support at-risk populations going forward.
References
Han, Jeehoon, Bruce D Meyer, and James X. Sullivan (2020), “Real-time Poverty Estimates During the COVID-19 Pandemic through October 2020”, Poverty Measurement Working Paper. http://povertymeasurement.org/wp-content/uploads/2020/11/Real_time_Poverty_Estimates_through_October_2020.pdf
Parolin, Zachary, Megan Curran, Jordan Matsudaira, Jane Waldfogel, and Christopher Wimer (2020), “Monthly Poverty Rates in the United States during the COVID-19 Pandemic”, Poverty and Social Policy Working Paper. https://static1.squarespace.com/static/5743308460b5e922a25a6dc7/t/5f87c59e4cd0011fabd38973/1602733471158/COVID-Projecting-Poverty-Monthly-CPSP-2020.pdf
Saenz, Matt and Arloc Sherman (2020), “Research Note: Number of People in Families with Below-Poverty Earnings has Soared, Especially Among Black and Latino Individuals”, Centre on Budget and Policy Priorities, Research Note. https://www.cbpp.org/research/poverty-and-inequality/research-note-number-of-people-in-families-with-below-poverty
- Date modified: