
Income Research Paper Series
Canadians’ satisfaction with their housing: Highlights from the 2018 Canadian Housing Survey
by Jonathan David Fonberg and Grant Schellenberg
Social Analysis and Modelling Division
Skip to text
Text begins
1. Introduction
Housing is a basic human need that provides a foundation for much of life. The dwellings in which we live provide shelter from the elements, privacy and safety from the outside world, and a space to share with family and friends. Housing can provide stability -- a place where one prepares for the day and makes plans for the future. For most households, expenditures on housing account for a significant share of the monthly budget, and if dwellings are owned, they comprise a large share of most households’ wealth.Note
Information on house prices, vacancy rates, building permits and other housing topics is published regularly in Canada, providing important metrics for various purposes and users. But such metrics tell us little about how Canadians’ themselves view the dwellings in which they live. For example, to what extent are Canadians satisfied with their homes? To what extent are they satisfied with specific aspects of their homes, such as their size, energy efficiency or affordability? Does housing satisfaction vary between groups, such as owners and renters, residents in detached houses or high-rise apartments, or households in large urban centres or small communities? Such assessments reflect the perceptions and experiences of individuals themselves, and provide a useful complement to the existing stock of housing information in Canada.
New information on Canadians’ satisfaction with their housing was collected on the Canadian Housing Survey (CHS) fielded in late-2018 and early-2019. The CHS is part of a broader data development initiative being undertaken collaboratively by Statistics Canada and the Canada Mortgage and Housing Corporation (CMHC) in support of the Federal Government’s National Housing Strategy. The survey was completed by a nationally representative sample of over 65,000 Canadians, with questions on housing satisfaction comprising one segment of the survey.
The objective of this paper is to provide a high-level overview of CHS results on housing satisfaction. The intent is to showcase these results in a broad and accessible way, making new information available to a general readership and providing a starting point for further research using the CHS. The results are presented using geographic area of residence, housing tenure (i.e. owners and renters), and dwelling type as an organizing framework. The relevance of these variables to housing satisfaction has been documented in the research literature and are used in the presentation of many of the data tables that CMHC provides (Sørensen, J. F. 2014; Balestra, C., & Sultan, J. 2013; Pekkonen, M., & Haverinen-Shaughnessy, U. 2015; Borgoni, R., Michelangeli, A., & Pirola, F. 2018). The results below show that, on average, overall housing satisfaction and satisfaction with specific aspects of housing are lower in large urban centres than in smaller communities and rural areas, among renters than owners, and among households in multi-unit dwellings than those in single detached houses. These results are based on bivariate relationships, as ‘control variables’ such as household income and health status, are not included in the analysis.
The paper is structured as follows. In Section 2, data, key concepts and methodological issues are discussed. In Section 3, Canadians’ overall satisfaction with their dwelling is documented, while in Section 4 their satisfaction with specific aspects of their dwellings is shown. Socio-demographic characteristics are introduced in Section 5, with information on housing satisfaction provided across sex, age and household size. Conclusions are drawn in Section 6.
2. Data, Concepts and Methods
Data
The CHS is a new survey sponsored by CMHC. It collects information from Canadian households on their dwellings, communities, housing needs and housing experiences. The CHS is fielded in all provinces and territoriesNote and is a biennial survey that will run for the next ten years. The target population is private households and the sampling unit is the dwelling. Collective dwellings, such as nursing homes, seniors’ residences, and shelters, are excluded. A reference person in each sampled household, identified as the household member responsible for housing decisions, was asked to complete the CHS questionnaire.Note Hence, responses regarding housing satisfaction reflect the view of the reference person and not all household members. For sake of simplicity, results in this paper are presented as the share of households reporting satisfaction with their dwelling, recognizing that this is the view of the reference person.Note
Statistics Canada is disseminating results from the CHS in stages to provide key indicators in a timely manner. The first results will be released in November 2019. This paper, along with a companion paper on neighbourhood satisfaction and data tabulations, are part of that release. Information on income, immigration and housing-related characteristics drawn from administrative data sources will be incorporated into the CHS in early 2020, and the full CHS microdata file will be available in spring 2020. For this reason, variables such as household income and immigration status are not included in the analysis below.
Housing satisfaction
CHS respondents were asked the following question:
- How satisfied are you with your dwelling? Are you:
- Very satisfied, Satisfied, Neither satisfied nor dissatisfied, Dissatisfied, Very Dissatisfied
They were subsequently asked about their satisfaction with specific aspects of their dwelling using the same five-point response scale. SpecificallyNote :
- How satisfied are you with the following aspects of your dwelling?
- Having enough space overall in your home
- Having enough bedrooms
- Being affordable
- Its condition (e.g. well maintained)
- Blocking regular noise from outside or from neighbours
- Being safe and secure within the home
- Being energy efficient
- Being able to maintain a comfortable temperature in the winter
- Being able to maintain a comfortable temperature in the summer
The vast majority of respondents provided a valid response to these questions, with less than 1% providing either no response.
A large volume of information results when 10 housing satisfaction questions are disaggregated by place of residence, housing tenure, dwelling type, and other characteristics. For the sake of brevity and clarity, responses of ‘satisfied’ and ‘very satisfied’ are aggregated and presented below. More detailed results using the full five-point response scale are available in tabulations available on Statistics Canada’s website.
Place of residence, housing tenure and dwelling type
Place of residence, housing tenure, and dwelling type are used as an organizing framework for much of this paper. The relationships between these variables are shown in Table 1. In the table, households are divided into three groups based on their place of residence, defined using concepts from the Census of Population. The first column includes individuals living in one of Canada’s 35 Census Metropolitan Areas (CMAs).Note The sampling strata used for the CHS allows 16 CMAs to be identified, with the remainder grouped into an ‘Other CMAs’ category. The second column includes individuals living in one of Canada’s 117 Census Agglomerations (CAs). These are smaller cities and towns that have a population core of at least 10,000 people. Nanaimo, Swift Current, Val-d’Or and Gander are a few examples. The third column includes individuals who reside in smaller communities and rural areas outside of CMAs and CAs. Overall, 71% of Canadian households reside in CMAs, 13% reside in CAs, and 16% reside in smaller communities and rural areas.
Housing tenure and dwelling types vary a great deal across these areas. In terms of tenure, the rate of home ownership is lowest in CMAs, where 65% of households reside in a dwelling that is owned by a household member and 35% reside in a dwelling that is rented. The rate of home ownership is higher in CAs, at 70%, and higher still in small communities and rural areas, at 83%.
Dwelling types also vary across these areas of residence. In CMAs, 43% of households reside in detached houses, while this is the case for 60% of households in CAs and 80% of households in small communities and rural areas. Households that do not live in detached houses primarily live in multi-unit dwellings.Note In CAs and smaller communities and rural areas, the largest shares of these households reside in low-rise apartments and in semi-detached house,Note while in CMAs a considerable share (15%) also resides in high-rise apartments.
Finally, four categories can be derived from the intersection of housing tenure and dwelling type, as shown in the bottom panel of Table 1. These include:
- ‘owner-detached’, defined as households living in single detached houses that are owned by a household member;
- ‘owner-multi-unit’, defined as households living in a multi-unit dwelling, in a unit that is owned by a household member;
- ‘renter-detached’, defined as households living in single detached houses that are rented by a household member;
- ‘renter-multi-unit’, defined as households living in a multi-unit dwelling, in a unit that is rented by a household member.Note
Across areas of residence, owner-detached households comprise 40% of households in CMAs, while they comprise 56% of those in CAs and 77% of those in smaller communities and rural areas. Most other households are either ‘owner-multi-unit’ or ‘renter-multi-unit’ households, both of which are most prevalent in CMAs. Households categorized as ‘renter-detached’ account for only about 3% of households in CMAs and for 6% of households in smaller communities and rural areas.Note
Overall, the composition of households in large urban centres differs from those in mid-sized cities and small communities and rural areas in terms of both housing tenure and dwelling type. We now examine the extent to which housing satisfaction varies across these characteristics.
| Large Urban Centres (CMAs) | Cities and Towns (CAs) | Small communities & rural areas outside of CMAs and Cas | Total | |
|---|---|---|---|---|
| percent | ||||
| Tenure | ||||
| Owner | 65.0 | 70.2 | 82.6 | 68.5 |
| Renter | 35.0 | 29.8 | 17.4 | 31.5 |
| Total | 100.0 | 100.0 | 100.0 | 100.0 |
| Type of dwelling | ||||
| Single detached | 43.0 | 59.9 | 80.3 | 51.2 |
| Multi-unit Dwelling | 56.6 | 37.5 | 16.0 | 47.5 |
| Semi-detached, Duplex | 11.7 | 10.7 | 5.6 | 10.6 |
| Row | 7.8 | 5.3 | 2.5 | 6.6 |
| Low-Rise apartment | 21.6 | 19.1 | 7.7 | 19.0 |
| High-Rise apartment | 15.4 | 2.4 | 0.2 | 11.3 |
| Moveable dwelling | 0.4 | 2.5 | 3.7 | 1.2 |
| Total | 100.0 | 100.0 | 100.0 | 100.0 |
| Tenure-dwelling type | ||||
| Owner - Single detached | 40.1 | 56.4 | 77.4 | 48.1 |
| Owner - Multi-unit | 24.8 | 13.3 | 5.2 | 20.2 |
| Renter - Single detached | 3.1 | 5.1 | 6.0 | 3.8 |
| Renter - Multi-unit dwelling | 32.0 | 25.2 | 11.4 | 27.9 |
| TotalTable 1 Note 1 | 100.0 | 100.0 | 100.0 | 100.0 |
Source: 2018 Canadian Housing Survey |
||||
3. Housing satisfaction
Across Canada, most households are satisfied with the dwellings in which they live, with 83% reporting they are either satisfied or very satisfied in this respect.Note Across the provinces and territories, levels of housing satisfaction are highest in Newfoundland and Labrador at 88%, and lower in British Columbia and Ontario, at 81% (Chart 1). The share of households in Nunavut who are satisfied or very satisfied with their dwelling (at 66%) is much smaller than in other jurisdictions. In part, this reflects the much larger share of households in Nunavut in rented accommodation, particularly multi-unit dwellings (Appendix Table 1).

Data table for Chart 1
| % satisfied or very satisfied | Confidence Interval | ||
|---|---|---|---|
| Lower 95% limit | Upper 95% limit | ||
| Nvt. | 66.3 | 5.1 | 4.7 |
| N.W.T. | 78.9 | 1.5 | 1.4 |
| B.C. | 80.5 | 1.5 | 1.4 |
| Ont. | 81.2 | 1.1 | 1.1 |
| Alta. | 81.9 | 1.3 | 1.2 |
| N.S. | 82.3 | 1.7 | 1.6 |
| Man. | 82.4 | 1.6 | 1.5 |
| Sask. | 82.5 | 1.5 | 1.4 |
| Y.T. | 82.6 | 5.2 | 4.2 |
| Total | 82.6 | 0.5 | 0.5 |
| N.B. | 83.8 | 1.6 | 1.5 |
| P.E.I. | 85.6 | 2.5 | 2.2 |
| Que. | 86.0 | 1.0 | 0.9 |
| N.L. | 88.0 | 1.6 | 1.5 |
| Source: 2018 Canadian Housing Survey. | |||
Housing satisfaction varies across dwelling types and housing tenure. As shown in Chart 2, satisfaction is most prevalent among households in detached houses (at 89%) and lowest among those in high-rise apartments (at 70%). Within this range, satisfaction declines steadily across different types of multi-unit dwellings. Housing satisfaction is also correlated with tenure, with satisfaction rates 17 percentage points higher among owners than renters. Across areas of residence, housing satisfaction is lower in CMAs than in CAs and smaller communities and rural areas.

Data table for Chart 2
| % satisfied or very satisfied | Confidence Interval | ||
|---|---|---|---|
| Lower 95% limit | Upper 95% limit | ||
| Detached | 88.9 | 0.6 | 0.6 |
| Semi-detached | 83.4 | 1.8 | 1.7 |
| Row | 80.1 | 2.3 | 2.1 |
| Low-rise apt | 73.5 | 1.4 | 1.4 |
| High-rise apt | 70.3 | 2.1 | 2.1 |
| Renter | 71.2 | 1.1 | 1.1 |
| Owner | 87.9 | 0.6 | 0.6 |
| CMA | 81.1 | 0.7 | 0.7 |
| CA | 85.0 | 1.2 | 1.1 |
| Other | 87.4 | 1.2 | 1.1 |
| Source: 2018 Canadian Housing Survey. | |||
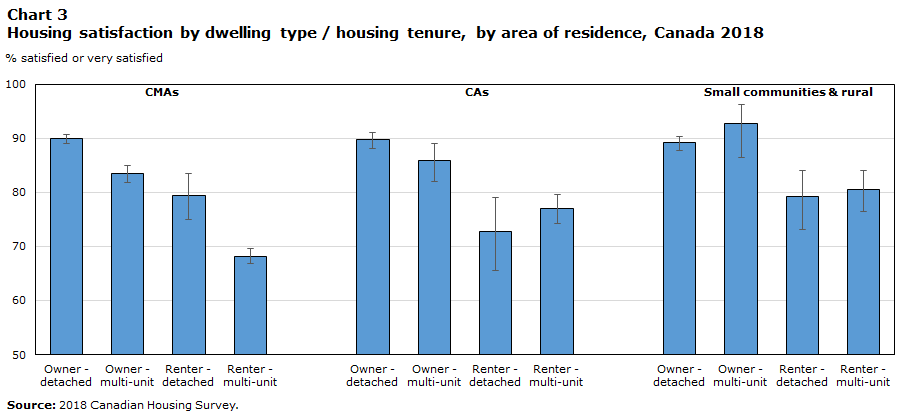
Chart 3 provides a more integrated perspective. Within CMAs, housing satisfaction is highest among ‘owner-detached’ households, at 90%, and lowest among ‘renter-multi-unit’ households, at 68%. Households residing in owned-multi-unit and rented-detached dwellings fall within this range (at 83% and 79% respectively). In CAs and smaller communities and rural areas, housing satisfaction is again highest among households in owned-detached dwellings (at roughly 90%) and lower among those in rented-multi-unit dwellings (approaching 80%).
Overall, housing satisfaction among households in owned-detached dwellings varies little across the urban-rural gradient, with approximately 90% of those in CMAs, CAs and smaller communities and rural areas expressing satisfaction in this regard. In contrast, housing satisfaction among households in rented-multi-unit dwellings is lower in CMAs (at 68%) than in CAs and in smaller communities and rural areas (at 77% and 81% respectively).
Data table for Chart 3
| % satisfied or very satisfied | Confidence Interval | ||
|---|---|---|---|
| Lower 95% limit | Upper 95% limit | ||
| CMA | |||
| Owner - detached | 89.9 | 0.9 | 0.8 |
| Owner - multi-unit | 83.4 | 1.6 | 1.5 |
| Renter - detached | 79.5 | 4.6 | 3.9 |
| Renter - multi-unit | 68.2 | 1.4 | 1.4 |
| CA | |||
| Owner - detached | 89.7 | 1.5 | 1.4 |
| Owner - multi-unit | 85.8 | 3.9 | 3.2 |
| Renter - detached | 72.8 | 7.2 | 6.2 |
| Renter - multi-unit | 77.1 | 2.8 | 2.6 |
| Small communities & rural | |||
| Owner - detached | 89.1 | 1.4 | 1.2 |
| Owner - multi-unit | 92.7 | 6.2 | 3.5 |
| Renter - detached | 79.2 | 6.0 | 4.9 |
| Renter - multi-unit | 80.6 | 4.1 | 3.5 |
| Source: 2018 Canadian Housing Survey. | |||
Several dwellings types are categorized as ‘multi-unit’ and housing satisfaction varies across these. Chart 4 is limited to households in CMAs. Over one-half of households in CMAs reside in multi-unit dwellings yielding sufficient sample size for disaggregation at this level of detail; a focus on CMAs also avoids confounding effects associated with areas of residence. Several observations can be drawn from Chart 4. First, housing satisfaction is more prevalent among owners than renters regardless of dwelling type. Among households in detached, semi-detached, and row houses, housing satisfaction is about 10 percentage points higher among owners than renters, while among households in low-rise and high-rise apartments, housing satisfaction is approximately 16 percentage points higher among owners than renters. In short, housing tenure is correlated with housing satisfaction after taking dwelling type (but not other characteristics) into account.Note
Second, housing satisfaction is frequently less prevalent among households in each type of multi-unit dwelling than among those in detached houses, regardless of housing tenure. Among home owners, housing satisfaction is 5 to 10 percentage points lower in each type of multi-unit dwelling than in detached houses, while among renters, housing satisfaction is 12 to 14 percentage points lower among households in low-rise and high-rise apartments than among those in detached homes.Note Hence, dwelling type is correlated with housing satisfaction after housing tenure (but not other characteristics) is taken into account.
Finally, when housing satisfaction is compared between owners in detached homes and renters in high-rise apartments – the groups in CMAs with the highest and lowest rates of satisfaction – a difference of 25 percentage points is observed.

Data table for Chart 4
| % satisfied or very satisfied | Confidence Interval | ||
|---|---|---|---|
| Lower 95% limit | Upper 95% limit | ||
| Owner | |||
| detached | 89.9 | 0.9 | 0.8 |
| semi-detached | 85.2 | 2.6 | 2.3 |
| row | 82.6 | 3.4 | 3.0 |
| low rise | 84.4 | 2.9 | 2.5 |
| high rise | 80.1 | 4.5 | 3.8 |
| Renter | |||
| detached | 79.5 | 4.6 | 3.9 |
| semi-detached | 76.3 | 4.2 | 3.7 |
| row | 73.2 | 3.9 | 3.6 |
| low rise | 67.6 | 2.0 | 1.9 |
| high rise | 65.2 | 2.6 | 2.5 |
| Source: 2018 Canadian Housing Survey. | |||
Thus far, housing satisfaction has been shown using fairly broad geographic categories. A more nuanced perspective is provided in Chart 5. Focusing on CMAs, the chart shows levels of housing satisfaction among households in owned-detached houses and in rented-multi-unit dwellings. The chart is limited to these two groups for ease of interpretation and to establish the range of housing satisfaction observed across and within CMAs.
Looking across CMAs, the shares of households in owned-detached houses reporting they are satisfied with their dwelling ranges from 85% in Saskatoon to 95% in Quebec City and Montréal. While inter-CMA variation is certainly evident, the prevalence of housing satisfaction among households in owned-detached dwellings across all CMAs is notable. In contrast, housing satisfaction among households in rented-multi-unit dwellings varies more across CMAs, ranging from 61% in Toronto to 78% in St. John’s and Québec City.
Looking within-CMAs, large differences in housing satisfaction are observed between households in owned-detached houses and rented-multi-unit dwellings. This difference is 25 percentage points or more in Toronto, Hamilton, Ottawa-Gatineau and Montréal, and 15 percentage points or more in eight other CMAs.

Data table for Chart 5
| Owner-detached | Renter-multi-Unit | |||||
|---|---|---|---|---|---|---|
| % satisfied or very satisfied | Confidence Interval | % satisfied or very satisfied | Confidence Interval | |||
| Lower 95% limit | Upper 95% limit | Lower 95% limit | Upper 95% limit | |||
| St. John's | 91.2 | 2.5 | 2.0 | 78.3 | 5.1 | 4.4 |
| Québec | 94.8 | 2.1 | 1.5 | 77.9 | 3.5 | 3.1 |
| Calgary | 86.1 | 3.7 | 3.0 | 73.1 | 4.7 | 4.2 |
| Halifax | 88.6 | 2.7 | 2.2 | 73.0 | 4.1 | 3.7 |
| Saskatoon | 85.1 | 3.1 | 2.7 | 72.9 | 5.2 | 4.6 |
| Other CMA | 90.5 | 1.7 | 1.5 | 72.8 | 3.2 | 3.0 |
| Regina | 86.1 | 3.1 | 2.6 | 72.3 | 4.5 | 4.1 |
| Winnipeg | 88.0 | 2.6 | 2.2 | 72.0 | 4.0 | 3.7 |
| Edmonton | 88.9 | 3.0 | 2.4 | 70.6 | 5.0 | 4.6 |
| Montréal | 95.0 | 2.2 | 1.6 | 68.9 | 3.2 | 3.0 |
| Kitchener-Cambridge-Waterloo | 91.4 | 2.6 | 2.0 | 68.6 | 4.5 | 4.2 |
| Total | 89.9 | 0.9 | 0.8 | 68.2 | 1.4 | 1.4 |
| Moncton | 86.6 | 2.9 | 2.4 | 68.2 | 5.1 | 4.7 |
| Saint John | 87.0 | 3.0 | 2.5 | 67.9 | 5.2 | 4.8 |
| Ottawa-Gatineau | 92.1 | 2.3 | 1.8 | 66.4 | 3.5 | 3.3 |
| Vancouver | 89.0 | 4.0 | 3.1 | 65.9 | 4.5 | 4.2 |
| Hamilton | 90.3 | 2.7 | 2.2 | 63.8 | 4.7 | 4.4 |
| Toronto | 87.6 | 3.4 | 2.7 | 61.5 | 4.1 | 3.9 |
| Source: 2018 Canadian Housing Survey. | ||||||
Whether home owners are still making mortgage payments or are ‘mortgage-free’ is another characteristic along which housing satisfaction can be assessed. Differences in overall housing satisfaction are generally small across this variable (Table 2). In CMAs, for example, rates of housing satisfaction are three percentage points lower among households that have a mortgage on their owned-detached house than among those who are mortgage free (at 89% and 92% respectively). Differences between households in CMAs that do or do not have a mortgage on their owned multi-unit dwelling are similar. In CAs and in smaller communities and rural areas, levels of satisfaction again differ modestly between owners of detached homes who do or do not have a mortgage (at 5 and 2 percentage points, respectively). The one notable exception to this general pattern is observed in CAs, where housing satisfaction is 10 percentage points lower among owners of multi-unit dwellings who have a mortgage (at 82%) than among those who do not (at 92%). Whether this difference is attributable to other characteristics that may differ between these groups, such as age or household size, is a topic warranting further investigation.
| CMA | CA | Small community & rural | |
|---|---|---|---|
| percent | |||
| Owner-Detached, No mortgage | 91.7 | 92.4 | 90.2 |
| Owner-Detached, With mortgage | 88.7 | 87.5 | 88.1 |
| Owner-Multi-unit, No mortgage | 85.4 | 92.0 | 93.2 |
| Owner-Multi-unit, With mortgage | 82.3 | 82.1 | 92.2 |
| Renter-Multi-unit | 68.2 | 77.1 | 80.6 |
| Source: 2018 Canadian Housing Survey | |||
4. Satisfaction with specific housing characteristics
Having considered Canadians’ overall housing satisfaction, this section explores their satisfaction with specific aspects of their dwellings. Results are again presented using area of residence, dwelling type and housing tenure as organizing variables.
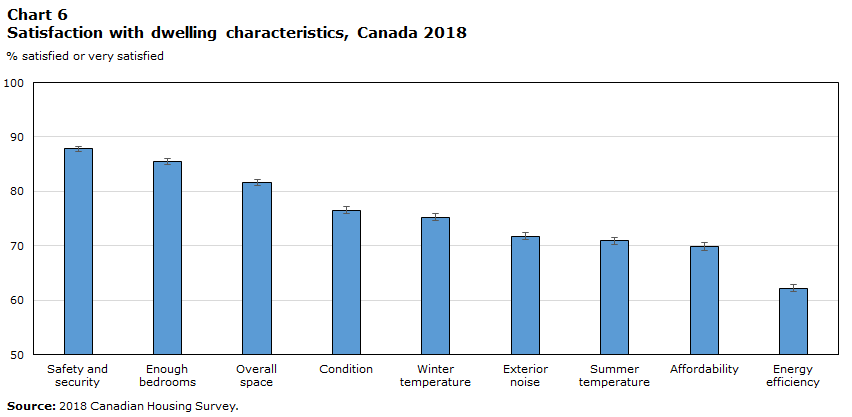
Across Canada, the largest share of Canadians express satisfaction with their sense of safety and security in their home (at 88%), followed by satisfaction with the number of bedrooms and the adequacy of overall space (at 85% and 82% respectively). The smallest shares express satisfaction with the affordability (70%) and energy efficiency (62%) of their dwelling (Chart 6).
Data table for Chart 6
| % satisfied or very satisfied | Confidence Interval | ||
|---|---|---|---|
| Lower 95% limit | Upper 95% limit | ||
| Safety and security | 87.8 | 0.5 | 0.5 |
| Enough bedrooms | 85.5 | 0.5 | 0.5 |
| Overall space | 81.6 | 0.6 | 0.5 |
| Condition | 76.5 | 0.6 | 0.6 |
| Winter temperature | 75.3 | 0.6 | 0.6 |
| Exterior noise | 71.8 | 0.6 | 0.6 |
| Summer temperature | 70.9 | 0.7 | 0.7 |
| Affordability | 69.9 | 0.7 | 0.7 |
| Energy efficiency | 62.2 | 0.7 | 0.7 |
| Source: 2018 Canadian Housing Survey. | |||
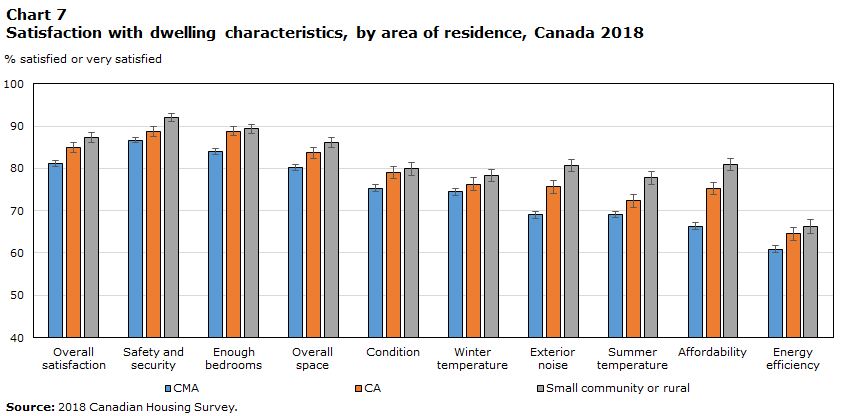
Across areas of residence, households in CMAs are less likely than those in CAs and in smaller communities and rural areas to express satisfaction with specific dwelling characteristics (Chart 7). This is most evident in terms of satisfaction with affordability (a difference of 15 percentage points) and ability to block out exterior noise (a difference of 12 percentage points). (Appendix Table 2).
Data table for Chart 7
| CMA | CA | Small community or rural | |||||||
|---|---|---|---|---|---|---|---|---|---|
| % satisfied or very satisfied | Confidence Interval | % satisfied or very satisfied | Confidence Interval | % satisfied or very satisfied | Confidence Interval | ||||
| Lower 95% limit | Upper 95% limit | Lower 95% limit | Upper 95% limit | Lower 95% limit | Upper 95% limit | ||||
| Overall satisfaction | 81.1 | 0.7 | 0.7 | 85.0 | 1.2 | 1.1 | 87.4 | 1.2 | 1.1 |
| Safety and security | 86.7 | 0.6 | 0.6 | 88.8 | 1.2 | 1.1 | 92.1 | 1.1 | 0.9 |
| Enough bedrooms | 84.0 | 0.6 | 0.6 | 88.8 | 1.2 | 1.1 | 89.4 | 1.1 | 1.0 |
| Overall space | 80.1 | 0.7 | 0.7 | 83.7 | 1.3 | 1.3 | 86.1 | 1.2 | 1.2 |
| Condition | 75.3 | 0.8 | 0.8 | 79.0 | 1.5 | 1.4 | 79.9 | 1.5 | 1.4 |
| Winter temperature | 74.4 | 0.8 | 0.8 | 76.3 | 1.5 | 1.5 | 78.3 | 1.5 | 1.4 |
| Exterior noise | 69.0 | 0.8 | 0.8 | 75.7 | 1.5 | 1.5 | 80.7 | 1.5 | 1.4 |
| Summer temperature | 69.1 | 0.8 | 0.8 | 72.4 | 1.6 | 1.5 | 77.7 | 1.5 | 1.4 |
| Affordability | 66.4 | 0.9 | 0.8 | 75.2 | 1.5 | 1.5 | 80.9 | 1.5 | 1.4 |
| Energy efficiency | 60.9 | 0.8 | 0.8 | 64.5 | 1.6 | 1.6 | 66.2 | 1.7 | 1.6 |
| Source: 2018 Canadian Housing Survey. | |||||||||
Across CMAs, CAs and smaller communities and rural areas, satisfaction with specific dwelling characteristics do not generally differ among households in owned-detached dwellings. Such households tend to be satisfied with the characteristics of their dwelling regardless of where they live. Satisfaction with affordability is one exception, with satisfaction rates considerably lower among owner-detached households in CMAs (at 73%) than among those in CAs and smaller communities and rural areas (at 78% and 81% respectively).
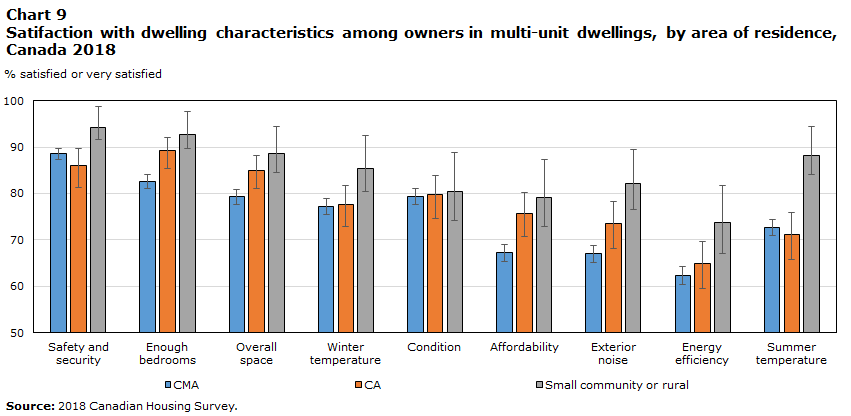
Among households in multi-unit dwellings satisfaction with specific dwelling characteristics tends to be lowest in CMAs. Chart 8 shows results for households in rented-multi-unit dwellings while Chart 9 shows results for those in owned-multi-unit dwellings. Among renters in different areas, differences in satisfaction are generally largest in terms of affordability and condition, while among owners differences are present in satisfaction with affordability, capacity to block out exterior noise and the adequacy of both overall space and number of bedrooms.

Data table for Chart 8
| CMA | CA | Small community or rural | |||||||
|---|---|---|---|---|---|---|---|---|---|
| % satisfied or very satisfied | Confidence Interval | % satisfied or very satisfied | Confidence Interval | % satisfied or very satisfied | Confidence Interval | ||||
| Lower 95% limit | Upper 95% limit | Lower 95% limit | Upper 95% limit | Lower 95% limit | Upper 95% limit | ||||
| Safety and security | 80.3 | 1.2 | 1.1 | 83.2 | 2.7 | 2.4 | 88.6 | 3.3 | 2.6 |
| Enough bedrooms | 76.5 | 1.2 | 1.2 | 85.9 | 2.5 | 2.2 | 88.3 | 3.4 | 2.7 |
| Overall space | 71.1 | 1.3 | 1.3 | 77.2 | 3.0 | 2.8 | 83.9 | 3.7 | 3.1 |
| Winter temperature | 65.9 | 1.4 | 1.3 | 69.8 | 3.2 | 3.0 | 75.1 | 4.5 | 4.0 |
| Condition | 63.3 | 1.4 | 1.4 | 74.9 | 2.9 | 2.7 | 79.0 | 4.0 | 3.5 |
| Affordability | 58.3 | 1.4 | 1.4 | 70.9 | 3.1 | 2.9 | 78.0 | 4.3 | 3.8 |
| Exterior noise | 55.6 | 1.4 | 1.4 | 64.3 | 3.2 | 3.1 | 64.8 | 5.1 | 4.8 |
| Energy efficiency | 55.1 | 1.4 | 1.4 | 61.6 | 3.2 | 3.1 | 67.0 | 4.7 | 4.3 |
| Summer temperature | 53.6 | 1.4 | 1.4 | 60.4 | 3.3 | 3.2 | 67.7 | 4.5 | 4.2 |
| Source: 2018 Canadian Housing Survey. | |||||||||
Data table for Chart 9
| CMA | CA | Small community or rural | |||||||
|---|---|---|---|---|---|---|---|---|---|
| % satisfied or very satisfied | Confidence Interval | % satisfied or very satisfied | Confidence Interval | % satisfied or very satisfied | Confidence Interval | ||||
| Lower 95% limit | Upper 95% limit | Lower 95% limit | Upper 95% limit | Lower 95% limit | Upper 95% limit | ||||
| Safety and security | 88.6 | 1.3 | 1.2 | 86.0 | 4.6 | 3.6 | 94.2 | 4.5 | 2.6 |
| Enough bedrooms | 82.6 | 1.6 | 1.4 | 89.2 | 3.8 | 2.9 | 92.7 | 4.9 | 3.1 |
| Overall space | 79.3 | 1.6 | 1.5 | 85.0 | 3.9 | 3.2 | 88.5 | 5.9 | 4.1 |
| Winter temperature | 77.3 | 1.7 | 1.6 | 77.7 | 4.7 | 4.1 | 85.4 | 7.1 | 5.0 |
| Condition | 79.4 | 1.7 | 1.6 | 79.7 | 5.0 | 4.2 | 80.5 | 8.3 | 6.3 |
| Affordability | 67.3 | 1.9 | 1.8 | 75.8 | 5.1 | 4.5 | 79.2 | 8.2 | 6.4 |
| Exterior noise | 67.0 | 1.9 | 1.8 | 73.5 | 5.4 | 4.8 | 82.2 | 7.4 | 5.6 |
| Energy efficiency | 62.3 | 1.9 | 1.9 | 64.8 | 5.2 | 4.9 | 73.7 | 8.0 | 6.7 |
| Summer temperature | 72.7 | 1.8 | 1.7 | 71.1 | 5.3 | 4.8 | 88.3 | 6.2 | 4.2 |
| Source: 2018 Canadian Housing Survey. | |||||||||
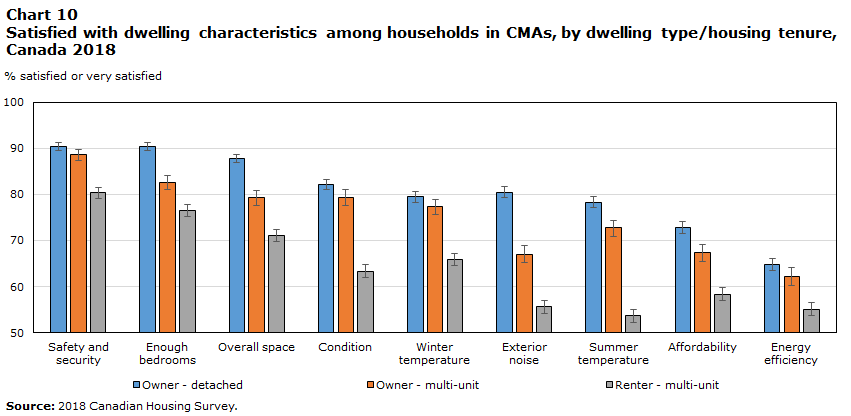
Focusing on households in CMAs allows satisfaction with housing characteristics to be compared more cleanly across dwelling types and tenure. Consistent with earlier results, satisfaction with housing characteristics are again highest among households in owned-detached dwellings and lowest among those in rented-multi-unit dwellings (Chart 10). Differences between these groups are largest in terms of satisfaction with ability to maintain a comfortable summer temperature and ability to block out exterior noise (both at 25%), dwelling condition (19%) and adequacy of space (17%). A difference of 10 percentage points or more is observed between these groups on all measures of satisfaction with housing characteristics. Once again, households in owned-multi-unit dwellings tend to lie between those of households in owned-detached and rented-multi-unit dwellings.
Data table for Chart 10
| Owner - detached | Owner - multi-unit | Renter - multi-unit | |||||||
|---|---|---|---|---|---|---|---|---|---|
| % satisfied or very satisfied | Confidence Interval | % satisfied or very satisfied | Confidence Interval | % satisfied or very satisfied | Confidence Interval | ||||
| Lower 95% limit | Upper 95% limit | Lower 95% limit | Upper 95% limit | Lower 95% limit | Upper 95% limit | ||||
| Safety and security | 90.4 | 0.9 | 0.8 | 88.6 | 1.3 | 1.2 | 80.3 | 1.2 | 1.1 |
| Enough bedrooms | 90.3 | 0.9 | 0.8 | 82.6 | 1.6 | 1.4 | 76.5 | 1.2 | 1.2 |
| Overall space | 87.7 | 0.9 | 0.9 | 79.3 | 1.6 | 1.5 | 71.1 | 1.3 | 1.3 |
| Condition | 82.1 | 1.1 | 1.0 | 79.4 | 1.7 | 1.6 | 63.3 | 1.4 | 1.4 |
| Winter temperature | 79.5 | 1.2 | 1.1 | 77.3 | 1.7 | 1.6 | 65.9 | 1.4 | 1.3 |
| Exterior noise |
80.5 | 1.2 | 1.1 | 67.0 | 1.9 | 1.8 | 55.6 | 1.4 | 1.4 |
| Summer temperature | 78.3 | 1.2 | 1.1 | 72.7 | 1.8 | 1.7 | 53.6 | 1.4 | 1.4 |
| Affordability | 72.7 | 1.3 | 1.3 | 67.3 | 1.9 | 1.8 | 58.3 | 1.4 | 1.4 |
| Energy efficiency | 64.8 | 1.3 | 1.3 | 62.3 | 1.9 | 1.9 | 55.1 | 1.4 | 1.4 |
| Source: 2018 Canadian Housing Survey. | |||||||||
Moveable Dwellings
As shown in Table 1, about 1% of dwellings in Canada are moveable dwellings, such as mobile homes. Most households (86%) residing in moveable dwellings are home owners, so further comparisons are limited to this group.
Among home owners, 79% of those residing in moveable dwellings report they are satisfied or very satisfied with their housing. This is comparable to satisfaction levels among most types of multi-unit dwellings, but lower than detached homes. In terms of satisfaction with specific dwelling characteristics, the most noticeable result is the high rate of affordability satisfaction among households in moveable dwellings relative to all other dwelling types.

Data table for Text Box 1 Chart
| Detached | Semi-detached | Row | Low rise | High rise | Moveable dwelling | |||||||||||||
|---|---|---|---|---|---|---|---|---|---|---|---|---|---|---|---|---|---|---|
| % satisfied or very satisfied | Confidence Interval | % satisfied or very satisfied | Confidence Interval | % satisfied or very satisfied | Confidence Interval | % satisfied or very satisfied | Confidence Interval | % satisfied or very satisfied | Confidence Interval | % satisfied or very satisfied | Confidence Interval | |||||||
| Lower 95% limit | Upper 95% limit | Lower 95% limit | Upper 95% limit | Lower 95% limit | Upper 95% limit | Lower 95% limit | Upper 95% limit | Lower 95% limit | Upper 95% limit | Lower 95% limit | Upper 95% limit | |||||||
| Overall satisfaction | 89.7 | 0.6 | 0.6 | 86.1 | 2.2 | 1.9 | 82.8 | 3.1 | 2.7 | 84.8 | 2.7 | 2.3 | 80.2 | 4.4 | 3.8 | 78.7 | 5.5 | 4.7 |
| Overall space | 87.6 | 0.7 | 0.7 | 83.6 | 2.3 | 2.1 | 80.3 | 3.2 | 2.9 | 79.4 | 2.9 | 2.6 | 74.0 | 4.6 | 4.2 | 76.1 | 5.6 | 4.8 |
| Affordability | 75.7 | 0.9 | 0.9 | 69.4 | 2.9 | 2.7 | 70.6 | 3.7 | 3.4 | 71.5 | 3.2 | 3.0 | 60.1 | 4.9 | 4.7 | 83.8 | 5.0 | 4.0 |
| Condition | 81.7 | 0.9 | 0.8 | 76.8 | 2.8 | 2.6 | 77.6 | 3.3 | 3.0 | 83.8 | 2.6 | 2.3 | 81.2 | 4.4 | 3.7 | 74.8 | 6.2 | 5.3 |
| Exterior noise | 81.4 | 0.9 | 0.8 | 71.4 | 2.8 | 2.6 | 68.0 | 3.6 | 3.4 | 66.3 | 3.3 | 3.1 | 64.6 | 4.9 | 4.6 | 73.4 | 5.8 | 5.1 |
| Energy efficiency | 65.5 | 1.0 | 1.0 | 61.0 | 2.9 | 2.8 | 60.1 | 3.8 | 3.7 | 65.6 | 3.2 | 3.1 | 66.9 | 4.9 | 4.6 | 59.7 | 6.3 | 6.0 |
| Source: 2018 Canadian Housing Survey. | ||||||||||||||||||
End of text box
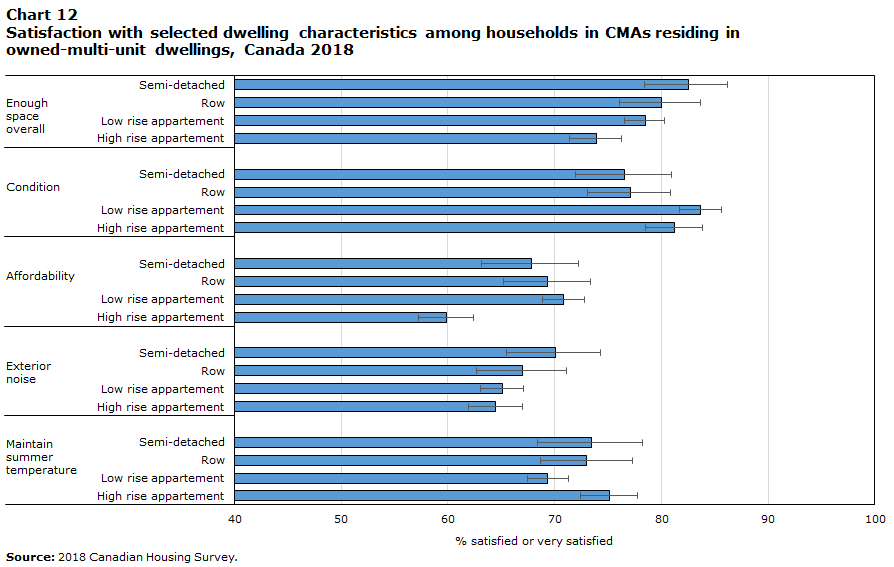
As noted earlier, various types of dwellings are categorized as ‘multi-unit’ and further disaggregation sheds light on differences between these. Just as overall levels of housing satisfaction vary across specific types of dwellings, so too does satisfaction with specific housing characteristics. Chart 11 includes households residing in rented-multi-unit dwellings in CMAs, while Chart 12 includes households in owned-multi-unit dwellings in CMAs. Both charts show satisfaction with selected housing characteristics by detailed dwelling type. A complete set of tabulations is shown in Appendix Table 2.
Among CMA households in rented-multi-unit dwellings, levels of overall satisfaction tend to be higher among those in semi-detached houses and lowest among those in high-rise apartments. This is the case for satisfaction with the adequacy of space, affordability, exterior noise, and number of bedrooms. However, renters in high-rise apartments tend to be more satisfied with the energy efficiency of their dwelling than renters of semi-detached homes and low-rise apartments (Appendix Table 2).

Data table for Chart 11
| % satisfied or very satisfied | Confidence Interval | ||
|---|---|---|---|
| Lower 95% limit | Upper 95% limit | ||
| Enough space overall | |||
| Semi-detached | 78.0 | 4.2 | 3.7 |
| Row | 72.0 | 3.9 | 3.6 |
| Low rise appartement | 72.4 | 1.9 | 1.8 |
| High rise appartement | 66.8 | 2.5 | 2.4 |
| Condition | |||
| Semi-detached | 68.1 | 4.7 | 4.3 |
| Row | 67.3 | 4.0 | 3.8 |
| Low rise appartement | 62.0 | 2.0 | 1.9 |
| High rise appartement | 62.8 | 2.7 | 2.6 |
| Affordability | |||
| Semi-detached | 67.5 | 4.7 | 4.4 |
| Row | 63.3 | 4.2 | 4.0 |
| Low rise appartement | 61.2 | 2.0 | 2.0 |
| High rise appartement | 49.7 | 2.6 | 2.6 |
| Exterior noise | |||
| Semi-detached | 65.6 | 4.6 | 4.3 |
| Row | 62.8 | 4.3 | 4.1 |
| Low rise appartement | 51.6 | 2.0 | 2.0 |
| High rise appartement | 56.8 | 2.6 | 2.5 |
| Maintain summer temperature | |||
| Semi-detached | 58.4 | 5.0 | 4.8 |
| Row | 56.7 | 4.3 | 4.2 |
| Low rise appartement | 52.1 | 1.9 | 1.9 |
| High rise appartement | 53.7 | 2.7 | 2.7 |
| Source: 2018 Canadian Housing Survey. | |||
Data table for Chart 12
| % satisfied or very satisfied | Confidence Interval | ||
|---|---|---|---|
| Lower 95% limit | Upper 95% limit | ||
| Enough space overall | |||
| Semi- detached | 82.6 | 2.7 | 2.4 |
| Row | 80.0 | 3.4 | 3.0 |
| Low rise appar- tement | 78.5 | 3.2 | 2.9 |
| High rise appar- tement | 73.9 | 4.7 | 4.2 |
| Condition | |||
| Semi- detached | 76.6 | 3.2 | 2.9 |
| Row | 77.1 | 3.7 | 3.3 |
| Low rise appar- tement | 83.7 | 2.8 | 2.4 |
| High rise appar- tement | 81.2 | 4.5 | 3.8 |
| Affordability | |||
| Semi- detached | 67.9 | 3.3 | 3.1 |
| Row | 69.4 | 4.0 | 3.7 |
| Low rise appar- tement | 70.9 | 3.4 | 3.2 |
| High rise appar- tement | 59.8 | 5.0 | 4.8 |
| Exterior noise | |||
| Semi- detached | 70.0 | 3.1 | 2.9 |
| Row | 67.0 | 3.9 | 3.7 |
| Low rise appar- tement | 65.1 | 3.5 | 3.4 |
| High rise appar- tement | 64.5 | 4.9 | 4.6 |
| Maintain summer temp. | |||
| Semi- detached | 73.4 | 2.9 | 2.7 |
| Row | 73.0 | 3.8 | 3.5 |
| Low rise appar- tement | 69.4 | 3.5 | 3.3 |
| High rise appar- tement | 75.1 | 4.7 | 4.2 |
| Source: 2018 Canadian Housing Survey. | |||
Compared to renters, satisfaction with housing characteristics varies less across owners in different types of multi-unit dwellings. As with renters, owners in high-rise apartments are less likely than those in semi-detached houses to be satisfied with the overall amount of space and the number of bedrooms they have.
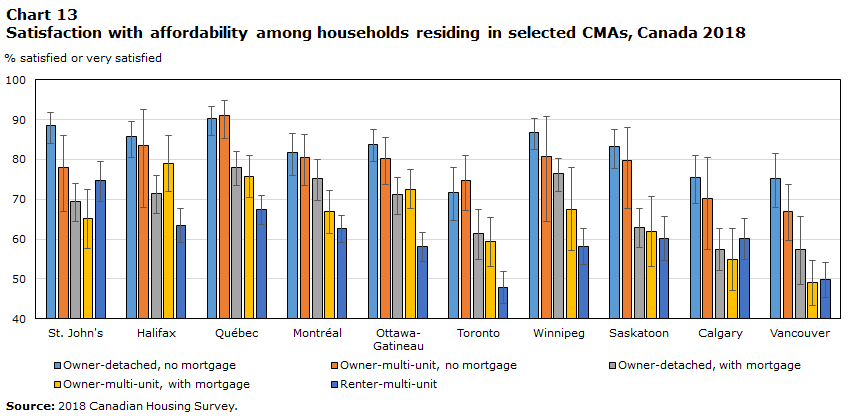
Further detail on satisfaction with housing characteristics can be provided by looking within and across CMAs. However, assessing satisfaction with nine characteristics across 17 CMAs for several types of households yields more information than can be presented in a highlights report such as this. Consequently, the analysis below is limited to satisfaction with affordability – an issue that continues to be centre stage in Canada (Chart 13).
Across all CMAs, satisfaction with housing affordability is highest among households residing in ‘mortgage-free’ dwellings, including both owner-detached (80%) and owner-multi-unit (77%) homes. Satisfaction with housing affordability is lower among households who are still making mortgage payments on their detached or multi-unit dwellings (at 68% and 62% respectively), and lowest among households in rented multi-unit dwellings (at 58%).
Data table for Chart 13
| Owner-detached, no mortgage | Owner-multi-unit, no mortgage | Owner-detached, with mortgage | Owner-multi-unit, with mortgage | Renter-multi-unit | |||||||||||
|---|---|---|---|---|---|---|---|---|---|---|---|---|---|---|---|
| % satisfied or very satisfied | Confidence Interval | % satisfied or very satisfied | Confidence Interval | % satisfied or very satisfied | Confidence Interval | % satisfied or very satisfied | Confidence Interval | % satisfied or very satisfied | Confidence Interval | ||||||
| Lower 95% limit | Upper 95% limit | Lower 95% limit | Upper 95% limit | Lower 95% limit | Upper 95% limit | Lower 95% limit | Upper 95% limit | Lower 95% limit | Upper 95% limit | ||||||
| St. John’s | 88.6 | 4.5 | 3.3 | 77.9 | 10.9 | 8.1 | 69.4 | 5.0 | 4.5 | 65.1 | 8.1 | 7.3 | 74.8 | 5.4 | 4.7 |
| Halifax | 85.7 | 5.1 | 4.0 | 83.6 | 15.6 | 8.8 | 71.4 | 5.0 | 4.5 | 78.9 | 9.4 | 7.1 | 63.5 | 4.3 | 4.1 |
| Québec | 90.2 | 4.1 | 3.0 | 91.1 | 5.9 | 3.7 | 78.1 | 4.6 | 4.0 | 75.7 | 6.2 | 5.3 | 67.5 | 3.8 | 3.5 |
| Montréal | 81.9 | 5.9 | 4.7 | 80.6 | 7.2 | 5.6 | 75.2 | 5.5 | 4.8 | 66.8 | 5.9 | 5.4 | 62.6 | 3.5 | 3.3 |
| Ottawa–Gatineau | 83.8 | 4.4 | 3.6 | 80.3 | 6.5 | 5.2 | 71.1 | 4.8 | 4.4 | 72.5 | 5.4 | 4.8 | 58.0 | 3.7 | 3.6 |
| Toronto | 71.8 | 7.2 | 6.2 | 74.7 | 7.6 | 6.4 | 61.4 | 6.4 | 6.0 | 59.3 | 6.4 | 6.1 | 47.9 | 4.0 | 4.1 |
| Winnipeg | 86.8 | 4.4 | 3.4 | 80.8 | 16.3 | 9.9 | 76.4 | 4.4 | 3.9 | 67.5 | 12.5 | 10.4 | 58.2 | 4.6 | 4.5 |
| Saskatoon | 83.2 | 5.4 | 4.3 | 79.6 | 12.0 | 8.3 | 63.0 | 5.1 | 4.8 | 62.0 | 9.6 | 8.8 | 60.3 | 5.6 | 5.3 |
| Calgary | 75.5 | 6.5 | 5.5 | 70.2 | 12.7 | 10.2 | 57.5 | 5.4 | 5.2 | 54.9 | 7.9 | 7.7 | 60.2 | 5.2 | 5.0 |
| Vancouver | 75.3 | 7.4 | 6.1 | 67.0 | 7.3 | 6.6 | 57.4 | 8.8 | 8.4 | 49.0 | 5.7 | 5.7 | 49.7 | 4.4 | 4.4 |
| Source: 2018 Canadian Housing Survey. | |||||||||||||||
This pattern is generally evident within CMAs, although levels of satisfaction with affordability vary across CMAs. Among single detached houses that are mortgage-free, satisfaction with affordability is highest in Quebec City (at 90%) and lowest in Toronto (at 72%). Similarly, among households residing in rented multi-unit dwellings, satisfaction with affordability is highest in St. John’s (at around 75%) and lowest in Toronto and Vancouver (at 48% and 50% respectively).
Start of text boxSocial and Affordable Housing
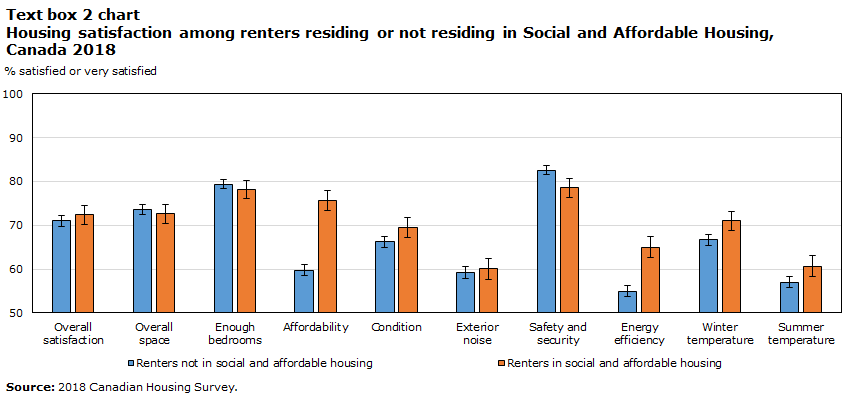
Social and Affordable Housing (SAH) refers to “non-market rental housing”; where housing allocation and rent-setting mechanisms are not entirely dictated by the law of supply and demand. Specifically, SAH aims at providing housing assistance to low or moderate income households at large. Understanding the differences between these types of renters is an important part of describing dwelling satisfaction in Canada.
Of all households in Canada, 4% reside in SAH, while 14% of all households in rented dwellings reside in SAH. Among households in rented dwellings, levels of satisfaction are comparable between those who do and do not reside in SAH, at around 72%. In terms of satisfaction with specific dwelling characteristics, the most notable difference between these groups is observed on satisfaction with affordability: 76% of renters in SAH were satisfied with this domain compared with 60% of renters not in SAH. Additionally, renters in SAH were more likely than those not in SAH to report being satisfied with the energy efficiency of their dwellings (65% and 55% respectively).
Data table for Text Box 2 Chart
| Renters not in social and affordable housing | Renters in social and affordable housing | |||||
|---|---|---|---|---|---|---|
| % satisfied or very satisfied | Confidence Interval | % satisfied or very satisfied | Confidence Interval | |||
| Lower 95% limit | Upper 95% limit | Lower 95% limit | Upper 95% limit | |||
| Overall satisfaction | 71.0 | 1.2 | 1.2 | 72.4 | 2.2 | 2.1 |
| Overall space | 73.6 | 1.2 | 1.2 | 72.6 | 2.3 | 2.2 |
| Enough bedrooms | 79.4 | 1.1 | 1.1 | 78.1 | 2.1 | 2.0 |
| Affordability | 59.7 | 1.3 | 1.3 | 75.7 | 2.4 | 2.2 |
| Condition | 66.2 | 1.3 | 1.3 | 69.5 | 2.4 | 2.3 |
| Exterior noise | 59.2 | 1.4 | 1.3 | 60.1 | 2.4 | 2.3 |
| Safety and security | 82.6 | 1.0 | 1.0 | 78.6 | 2.1 | 2.0 |
| Energy efficiency | 55.0 | 1.3 | 1.3 | 65.0 | 2.4 | 2.4 |
| Winter temperature | 66.7 | 1.3 | 1.2 | 71.1 | 2.2 | 2.1 |
| Summer temperature | 57.0 | 1.3 | 1.3 | 60.7 | 2.4 | 2.4 |
| Source: 2018 Canadian Housing Survey. | ||||||
End of text box
5. Housing satisfaction and socio-demographic characteristics
Thus far, housing satisfaction has been examined in terms of dwelling characteristics. In this section, we put people into dwellings and present housing satisfaction across gender, age, and household size of the CHS reference person. Dwelling type and housing tenure are also taken into account. Again, the intent is to provide a high-level overview of CHS results and a starting point for further research.
Gender
Men and women are equally likely to be satisfied with their dwelling, at 82% and 83% respectively. This similarity remains when housing tenure and dwelling type are taken into account (Chart 13). Among both men and women, housing satisfaction is again highest among those in owned-detached dwellings (at 89% and 90% respectively) and lowest among those in rented-multi-unit dwellings (at 68% and 71%). Likewise, levels of satisfaction with specific dwelling characteristics are similar among men and women.

Data table for Chart 14
| % satisfied or very satisfied | Confidence Interval | ||
|---|---|---|---|
| Lower 95% limit | Upper 95% limit | ||
| Female, total | 83.3 | 0.7 | 0.7 |
| Male, total | 82.0 | 0.8 | 0.8 |
| Female | |||
| Owner detached | 90.3 | 0.9 | 0.8 |
| Owner multi-unit | 84.4 | 1.9 | 1.8 |
| Renter detached | 78.7 | 4.0 | 3.5 |
| Renter multi-unit | 71.5 | 1.5 | 1.5 |
| Male | |||
| Owner detached | 89.1 | 1.0 | 0.9 |
| Owner multi-unit | 83.6 | 2.1 | 1.9 |
| Renter detached | 77.9 | 5.0 | 4.3 |
| Renter multi-unit | 68.4 | 1.9 | 1.8 |
| Source: 2018 Canadian Housing Survey. | |||
Age
Dwelling satisfaction is more prevalent among Canadians in older age groups. While 77% of CHS reference persons aged 15 to 34 report being satisfied with their dwelling, this is the case for 81% of those aged 35 to 64 and 89% of those aged 65 or older.
At least part of the difference observed between seniors and non-seniors appears to reflect varying levels of satisfaction among households in multi-unit dwellings. Among reference persons in owned-detached dwellings, housing satisfaction ranges from 87% among reference persons aged 15 to 34 to 93% among those aged 65 or older – a difference of six percentage points. Among reference persons in multi-unit dwellings, housing satisfaction varies far more across age groups. Among reference persons in owned-multi-unit dwellings, housing satisfaction ranges from 79% among those aged 15 to 34 to 90% among those aged 65 or older – a difference of 11 percentage points, while among those in rented multi-unit dwellings, housing satisfaction ranges from 65% among those aged 35 to 64 to 82% among those aged 65 or older – a difference of 17 percentage points. Overall, seniors are more likely than non-seniors to be satisfied with the multi-unit dwelling in which they reside. Whether this pattern is attributable to other characteristics that vary between age groups, such as the presence of children or household size, is a topic warranting further investigation.

Data table for Chart 15
| % satisfied or very satisfied | Confidence Interval | ||
|---|---|---|---|
| Lower 95% limit | Upper 95% limit | ||
| 15 to 34 years, total | 77.2 | 1.5 | 1.4 |
| 35 to 64 years, total | 81.2 | 0.8 | 0.7 |
| 65 years or older, total | 89.4 | 0.8 | 0.8 |
| 15 to 34 years | |||
| Owner detached | 87.1 | 2.5 | 2.1 |
| Owner multi-unit | 79.3 | 4.1 | 3.6 |
| Renter detached | 78.9 | 6.8 | 5.5 |
| Renter multi-unit | 68.8 | 2.5 | 2.4 |
| 35 to 64 years | |||
| Owner detached | 88.8 | 0.9 | 0.8 |
| Owner multi-unit | 82.1 | 2.0 | 1.9 |
| Renter detached | 76.7 | 4.1 | 3.6 |
| Renter multi-unit | 65.0 | 1.8 | 1.7 |
| 65 or older | |||
| Owner detached | 92.8 | 1.0 | 0.9 |
| Owner multi-unit | 90.5 | 2.3 | 1.9 |
| Renter detached | 82.0 | 8.0 | 6.0 |
| Renter multi-unit | 82.1 | 1.8 | 1.7 |
| Source: 2018 Canadian Housing Survey. | |||
In terms of specific housing characteristics, satisfaction rates tend to be lowest among reference persons aged 15 to 34 and highest among those aged 65 or older. Several results warrant note in this regard. Satisfaction with housing affordability varies considerably across age groups. While 60% of reference persons aged 15 to 34 are satisfied with the affordability of their dwelling, this is the case for 81% of those aged 65 or older – a difference of 21 percentage points. Reference persons aged 35 to 64 fall within this range, at 68%. Similarly, levels of satisfaction with space differ by 19 percentage points between reference persons aged 15 to 34 and those aged 65 or older, while levels of satisfaction with dwelling condition differ by 15 percentage points.
Household Size
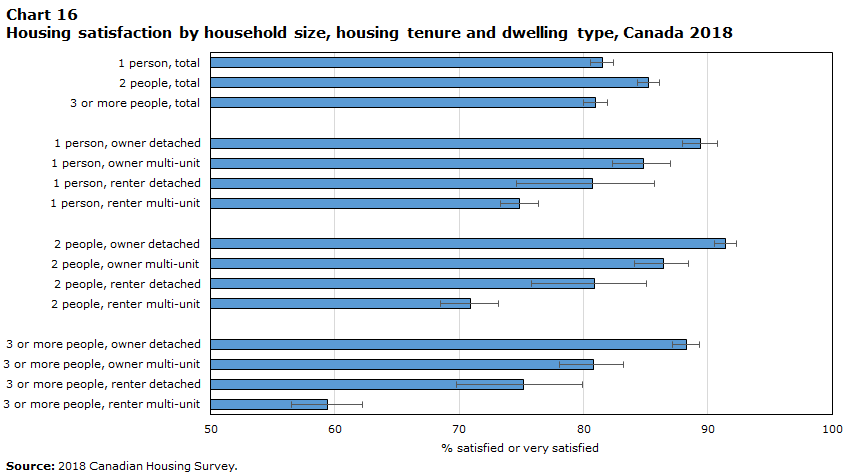
Household size has various implications for housing. While approximately 81% of reference persons in households comprised of one person or comprised of three or more persons are satisfied with their dwelling, the share is slightly higher among reference persons in two person households, at 85% (Chart 16).
The now well-established pattern of higher satisfaction across dwelling type and tenure is again evident. This is most pronounced among reference persons in households with three or more people, with a 29 percentage point difference in satisfaction levels between those in owned- detached homes and those in rented-multi-unit dwellings (at 88% and 59% respectively).
In terms of specific dwelling characteristics, levels of satisfaction tend to be similar among reference persons residing in one and two-person households, and somewhat lower among those in three-person households. For example, this is the case for satisfaction with adequacy of overall space, number of bedrooms and affordability. These differences are particularly large among households living in rented, multi-unit dwellings.
Data table for Chart 16
| % satisfied or very satisfied | Confidence Interval | ||
|---|---|---|---|
| Lower 95% limit | Upper 95% limit | ||
| 1 person, total | 81.5 | 1.0 | 0.9 |
| 2 people, total | 85.2 | 0.9 | 0.8 |
| 3 or more people, total | 81.0 | 1.0 | 0.9 |
| 1 person | |||
| Owner detached | 89.4 | 1.5 | 1.3 |
| Owner multi-unit | 84.8 | 2.5 | 2.2 |
| Renter detached | 80.7 | 6.1 | 4.9 |
| Renter multi-unit | 74.9 | 1.6 | 1.5 |
| 2 people | |||
| Owner detached | 91.4 | 0.9 | 0.8 |
| Owner multi-unit | 86.4 | 2.3 | 2.0 |
| Renter detached | 80.9 | 5.1 | 4.2 |
| Renter multi-unit | 70.9 | 2.4 | 2.3 |
| 3 or more people | |||
| Owner detached | 88.3 | 1.1 | 1.0 |
| Owner multi-unit | 80.8 | 2.7 | 2.5 |
| Renter detached | 75.2 | 5.4 | 4.7 |
| Renter multi-unit | 59.4 | 2.8 | 2.8 |
| Source: 2018 Canadian Housing Survey. | |||
6. Conclusion
Housing is more than simply a ‘roof over one’s head’. It is a basic human need that provides a foundation for much of life. In this context, how Canadians assess their housing, and specifically their satisfaction with it, provides an illuminating measure reflecting the perspectives of residents themselves. This is a useful complement to the existing stock of indicators.
Overall, most Canadians provide positive assessments of their housing, with 83% saying they are satisfied or very satisfied with it. Rates of satisfaction range from 79% to 88% across the provinces and territories, with Nunavut a notable exception. Further analysis of the CHS to shed light on the factors underlying the Nunavut result is certainly warranted.
The extent to which housing satisfaction varies across other geographic areas depends in part on the characteristics of the households being considered. Among those in owned, single detached houses, satisfaction is consistently high in CMAs, in CAs, and in small town and rural areas (at about 90%), as well as in each of the CMAs considered above. Households in owned, single detached houses also tend to be satisfied with the characteristics of their dwellings regardless of where they live, although satisfaction with affordability is lower among those in CMAs, particularly Toronto and Vancouver. In contrast, housing satisfaction among households in rented, multi-unit dwellings varies more across areas of residence, with rates of satisfaction lower among those in CMAs than elsewhere, and lower among those in some CMAs (e.g. Toronto, Hamilton and Vancouver) than others. Overall, it is households in rental markets in large urban centres that are least satisfied with their housing.
The magnitude of the differences in housing satisfaction at the intersection of tenure and dwelling type is both considerable and consistent. In CMAs, where multi-unit dwellings are most prevalent, satisfaction rates differ by 25 percentage points between households in owned, detached houses and those in rented high-rise apartments – the two groups among whom housing satisfaction differs most.
Closer scrutiny is warranted given the magnitude of these differences. The extent to which the relationship between housing tenure, dwelling type and housing satisfaction vary between socio-economic groups is one issue requiring further (multivariate) analysis. For example, the results above indicate that home ownership and dwelling type are less strongly correlated with housing satisfaction among seniors and smaller households than they are among non-seniors and larger households. The match between housing characteristics and household needs and preferences, and how these change across stages of life, are important considerations.
How households respond to housing dissatisfaction is another consideration. The results above provide a snapshot at a single point in time. Some of the households reporting that they are not satisfied with their dwelling will likely move in the years ahead,Note and for some, this will involve a transition into home ownership. While this may be motivated by a range of ‘pull’ factors related to perceived psychic and economic benefits of home ownership, the results above suggest that ‘push’ factors related to dissatisfaction with rented housing may be important as well. For other households who are not satisfied with their dwelling, moving may not be an option given personal circumstances, financial constraints and housing markets in their area. For them, housing dissatisfaction, and the circumstances underlying it, may constitute an ongoing source of disadvantage.
Ultimately, the goal of this report was to provide high level descriptive information on the dwelling satisfaction of Canadians. In accomplishing this, the magnitude of the differences at the intersection of housing tenure and dwelling type became evident. The future inclusion of additional information on the CHS, such as household income and immigration status, will allow for further exploration of the factors underlying these differences in addition to opening additional avenues of research.
| Owner detached | Owner multi-unit | Renter-detached | Renter multi-unit | Total | |
|---|---|---|---|---|---|
| percent | |||||
| Canada | 48.1 | 20.2 | 3.8 | 27.9 | 100 |
| Newfoundland | 68.2 | 12.5 | 5.5 | 13.8 | 100 |
| Prince Edward Island | 67.9 | 4.4 | 5.3 | 22.4 | 100 |
| Nova Scotia | 61.8 | 7.1 | 5.3 | 25.8 | 100 |
| New Brunswick | 66.7 | 8.7 | 4.8 | 19.7 | 100 |
| Quebec | 42.5 | 19.8 | 2.1 | 35.7 | 100 |
| Ontario | 48.2 | 21.2 | 3.5 | 27.1 | 100 |
| Manitoba | 63.1 | 7.4 | 4.2 | 25.3 | 100 |
| Saskatchewan | 64.2 | 10.1 | 5.8 | 20 | 100 |
| Alberta | 55 | 18.6 | 5.3 | 21.2 | 100 |
| British Columbia | 36.8 | 31.4 | 5.3 | 26.6 | 100 |
| Yukon | 46.6 | 11.4 | 9.4 | 32.6 | 100 |
| Northwest Territories | 47.1 | 7.0 | 12.7 | 33.2 | 100 |
| Nunavut | 16.6 | 3.9 | 22.9 | 56.6 | 100 |
|
Note: Figures may not add to 100% due to rounding. Source: 2018 Canadian Housing Survey. |
|||||
| Overall satisfaction | Condition | Affordability | Overall space | Enough bedrooms | Safety & Security | Exterior Noise | Energy efficiency | Summer temp | Winter temp | |
|---|---|---|---|---|---|---|---|---|---|---|
| percent | ||||||||||
| CMA | ||||||||||
| Total | 81.1 | 75.3 | 66.4 | 80.1 | 84.0 | 86.7 | 69.0 | 60.9 | 69.1 | 74.4 |
| Owner detached | 89.9 | 82.1 | 72.7 | 87.7 | 90.3 | 90.4 | 80.5 | 64.8 | 78.3 | 79.5 |
| Owner multi-unit | 83.4 | 79.4 | 67.3 | 79.3 | 82.6 | 88.6 | 67.0 | 62.3 | 72.7 | 77.3 |
| Renter detached | 79.5 | 72.4 | 65.8 | 81.6 | 87.6 | 86.2 | 71.5 | 50.4 | 72.8 | 69.9 |
| Renter multi-unit | 68.2 | 63.3 | 58.3 | 71.1 | 76.5 | 80.3 | 55.6 | 55.1 | 53.6 | 65.9 |
| Owner multi-unit | ||||||||||
| Semi-detached | 85.2 | 76.6 | 67.9 | 82.6 | 87.2 | 88.3 | 70.0 | 59.4 | 73.4 | 76.0 |
| Row | 82.6 | 77.1 | 69.4 | 80.0 | 84.1 | 88.1 | 67.0 | 60.1 | 73.0 | 73.5 |
| Apartment, low rise | 84.4 | 83.7 | 70.9 | 78.5 | 81.7 | 87.7 | 65.1 | 64.3 | 69.4 | 78.4 |
| Apartment, high rise | 80.1 | 81.2 | 59.8 | 73.9 | 74.7 | 90.5 | 64.5 | 66.8 | 75.1 | 81.9 |
| Renter multi-unit | ||||||||||
| Semi-detached | 76.3 | 68.1 | 67.5 | 78.0 | 84.8 | 83.9 | 65.6 | 49.1 | 58.4 | 65.3 |
| Row | 73.2 | 67.3 | 63.3 | 72.0 | 80.3 | 79.1 | 62.8 | 54.2 | 56.7 | 64.8 |
| Apartment, low rise | 67.6 | 62.0 | 61.2 | 72.4 | 78.3 | 80.0 | 51.6 | 53.2 | 52.1 | 63.6 |
| Apartment, high rise | 65.2 | 62.8 | 49.7 | 66.8 | 70.3 | 79.9 | 56.8 | 60.1 | 53.7 | 69.8 |
| CA | ||||||||||
| Total | 85.0 | 79.0 | 75.2 | 83.7 | 88.8 | 88.8 | 75.7 | 64.5 | 72.4 | 76.3 |
| Owner detached | 89.7 | 81.9 | 77.7 | 87.7 | 90.9 | 91.9 | 81.4 | 67.0 | 78.7 | 80.0 |
| Owner multi-unit | 85.8 | 79.7 | 75.8 | 85.0 | 89.2 | 86.0 | 73.5 | 64.8 | 71.1 | 77.7 |
| Renter detached | 72.8 | 66.0 | 67.1 | 74.6 | 81.7 | 87.3 | 71.6 | 47.9 | 66.1 | 61.9 |
| Renter multi-unit | 77.1 | 74.9 | 70.9 | 77.2 | 85.9 | 83.2 | 64.3 | 61.6 | 60.4 | 69.8 |
| Other | ||||||||||
| Total | 87.4 | 79.9 | 80.9 | 86.1 | 89.4 | 92.1 | 80.7 | 66.2 | 77.7 | 78.3 |
| Owner detached | 89.1 | 80.4 | 81.5 | 87.1 | 90.1 | 92.7 | 83.5 | 66.2 | 79.4 | 78.9 |
| Owner multi-unit | 92.7 | 80.5 | 79.2 | 88.5 | 92.7 | 94.2 | 82.2 | 73.7 | 88.3 | 85.4 |
| Renter detached | 79.2 | 74.8 | 78.3 | 83.2 | 84.5 | 89.8 | 74.9 | 58.6 | 72.4 | 70.5 |
| Renter multi-unit | 80.6 | 79.0 | 78.0 | 83.9 | 88.3 | 88.6 | 64.8 | 67.0 | 67.7 | 75.1 |
References
Balestra, C., & Sultan, J. (2013). Home sweet home: The determinants of residential satisfaction and its relation with well-being.
Borgoni, R., Michelangeli, A., & Pirola, F. (2018). Residential Satisfaction for a Continuum of Households: Evidence from European Countries. University of Milan Bicocca Department of Economics, Management and Statistics Working Paper, (378).
Sørensen, J. F. (2014). Rural–urban differences in life satisfaction: Evidence from the European Union. Regional Studies, 48(9), 1451-1466.
Pekkonen, M., & Haverinen-Shaughnessy, U. (2015). Housing satisfaction in Finland with regard to area, dwelling type and tenure status. Central European journal of public health, 23(4), 314.
- Date modified: