
Income Research Paper Series
Accessing the Canada Learning Bond: Meeting Identification and Income Eligibility Requirements

Archived Content
Information identified as archived is provided for reference, research or recordkeeping purposes. It is not subject to the Government of Canada Web Standards and has not been altered or updated since it was archived. Please "contact us" to request a format other than those available.
by Adriene Harding, Christine Laporte, and Eric Olson
Skip to text
Text begins
As part of our mandate, guaranteeing the security of sensitive statistical information within Statistics Canada is one of our top priorities.
- Access to data for Statistics Canada employees requires justification and approval by senior management (Director and above). Employee access to data is also time bound and tracked.
- Information technology (IT) environment is secure:
- access by Statistics Canada employees is controlled by user ID and security groups;
- access by employees is limited to variables they need;
- direct identifiers are only available to the few employees working to anonymize the data or conducting record linkages; and
- direct identifiers are always kept in separate files.
- Based on confidentiality guidelines, only aggregate non-confidential data are released outside of Statistics Canada. Suppression or rounding rules are applied to the aggregate data to minimize risk of disclosure.
Statistics Canada’s Executive Management Committee reviewed this project’s proposal (#083-2017) to conduct a linkage. A summary of the approved microdata linkage is posted on Statistics Canada’s website, Statistics Canada’s website.
Abstract
Not having a Social Insurance Number (SIN) and not filing taxes may represent challenges to access government programs and supports such as the Canada Education Savings Grant (CESG) and the Canada Learning Bond (CLB). Limited data availability has prevented a full assessment of the extent of these access challenges. This study attempts to address this knowledge gap by analyzing overall differences in SIN possession and tax-filing uptake by family income, levels of parental education, family type and Indigenous identity of the child and age of children using the 2016 Census data augmented with tax-filing and Social Insurance Number possession indicator flags.
Introduction
Canadians are eligible for a variety of government benefits and support programs. While eligibility criteria need to be filled to access benefits, specific administrative conditions also need to be fulfilled. For many federal government benefits and supports programs, possession of a Social Insurance Number (SIN) and confirmation of income through tax-filing are prerequisites. The Canadian Education Savings Program (CESP) is a good example of such a governmental program.
Introduced in 1998, the Canadian Education Savings Program (CESP) was designed as an incentive to encourage education savings for the post-secondary education of a child. The program is centred on Registered Education Savings Plans (RESPs), where savings accumulate tax-free until withdrawn, to pay for full- or part-time post-secondary studies such as a trade school, CEGEP, college, or university, or in an apprenticeship program.
The CESG comprises two education savings incentives components: the Canadian Education Savings Grant (CESG) and the Canadian Learning Bond (CLB). The CESG is available to all Canadians. In essence, it provides a grant for annual contributions made for a child in an RESP. Higher CESG rates apply for savings made for children from low- and middle-income families.
The CLB was introduced in 2004 specifically for children from low-income families. CLB provides, without family contribution being required, eligible families with an initial RESP payment which may be followed by annual payments up until the child is aged 15 years old.
The objective of this paper is to assess the extent to which not tax-filing and not having a SIN for a child could pose a challenge to accessing the CLB and the CESG. This study will address the knowledge gap by analyzing overall differences in SIN and tax-filing uptake by family income, levels of parental education, family type and Indigenous identity of the child. The findings will help understand access issues related to the CLB but also to other programs with similar administrative conditions.
Data will be analysed in terms of the following questions:
- What proportion of children have parents not filing taxes and/or do not have SINs themselves?
- What are the patterns of tax-filing and SIN take-up by family income?
- With regard to the previous questions, are these differences associated with the demographic, employment and education characteristics of parents or children?
- What proportion of families with children do not file taxes and/or do not have SINs for their children?
- What are the patterns of tax-filing and SIN take-up by age of the child?
- What are the patterns of tax-filing and SIN take-up by provinces and territories?
This study is made possible using data associated with the 2016 Census. As part of the 2016 Census, administrative tax-filing data received from the Canada Revenue Agency (CRA) and data from the Social Insurance Register (SIR) were linked to the Census database. The paper then generates indicators based on the linkage to CRA files and linkage to the SIR, which can serve as proxies for respectively, tax filing and having been issued a SIN.
In this paper, the education saving program, including the accessibility criteria, will be briefly described. The methodology used to obtain the results will be explained. Results will be presented by child and family characteristics, as well as by province and territory of residence.
This work was done in partnership with Employment and Social Development Canada (ESDC). ESDC commissioned Statistics Canada to provide indicators to help assess the extent to which not filing taxes or not having a SIN for a child could pose a challenge in accessing the Canada Education Savings Grant (CESG) and the Canada Learning Bond (CLB). These findings may likewise be of interest to better understand potential access issues related to other programs with similar administrative requirements.
Canada Education Savings ProgramNote
The Canadian Education Savings Program (CESP) comprises two education savings incentives linked to Registered Education Savings Plans (RESP): the Canada Education Savings Grant (CESG) and the Canada Learning Bond (CLB). The CESG includes the Basic CESG, available to all Canadian and an additional amount of CESG (A-CESG) for beneficiaries from low- and middle-income families. The CLB is available to children from low-income families only.
Canadian Education Savings Grant (CESG)
The CESG is paid based on contributions made to Registered Education Savings Plans (RESP). For an RESP contribution made by a parent, family member or friend for a child’s post-secondary education, the Basic CESG allocates a 20% grant on the first $2,500 of annual personal contributions made to an RESP for all eligible children, regardless of family income. For A-CESG beneficiaries, higher CESG rates up to 30% to 40% are allocated on the first $500 of personal contributions made for eligible children from middle and low-income families. The CESG lifetime maximum is $7,200 per child.
In 2016, there were a total of 7,018,679 children eligible to receive the CESG, with 3,589,146 being actual recipients, resulting in a participation rate of roughly 51.1% (Employment and Social Development Canada, 2017).
Canadian Learning Bond (CLB)
Introduced in 2004, the CLB is available only to children from low-income families and children in care, born in 2004 or later. As with the CESG, the CLB is also paid into Registered Education Savings Plans (RESP) but personal contributions are not required to receive the CLB. It provides $500 into an RESP for the first year in low income and $100 in subsequent low-income years up to a $2,000 lifetime per child maximum for total CLB payments and is retroactive.
In 2016, $134 million in CLB payments were given to 546,141 recipients, with the total number of new recipients for the year being 126,979. In other words, 126,979 new beneficiaries received at least $500 and 419,162 existing beneficiaries received $100 through the CLB (Employment and Social Development Canada, 2017).
Program accessibility
To take advantage of the A-CESG or the CLB, the following four administrative conditions are required:
- the beneficiary must have a Social Insurance number (SIN);
- the beneficiary must have an opened an RESP with a financial provider;
- the primary caregiverNote must consent to income verification to confirm that the child’s family income is within the A-CESG and the CLB income eligibility threshold; and
- the primary caregiver and spouse or partner must file a T1 return annually to confirm family income is within the eligibility threshold for continued participation in the program.Note
Only conditions #1 and condition #2 are required for the Basic CESG, as the program is offered to all children regardless of family income.
With the information available in Census and administrative data, this paper will focus on measuring condition #1 and condition #4.
Data and methodology
This study targets children born on or after January 1, 2004, in order to coincide with the beginning of the CLB.Note It features families whose parental total income in the Census was below $50,000 to align as closely as possible with the CLB eligibility criteria.Note
Data for all persons in the 2016 Census of population was augmented with two indicators from administrative files received at Statistics Canada. The first indicator shows whether Statistics Canada was able to find a 2015 tax return for the individual and the second indicator shows whether an entry was found in the Social Insurance Register (SIR). The Census database used contained the long-form sample with detailed socio-demographic information on persons living in private dwellings throughout all provinces and territories.
The percentage of parents in the Census database who could be found in the CRA’s assessed tax-filing data for 2015 is used as a measure or proxy for the percentage who filed taxes. Similarly, the percentage of children in the Census database who could be found in the SIR is used as a measure or proxy for the percentage of children who possess a SIN.
For children born January 1, 2004 and after, 82.7% linked to a SIR record. Another 15.8% could only be found in the CRA’s list of dependents but not in the SIR. This is interpreted here to mean that they have not been issued a SIN. The remaining 1.6% could not be found in the SIR nor in the CRA’s list of dependents. For this latter group, it may be that they could not be linked solely due to incomplete or incorrect information in the Census, thus a portion of these children may indeed have a SIN number and/or be registered with the CRA. The allocation of this group is open to some debate. However, in this paper, they will be regrouped with those found only in the CRA’s list of dependents and interpreted to mean they have not received a SIN.
Children facing access challenges
In Canada, among the children born between January 1, 2004 and May 10, 2016 present in the Census, 17.4% did not appear to have a SIN, and 7.8% had at least one parent not found in the tax files.Note Overall 23.0% of children were facing either one or both challenges to access the CLB.
Table 1 presents some of the key variables about the characteristics of children and their families, when the child lacks a SIN (challenge 1), and at least one of the parents did not file taxes (challenge 2). Approximately a third of children with low parental income (with total parental income of less than $50,000) experience both or just one of the challenges. This proportion decreases to 19.3% as income of the parents goes over $50,000. The proportion of children who experience either or both challenges is highest (45.7%) in the lowest family income bracket, i.e. income less than $20,000, compared to the overall population (23.0%). There are also more children without a SIN (30.5%) in the lowest income bracket than the Canadian average (17.4%). Similarly, there are proportionally more children with a non-filing parent (23.4%) in the lowest income bracket than for Canadian children overall (7.8%).
Children in families with parents who don’t have post-secondary education are more likely to face each challenge: 29.9% of children whose parents don’t have a post-secondary education are without a SIN compared to 10.3% of children whose parents have post-secondary education. Similarly, 9.7% of children whose parents don’t have post-secondary education have at least one non-tax filing parent compared to 7.2% of children whose parent have post-secondary education. Previous research has indicated that children are more likely to pursue post-secondary education if their parents have post-secondary education (Frenette, 2017). The higher prevalence of challenges among children whose parents don’t have post-secondary education adds another disadvantage to children who may already be considered less likely to pursue post-secondary education.
| Total number of children | Facing either or both challenges | Child without a SIN (challenge 1) | At least one non-tax filing parent (challenge 2) | ||||
|---|---|---|---|---|---|---|---|
| number | percentage | number | percentage | number | percentage | ||
| Total - Canada | 4,766,890 | 1,097,105 | 23.0 | 830,945 | 17.4 | 370,245 | 7.8 |
| Total income of the parents | |||||||
| less than $50,000 | 1,190,455 | 405,215 | 34.0 | 322,065 | 27.1 | 129,225 | 10.9 |
| $0 to $19,999 | 267,175 | 122,005 | 45.7 | 81,515 | 30.5 | 62,470 | 23.4 |
| $20,000 to $29,999 | 262,320 | 89,840 | 34.2 | 76,000 | 29.0 | 22,325 | 8.5 |
| $30,000 to $39,999 | 322,840 | 99,430 | 30.8 | 85,470 | 26.5 | 21,815 | 6.8 |
| $40,000 to $49,999 | 338,125 | 93,940 | 27.8 | 79,085 | 23.4 | 22,615 | 6.7 |
| $50,000 or more | 3,576,435 | 691,890 | 19.3 | 508,880 | 14.2 | 241,020 | 6.7 |
| Highest education of the parent(s) | |||||||
| No post-secondary certificate, diploma or degree | 1,001,305 | 359,405 | 35.9 | 299,015 | 29.9 | 97,430 | 9.7 |
| With a post-secondary certificate, diploma or degree | 3,765,585 | 737,700 | 19.6 | 531,930 | 10.3 | 272,815 | 7.2 |
| Family type | |||||||
| Lone-parent family | 885,495 | 290,020 | 32.8 | 250,270 | 28.3 | 63,535 | 7.2 |
| Couple family | 3,881,400 | 807,080 | 20.8 | 580,675 | 15.0 | 306,710 | 7.9 |
| Aboriginal identity of the child | |||||||
| Aboriginal | 355,015 | 170,650 | 48.1 | 148,290 | 41.8 | 44,030 | 12.4 |
| First Nations | 223,710 | 120,255 | 53.8 | 105,265 | 47.1 | 31,870 | 14.2 |
| Métis | 105,450 | 36,675 | 34.8 | 30,610 | 29.0 | 9,290 | 8.8 |
| Inuk | 17,470 | 10,810 | 61.9 | 10,020 | 57.4 | 2,130 | 12.2 |
| Multiple Aboriginal responses | 4,735 | 1,695 | 35.8 | 1,415 | 29.9 | 400 | 8.4 |
| Aborignal responses not Included elsewhere | 3,655 | 1,215 | 33.2 | 975 | 26.7 | 340 | 9.3 |
| Not Aboriginal | 4,411,880 | 926,460 | 21.0 | 682,655 | 15.5 | 326,220 | 7.4 |
| Place of residence | |||||||
| Off reserve | 4,678,150 | 1,038,950 | 22.2 | 779,665 | 16.7 | 352,845 | 7.5 |
| On reserve | 88,745 | 58,150 | 65.5 | 51,280 | 57.8 | 17,395 | 19.6 |
|
Notes: Post-secondary education is defined as the highest certificate, diploma, or degree of each person. In the case of a couple, the status of the most educated parent is applied. Due to random rounding, totals may be different from the sum of all numbers. Sources: Statistics Canada, Census of Population, 2016 with tax-filing and Social Insurance Register indicator flags. |
|||||||
A higher proportion of children in single-parent families (32.8%) experience either or both challenges than children in couple families (20.8%). Of children in single parent families, 28.3% are without a SIN, as opposed to 15.0% in couple families and 7.2% have one parent not filing taxes as opposed to 7.9% in couple families.
A higher percentage of Indigenous children face the two challenges than non-Indigenous children, particularly the challenge of not having a SIN. Among Indigenous children, 41.8% appear to be without a SIN compared to 15.5% of non-Indigenous children. A part of the difference in SIN linkage rates may be due to patterns of children with SINs by province and territory, as discussed below. The three territories have higher percentages of children without SINs, which is reflective of the rates for Indigenous children in particular. Also, the percentage of Indigenous children with at least on parent who did not file taxes (12.4%) is higher than for non-Indigenous children (7.4%).
Children living on reserve are more likely to face challenges than those living off reserve. More than 65.5% of Indigenous children living on reserve were facing either one or both challenges compared to 22.2% of those living off reserve.
Families facing access challenges
Analysis of families is another useful way of describing those facing these challenges since policies often target families and their parents who are in a position to make decisions and prepare the financial conditions suitable for post-secondary education. Twenty-six percent of families with one or more children born after 2003 face either or both challenges that might prevent them from taking advantage of the CLB: 20.5% have at least one child without a SIN and 8.1% have at least one parent not filing taxes. According to specific characteristics listed in Table 1, patterns at the family level are similar to those observed in the child-level analysis. These results are shown in Table A.1 of the Appendix. Yet, the challenges faced by each family can differ depending on its type, its size or its identity.
The experience of Indigenous families by First Nations, Métis and Inuk and by family type, whether lone parent or couple family are represented in Table 2. Indigenous lone-parent families are more likely to experience either or both challenges compared to Indigenous couple families.
| Total number of families | Facing either or both challenges | At least one child without a SIN (challenge 1) | At least one non-tax filing parent (challenge 2) | ||||
|---|---|---|---|---|---|---|---|
| number | percentage | number | percentage | number | percentage | ||
| Lone-parent families | 603,180 | 213,985 | 35.5 | 186,365 | 30.9 | 46170 | 7.7 |
| Aboriginal identity | 83,995 | 48,640 | 57.9 | 44,560 | 53.1 | 9,490 | 11.3 |
| First Nations | 58,215 | 36,000 | 61.8 | 33,060 | 56.8 | 7,290 | 12.5 |
| Métis | 21,335 | 9,890 | 46.4 | 8,910 | 41.8 | 1,665 | 7.8 |
| Inuk | 3,305 | 2,265 | 68.5 | 2,160 | 65.4 | 450 | 13.6 |
| Multiple Aboriginal responses | 675 | 290 | 43.0 | 255 | 37.8 | 55 | 8.1 |
| Aborignal Responses not included elsewhere | 480 | 195 | 40.6 | 180 | 37.5 | 30 | 6.3 |
| Non-Aboriginal | 519,185 | 165,345 | 31.8 | 141,805 | 27.3 | 36,680 | 7.1 |
| Couple families | 2,284,335 | 538,040 | 23.6 | 406,840 | 17.8 | 187,775 | 8.2 |
| Aboriginal identity | 118,460 | 57,180 | 48.3 | 49,160 | 41.5 | 16,890 | 14.3 |
| First Nations | 67,415 | 37,255 | 55.3 | 32,310 | 47.9 | 11,575 | 17.2 |
| Métis | 42,410 | 14,615 | 34.5 | 11,945 | 28.2 | 4,280 | 10.1 |
| Inuk | 6,230 | 4,385 | 70.4 | 4,130 | 66.3 | 805 | 12.9 |
| Multiple Aboriginal responses | 1,445 | 545 | 37.7 | 455 | 31.5 | 140 | 9.7 |
| Aborignal Responses not included elsewhere | 955 | 380 | 39.8 | 325 | 34.0 | 90 | 9.4 |
| Non-Aboriginal | 2,165,875 | 480,860 | 22.2 | 357,680 | 16.5 | 170,885 | 7.9 |
|
Notes: The Aboriginal identity of the family is determined by looking at the identity of each individual family member and using the one that occurs most often as the identity of the family. If 50% of the family members are Aboriginal and 50% are not, then the family is considered Aboriginal. Due to random rounding, totals may be different from the sum of all numbers. Sources: Statistics Canada, Census of Population, 2016 with tax-filing and Social Insurance Register indicator flags. |
|||||||
By detailed Aboriginal identity, Table 2 shows that the prevalence of facing either or both challenges is larger for Inuk lone-parent families than for any other Indigenous lone-parent families. In fact, 68.5% of Inuk lone-parent families face either or both challenges compared to 61.8% of First Nations lone-parent families and 46.4% of Métis lone-parent families. Inuk lone-parent families are also more likely to face challenge 1 and challenge 2 compared to other Indigenous groups. While 13.6% of Inuk lone-parent families have the parent not filing taxes (challenge 2), 65.4% have at least one child without a SIN (challenge 1). As a comparison, 41.8% of Métis lone-parent families are facing challenge 1 and 7.8% are facing challenge 2.
Similar patterns are observed for Indigenous couple families. Inuk couple families are more likely than any other Indigenous group families to face either or both challenges. They are also more likely to face challenge 1. However, First Nations couple families are more likely to have at least one non-tax filing parent than Inuk families.
Table 3 presents challenges faced by family size for all Canadian families. The proportion of families facing either or both challenges increases with the number of children within the family. While 23.8% of families with one child face either or both challenges, this proportion increases to 65.4% for families with five children or more. This is largely due to the prevalence of challenge 1 amongst large families. In fact, families with five children or more are more likely than any other size of family to have at least one child without a SIN (challenge 1). However, families of all sizes face challenge 2 in similar proportion: 9.1% of families with one child have at least one non-tax-filing parent compared to 7 to 8 percent of families of two to four children and 10.4% of families with five children or more.
| Total number of families | Facing either or both challenges | At least one child without a SIN (challenge 1) | At least one non-tax filing parent (challenge 2) | ||||
|---|---|---|---|---|---|---|---|
| number | percentage | number | percentage | number | percentage | ||
| Total - Canada | 2,887,520 | 752,025 | 26.0 | 593,210 | 20.5 | 233,940 | 8.1 |
| Number of children | |||||||
| One child | 1,450,565 | 345,245 | 23.8 | 251,870 | 17.4 | 131,600 | 9.1 |
| Two children | 1,088,570 | 273,670 | 25.1 | 221,880 | 20.4 | 76,800 | 7.1 |
| Three children | 276,035 | 95,995 | 34.8 | 84,840 | 30.7 | 19,525 | 7.1 |
| Four children | 56,580 | 26,795 | 47.4 | 24,840 | 43.9 | 4,360 | 7.7 |
| Five children or more | 15,765 | 10,315 | 65.4 | 9,770 | 62.0 | 1,645 | 10.4 |
|
Note: Due to random rounding, totals may different from the sum of all numbers. Sources: Statistics Canada, Census of Population, 2016 with tax-filing and Social Insurance Register indicator flags. |
|||||||
The number of children in large families can explain the higher probability of having at least one child without a SIN and not necessarily the higher probability of having at least one non-tax filing parent. The age of the children may also be an explanatory factor. Large families includes children of various ages, including older children. The next section will demonstrate how some programs increased the likelihood of having a SIN of children born in recent years.
Challenges by birth year and region of residence
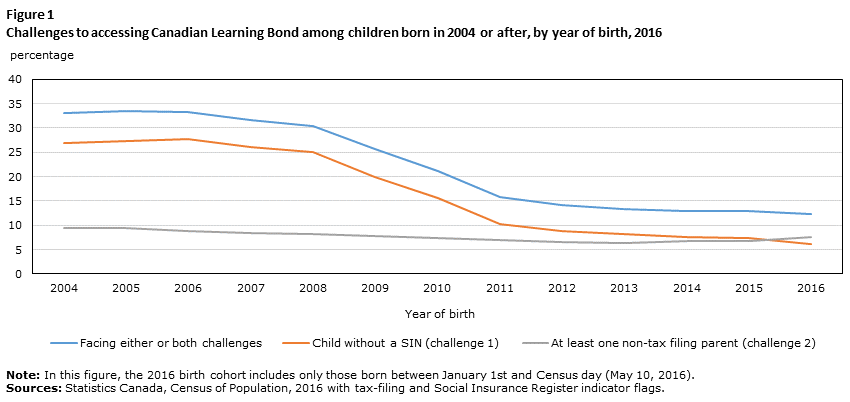
The challenges in accessing the CLB faced by children are correlated with their age, infants and toddlers facing less challenges compared to older age groups. Figure 1 illustrates the share of children at different ages who face one or more barriers for CLB take-up in Canada in 2016.Note It shows that the share of children facing either or both challenges is higher among children born in 2004 compared to children born in more recent years. This result is mostly due to the high proportion of older children without a SIN while the proportion of children with at least one parent not filing taxes remains relatively stable.
The decreasing proportion of children without a SIN seems be linked to policy efforts in providing easier access to SINs for children born in recent years across the Canadian provinces. While, in 2016, 26.9% of children born in 2004 did not have a SIN, this proportion was 7.5% for those born in 2015. The introduction of integrated systems such as birth-bundling measures allowed parents to register the birth of a child, request a SIN number and apply for child benefits at the same time. This increased the ease of applying for a child’s SIN in all of the provinces. If this hypothesis is true, it can be expected that the number of children without a SINs will decrease further over time.
Description for Figure 1
| Year of birth | Facing either, or both challenges | Child without a SIN (challenge 1) | At least one non-tax filing parent (challenge 2) |
|---|---|---|---|
| percentage | |||
| 2004 | 33.0 | 26.9 | 9.5 |
| 2005 | 33.4 | 27.4 | 9.5 |
| 2006 | 33.3 | 27.7 | 8.8 |
| 2007 | 31.6 | 26.1 | 8.5 |
| 2008 | 30.5 | 25.0 | 8.2 |
| 2009 | 25.8 | 19.9 | 7.8 |
| 2010 | 21.2 | 15.5 | 7.4 |
| 2011 | 15.7 | 10.2 | 7.0 |
| 2012 | 14.2 | 8.9 | 6.6 |
| 2013 | 13.4 | 8.3 | 6.5 |
| 2014 | 12.9 | 7.7 | 6.7 |
| 2015 | 12.9 | 7.5 | 6.7 |
| 2016 | 12.3 | 6.2 | 7.5 |
|
Note: In this figure, the 2016 birth cohort includes only those born between January 1st and Census day (May 10, 2016). Sources: Statistics Canada, Census of Population, 2016 with tax-filing and Social Insurance Register indicator flags. |
|||

Description for Figure 2
| Year of birth | |||||||||||||
|---|---|---|---|---|---|---|---|---|---|---|---|---|---|
| 2004 | 2005 | 2006 | 2007 | 2008 | 2009 | 2010 | 2011 | 2012 | 2013 | 2014 | 2015 | 2016 | |
| percentage | |||||||||||||
| Newfoundland and Labrador | 35.3 | 36.3 | 34.8 | 37.6 | 37.5 | 38.1 | 38.2 | 40.1 | 44.7 | 7.1 | 5.8 | 4.9 | 5.3 |
| Prince Edward Island | 27.6 | 32.2 | 28.0 | 33.4 | 35.6 | 36.4 | 34.5 | 42.3 | 18.1 | 1.5 | 2.5 | 2.2 | 0.0 |
| Nova Scotia | 36.1 | 39.9 | 39.6 | 40.7 | 42.7 | 19.5 | 7.9 | 5.8 | 5.9 | 6.2 | 8.0 | 7.3 | 8.7 |
| New Brunswick | 29.5 | 30.9 | 33.0 | 32.9 | 35.7 | 35.9 | 42.3 | 44.6 | 46.6 | 46.7 | 5.8 | 6.7 | 7.5 |
| Quebec | 29.3 | 30.2 | 31.0 | 31.8 | 33.5 | 33.8 | 19.3 | 3.1 | 2.8 | 2.6 | 2.5 | 2.3 | 3.0 |
| Ontario | 23.0 | 24.1 | 23.0 | 20.5 | 17.3 | 11.5 | 9.6 | 7.5 | 6.7 | 6.5 | 6.4 | 5.6 | 6.6 |
| Manitoba | 36.9 | 39.0 | 40.5 | 43.3 | 42.6 | 43.3 | 44.5 | 31.4 | 14.0 | 13.0 | 12.6 | 11.9 | 14.3 |
| Saskatchewan | 39.8 | 39.0 | 40.0 | 41.9 | 43.9 | 42.8 | 44.7 | 46.3 | 47.1 | 49.7 | 52.5 | 58.9 | 8.3 |
|
Note: In this figure, the 2016 birth cohort includes only those born between January 1st and Census day (May 10, 2016). Sources: Statistics Canada, Census of Population, 2016 with tax-filing and Social Insurance Register indicator flags. |
|||||||||||||
Description for Figure 3
| Year of birth | |||||||||||||
|---|---|---|---|---|---|---|---|---|---|---|---|---|---|
| 2004 | 2005 | 2006 | 2007 | 2008 | 2009 | 2010 | 2011 | 2012 | 2013 | 2014 | 2015 | 2016 | |
| percentage | |||||||||||||
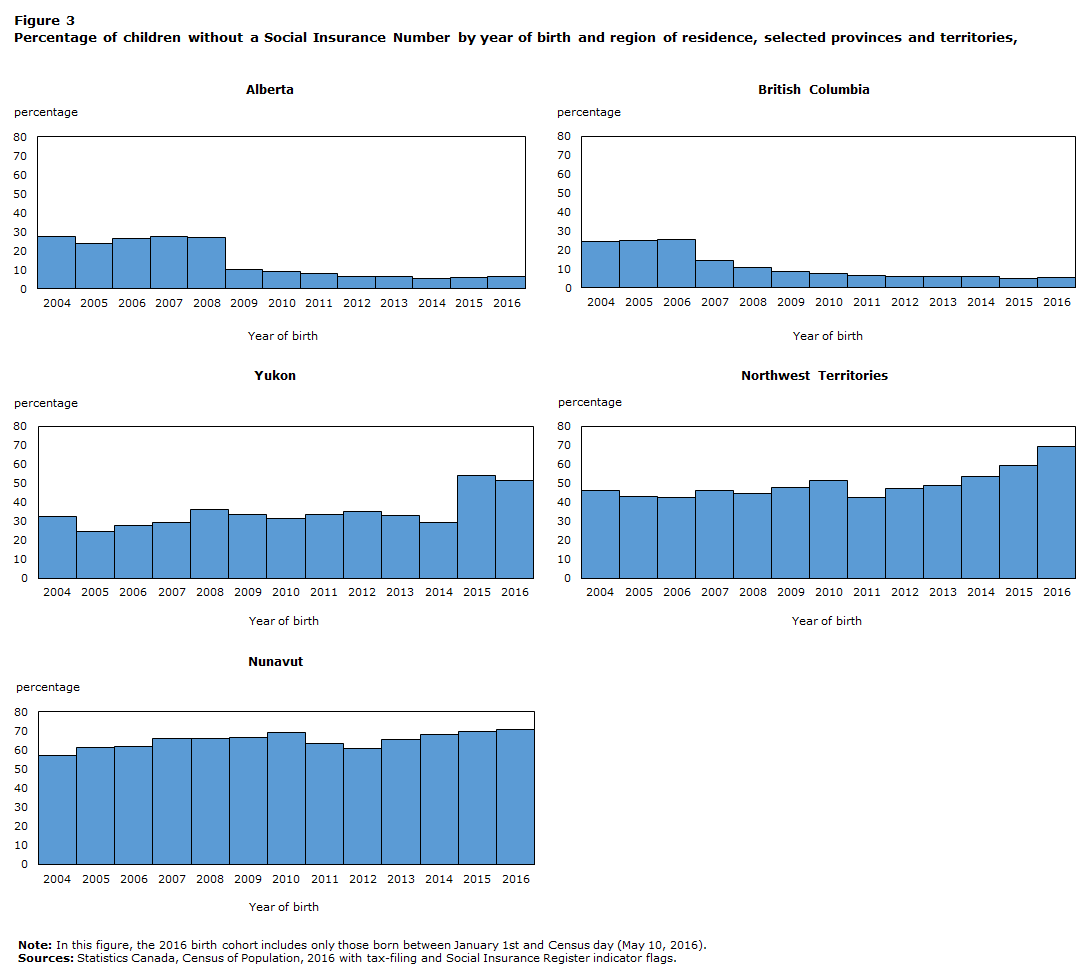
| Alberta | 27.3 | 23.8 | 26.5 | 27.7 | 26.8 | 10.1 | 9.1 | 8.2 | 6.3 | 6.3 | 5.7 | 6.0 | 6.4 |
| British Columbia | 24.3 | 24.7 | 25.6 | 14.2 | 10.5 | 8.7 | 7.4 | 6.7 | 6.0 | 5.7 | 6.0 | 5.0 | 5.6 |
| Yukon | 32.5 | 24.3 | 27.8 | 29.1 | 36.1 | 33.3 | 31.3 | 33.7 | 35.2 | 32.9 | 29.1 | 54.2 | 51.4 |
| Northwest Territories | 46.4 | 43.2 | 42.6 | 46.3 | 44.8 | 47.7 | 51.3 | 42.5 | 47.4 | 48.9 | 53.7 | 59.2 | 69.4 |
| Nunavut | 57.0 | 61.0 | 61.9 | 66.0 | 66.0 | 66.5 | 69.3 | 63.2 | 60.7 | 65.7 | 68.0 | 69.4 | 70.8 |
|
Note: In this figure, the 2016 birth cohort includes only those born between January 1st and Census day (May 10, 2016). Sources: Statistics Canada, Census of Population, 2016 with tax-filing and Social Insurance Register indicator flags. |
|||||||||||||
These birth-bundling measures were introduced at different moments in each of the provinces which explains the marked changes observed in Figure 1. Decreases in the percentage of children without a SIN born in recent years coincided with the introduction of birth-bundling measures in large provinces such as British Columbia in 2006, Alberta and Ontario in 2008 and Quebec in 2010.
These changes by provinces and territories can be observed in more detail in Figures 2 and 3 and Table A.2 which present detailed results by province and by territory of residence, for children without a SIN by year of birth.
While the percentages by age for Ontario decrease in a more gradual way according to the children’s year of birth, percentages of children without a SIN drop off rapidly for other provinces such as New Brunswick, for example, corresponding to the year birth-bundling measures were introduced.
Saskatchewan was the last province to introduce bundled registration services in January 2016. As a result, the percentage of children who appear to be without a SIN is considerably lower among those under the age of one.
The percentage of children without SINs remained high in the territories even for children born in more recent years. Bundled newborn registration services were not yet offered by the time of the Census.
Conclusion
Not having a SIN and not filing taxes represent two possible challenges to access government benefit and support programs such as the Canadian Education Savings Program (CESP). Limited data availability has reduced the possibility to fully assess the extent of these access challenges in the past. This study partly addressed this knowledge gap by analyzing overall differences in Social Insurance Number (SIN) possession for children and parental tax-filing uptake by family income, levels of education of parents, family type and Indigenous identity using the 2016 Census data augmented with proxy indicators.
The majority of the eligible population of the Canada Learning Bond (CLB) did not experience access challenges in 2016. However, 23.0% of children born after 2003 in Canada either had a parent who did not file taxes or did not possess a Social Insurance Number or both which may represent access challenges. The prevalence of these access challenges seemed higher among children from families with total parental income less than $50,000. Children with parental education less than post-secondary, children from a lone-parent family, Indigenous children from all Aboriginal identities and children living on reserve were also more likely to be without a SIN or to have at least one non-tax filing parent. At the family level, the challenges faced by families also differed depending on their type, their size or their identity.
While the challenges faced by children and families in accessing the CLB are correlated with sociodemographic factors, they are also clearly correlated with the age of the children. The share of children facing either or both challenges in 2016 was highest among older children, mostly due to the high proportion of older children without a SIN while the proportion of children with at least one parent not filing taxes remained relatively stable across the age distribution. The introduction of integrated systems such as birth-bundling measures coincides with a decrease in the percentage of children without a SIN. The percentage of children without SINs decreased considerably in all provinces but remained high in the territories even for children born in recent years as bundled newborn registration services were not yet offered by the time of the Census.
It can be expected that the number of children without SINs will decrease further over time. As that challenge all but disappears in more recent cohorts, parental tax-filing uptake as well as other factors such as awareness of the program and opening an RESP account will constitute the key aspects to assess. Along these lines, in further research, multivariate tools may also be required to assess how determining socio-demographic factors including low parental income, lone-parent family and living in remote communities, a territory or a reserve interact.
References
Frenette, M. 2017. “Which Families Invest in Registered Education Savings Plans and Does it Matter for Postsecondary Enrolment”, Statistics Canada, Ottawa: Statistics Canada.
Employment and Social Development Canada. 2018. Canada Education Savings Plan – 2017 Annual Statistical Review. Government of Canada. 40 pages.
Employment and Social Development Canada. 2017. Canada Education Savings Plan – 2016 Annual Statistical Review. Government of Canada. 36 pages.
Appendix
| Total number of families | Facing either or both challenges | At least one child without a SIN (challenge 1) | At least one non-tax filing parent (challenge 2) | ||||
|---|---|---|---|---|---|---|---|
| number | percentage | number | percentage | number | percentage | ||
| Total - Canada | 2,887,520 | 752,025 | 26.0 | 593,210 | 20.5 | 233,940 | 8.1 |
| Total income of the parent(s) | |||||||
| less than $50,000 | 762,600 | 280,035 | 36.7 | 229,840 | 30.1 | 82,905 | 10.9 |
| $0 to $19,999 | 187,595 | 85,830 | 45.8 | 61,195 | 32.6 | 40,530 | 21.6 |
| $20,000 to $29,999 | 171,465 | 63,055 | 36.8 | 54,745 | 31.9 | 14,095 | 8.2 |
| $30,000 to $39,999 | 198,510 | 67,485 | 34.0 | 59,210 | 29.8 | 13,735 | 6.9 |
| $40,000 to $49,999 | 205,030 | 63,665 | 31.1 | 54,685 | 26.7 | 14,545 | 7.1 |
| $50,000 or more | 2,124,915 | 471,995 | 22.2 | 363,370 | 17.1 | 151,035 | 7.1 |
| Family type | |||||||
| Lone-parent family | 603,180 | 213,990 | 35.5 | 186,365 | 30.9 | 46,165 | 7.7 |
| Couple family | 2,284,335 | 538,035 | 23.6 | 406,845 | 17.8 | 187,775 | 8.2 |
| Aboriginal identity of family | |||||||
| Aboriginal | 202,455 | 105,820 | 52.3 | 93,720 | 46.3 | 26,380 | 13.0 |
| First Nations | 125,625 | 73,255 | 58.3 | 65,365 | 52.0 | 18,865 | 15.0 |
| Métis | 63,745 | 24,505 | 38.4 | 20,860 | 32.7 | 5,945 | 9.3 |
| Inuk | 9,535 | 6,650 | 69.7 | 6,280 | 65.9 | 1,250 | 13.1 |
| Multiple Aboriginal responses | 2,120 | 835 | 39.4 | 715 | 33.7 | 195 | 9.2 |
| Aborignal responses not included elsewhere | 1,430 | 575 | 40.2 | 495 | 34.6 | 125 | 8.7 |
| Non-Aboriginal | 2,685,060 | 646,205 | 24.1 | 499,485 | 18.6 | 207,565 | 7.7 |
| Place of residence | |||||||
| Off reserve | 2,842,285 | 719,120 | 25.3 | 563,390 | 19.8 | 224,505 | 7.9 |
| On reserve | 45,230 | 32,905 | 72.8 | 29,820 | 65.9 | 9,435 | 20.9 |
|
Notes: The Aboriginal identity of the family is determined by looking at the identity of each individual family member and using the one that occurs most often as the identity of the family. If 50% of the family members are Aboriginal and 50% are not, then the family is considered Aboriginal. Due to random rounding, totals may be different from the sum of all numbers. Sources: Statistics Canada, Census of Population, 2016 with tax-filing and Social Insurance Register indicator flags. |
|||||||
| Year of birth | |||||||||||||
|---|---|---|---|---|---|---|---|---|---|---|---|---|---|
| 2004 | 2005 | 2006 | 2007 | 2008 | 2009 | 2010 | 2011 | 2012 | 2013 | 2014 | 2015 | 2016 | |
| percentage | |||||||||||||
| Canada | 26.9 | 27.4 | 27.7 | 26.1 | 25.0 | 19.9 | 15.5 | 10.2 | 8.9 | 8.3 | 7.7 | 7.5 | 6.2 |
| Newfoundland | 35.3 | 36.3 | 34.8 | 37.6 | 37.5 | 38.1 | 38.2 | 40.1 | 44.7 | 7.1 | 5.8 | 4.9 | 5.3 |
| Prince Edward Island | 27.6 | 32.2 | 28.0 | 33.4 | 35.6 | 36.4 | 34.5 | 42.3 | 18.1 | 1.5 | 2.5 | 2.2 | Note x: suppressed to meet the confidentiality requirements of the Statistics Act |
| Nova Scotia | 36.1 | 39.9 | 39.6 | 40.7 | 42.7 | 19.5 | 7.9 | 5.8 | 5.9 | 6.2 | 8.0 | 7.3 | 8.7 |
| New Brunswick | 29.5 | 30.9 | 33.0 | 32.9 | 35.7 | 35.9 | 42.3 | 44.6 | 46.6 | 46.7 | 5.8 | 6.7 | 7.5 |
| Quebec | 29.3 | 30.2 | 31.0 | 31.8 | 33.5 | 33.8 | 19.3 | 3.1 | 2.8 | 2.6 | 2.5 | 2.3 | 3.0 |
| Ontario | 23.0 | 24.1 | 23.0 | 20.5 | 17.3 | 11.5 | 9.6 | 7.5 | 6.7 | 6.5 | 6.4 | 5.6 | 6.6 |
| Manitoba | 36.9 | 39.0 | 40.5 | 43.3 | 42.6 | 43.3 | 44.5 | 31.4 | 14.0 | 13.0 | 12.6 | 11.9 | 14.3 |
| Saskatchewan | 39.8 | 39.0 | 40.0 | 41.9 | 43.9 | 42.8 | 44.7 | 46.3 | 47.1 | 49.7 | 52.5 | 58.9 | 8.3 |
| Alberta | 27.3 | 23.8 | 26.5 | 27.7 | 26.8 | 10.1 | 9.1 | 8.2 | 6.3 | 6.3 | 5.7 | 6.0 | 6.4 |
| British Columbia | 24.3 | 24.7 | 25.6 | 14.2 | 10.5 | 8.7 | 7.4 | 6.7 | 6.0 | 5.7 | 6.0 | 5.0 | 5.6 |
| Yukon | 32.5 | 24.3 | 27.8 | 29.1 | 36.1 | 33.3 | 31.3 | 33.7 | 35.2 | 32.9 | 29.1 | 54.2 | 51.4 |
| Northwest Territories | 46.4 | 43.2 | 42.6 | 46.3 | 44.8 | 47.7 | 51.3 | 42.5 | 47.4 | 48.9 | 53.7 | 59.2 | 69.4 |
| Nunavut | 57.0 | 61.0 | 61.9 | 66.0 | 66.0 | 66.5 | 69.3 | 63.2 | 60.7 | 65.7 | 68.0 | 69.4 | 70.8 |
|
x suppressed to meet the confidentiality requirements of the Statistics Act Note: In this table, the 2016 birth cohort includes only those born between January 1st and Census day (May 10, 2016). Sources: Statistics Canada, Census of Population, 2016 with tax-filing and Social Insurance Register indicator flags. |
|||||||||||||
- Date modified: