
Labour Statistics: Research Papers
Occupations of South Asian, Chinese and Black women: Prevalence and age composition

Archived Content
Information identified as archived is provided for reference, research or recordkeeping purposes. It is not subject to the Government of Canada Web Standards and has not been altered or updated since it was archived. Please "contact us" to request a format other than those available.
Skip to text
Text begins
Acknowledgements
This study is funded by Women and Gender Equality Canada (WAGE).
Highlights
Among the employed population, women are generally younger than men. Furthermore, there are notable differences for particular occupations, which is even more pronounced for certain groups of women. This study uses data primarily from the 2016 Census of Population to examine the prevalence and age composition of three groups of women—South Asian, Chinese and Black—across occupations of various skill levels.
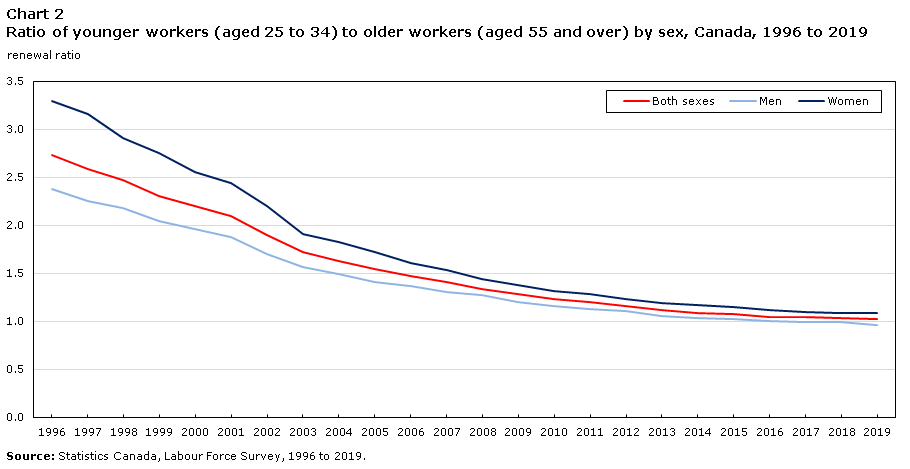
- In 2019, there were about the same number of younger workers aged 25 to 34 as aged 55 and over, for both women and men. More than twenty years earlier, in 1996, this younger-to-older worker ratio was 3.30 for women and 2.38 for men.
- Among employed women, smaller shares of South Asian (12%), Black (14%), and Chinese (16%) women were aged 55 and over in 2016—reflecting their younger populations—than the rest of the female population (21%).
- Although Black women (66.1%) had the highest participation rate in 2016 compared with South Asian (59.6%) and Chinese (55.9%) women as well as the rest of the female population (61.2%), they were underrepresented in many occupations usually requiring a university degree, also known as professional occupations.
- Chinese and South Asian women were overrepresented in a number of professional occupations in 2016. For example, among women in the occupational group of computer and information systems professionals in 2016, 15% were Chinese and 11% were South Asian, more than double the shares of these women in professional occupations overall (6% and 5%, respectively).
- In 2016, Chinese and South Asian women were more likely to hold occupations that usually required a university degree if they were Canadian-born (35% and 30%, respectively) compared with those who were immigrants (25% and 19%, respectively). There was little difference in the shares of Canadian-born and immigrant Black women holding these occupations.
- Higher ratios of younger workers aged 25 to 34 to older workers aged 55 and over were observed for Chinese, South Asian, and Black women in professional occupations in 2016 than for the rest of the female population. Among female physicians, dentists and veterinarians, for example, the younger-to-older worker ratio was higher for Chinese (3.94), South Asian (2.26) and Black (2.11) women than for other women (1.54).
Introduction
Women’s labour force participation in Canada has grown substantially since the 1960s, while that of men has slightly declined in recent years. Despite the growing convergence in labour force participation, there remain many differences in the labour market characteristics of women and men, with women more likely than men to hold multiple jobs,Note to work part-time,Note and to experience more frequent—and longer—work interruptions.Note In addition, women tend to be concentrated in fewer occupations than men,Note and while there is evidence of increased participation of women in science, technology, engineering and mathematic (STEM) and other non-traditional occupations, women are still overrepresented in traditionally-female occupations such as teaching and nursing.Note
Women also differ from men in their age profiles within occupations, with women generally younger than their male counterparts across many occupations.Note Consequently, in the context of a population that is growing older as a result of increased life expectancy, below replacement fertility and the movement of the large baby-boom cohort through the age structure, women could play an important role in mitigating the impact of population aging on the labour force.
These patterns of occupational renewal may depend on other characteristics of the population, including their intersection with sex. The younger age profiles of certain populations may have the potential to rejuvenate many occupations.Note This study will focus on three of these groups—South Asian, Chinese and Black—which collectively accounted for 4.7 million people in Canada in 2016.Note
In the first part of this study, the Labour Force Survey (LFS) will be used to provide an overview of the age-related trends of employed women and men since 1996. Data from the 2016 Census of Population will then be used to examine the prevalence and age composition of occupations—those requiring a university degree, those without such a requirement, and management occupations—for all women and men, and specifically for those who are South Asian, Chinese and Black.
Indicators used in this study to examine the age composition of occupations include the renewal ratio of younger workers aged 25 to 34 to older workers aged 55 and over, as well as the proportion of workers aged 55 and over (see Data sources, definitions and methods).
Converging number of younger and older employed women
The aging of the labour force in Canada is reflected by the increasing number of workers aged 55 and over during the past several decades, relative to the growth of younger workers aged 25 to 34 (Chart 1). According to the LFS, by 2019, the number of older women had nearly converged with that of younger women, while this has already occurred for men.

Data table for Chart 1
| Year | Women: aged 25 to 34 | Men: aged 25 to 34 | Women: aged 55 and over | Men: aged 55 and over |
|---|---|---|---|---|
| millions | ||||
| 1996 | 1.605 | 1.890 | 0.487 | 0.795 |
| 1997 | 1.602 | 1.868 | 0.507 | 0.831 |
| 1998 | 1.587 | 1.863 | 0.545 | 0.854 |
| 1999 | 1.574 | 1.820 | 0.573 | 0.893 |
| 2000 | 1.566 | 1.818 | 0.613 | 0.927 |
| 2001 | 1.562 | 1.801 | 0.640 | 0.958 |
| 2002 | 1.566 | 1.786 | 0.713 | 1.048 |
| 2003 | 1.575 | 1.805 | 0.823 | 1.146 |
| 2004 | 1.602 | 1.802 | 0.876 | 1.213 |
| 2005 | 1.603 | 1.812 | 0.933 | 1.289 |
| 2006 | 1.620 | 1.820 | 1.008 | 1.327 |
| 2007 | 1.672 | 1.841 | 1.092 | 1.408 |
| 2008 | 1.684 | 1.873 | 1.173 | 1.473 |
| 2009 | 1.704 | 1.825 | 1.236 | 1.519 |
| 2010 | 1.726 | 1.870 | 1.307 | 1.617 |
| 2011 | 1.746 | 1.908 | 1.367 | 1.686 |
| 2012 | 1.783 | 1.949 | 1.447 | 1.763 |
| 2013 | 1.815 | 1.963 | 1.524 | 1.845 |
| 2014 | 1.839 | 1.981 | 1.572 | 1.919 |
| 2015 | 1.846 | 2.031 | 1.610 | 1.993 |
| 2016 | 1.904 | 2.043 | 1.700 | 2.049 |
| 2017 | 1.948 | 2.097 | 1.766 | 2.123 |
| 2018 | 1.987 | 2.152 | 1.830 | 2.181 |
| 2019 | 2.030 | 2.194 | 1.865 | 2.292 |
| Source: Statistics Canada, Labour Force Survey, 1996 to 2019. | ||||
The ratio of younger workers aged 25 to 34—who would have largely completed their education and can be expected to be part of the labour force for several subsequent decades—to older workers aged 55 and over—who are nearer to exiting the labour force—can provide an indication of renewal of the labour force. In 1996, the renewal ratio for employed women was 3.30, meaning that there were more than three women aged 25 to 34 for every woman aged 55 and over in the labour force (Chart 2). At the same time, the ratio for men was 2.38. In the subsequent period to the early 2000s, the ratio dropped fairly sharply for women, at least partially as the large cohorts of women who had entered the labour market in the preceding decades grew older. By 2019, the ratio was about one for both women and men, in other words, there was a similar number of recent labour market entrants as those closer to exiting.
Data table for Chart 2
| Year | Both sexes | Men | Women |
|---|---|---|---|
| renewal ratio | |||
| 1996 | 2.73 | 2.38 | 3.30 |
| 1997 | 2.59 | 2.25 | 3.16 |
| 1998 | 2.47 | 2.18 | 2.91 |
| 1999 | 2.31 | 2.04 | 2.75 |
| 2000 | 2.20 | 1.96 | 2.56 |
| 2001 | 2.10 | 1.88 | 2.44 |
| 2002 | 1.90 | 1.70 | 2.20 |
| 2003 | 1.72 | 1.57 | 1.91 |
| 2004 | 1.63 | 1.49 | 1.83 |
| 2005 | 1.54 | 1.41 | 1.72 |
| 2006 | 1.47 | 1.37 | 1.61 |
| 2007 | 1.41 | 1.31 | 1.53 |
| 2008 | 1.34 | 1.27 | 1.44 |
| 2009 | 1.28 | 1.20 | 1.38 |
| 2010 | 1.23 | 1.16 | 1.32 |
| 2011 | 1.20 | 1.13 | 1.28 |
| 2012 | 1.16 | 1.11 | 1.23 |
| 2013 | 1.12 | 1.06 | 1.19 |
| 2014 | 1.09 | 1.03 | 1.17 |
| 2015 | 1.08 | 1.02 | 1.15 |
| 2016 | 1.05 | 1.00 | 1.12 |
| 2017 | 1.04 | 0.99 | 1.10 |
| 2018 | 1.03 | 0.99 | 1.09 |
| 2019 | 1.02 | 0.96 | 1.09 |
| Source: Statistics Canada, Labour Force Survey, 1996 to 2019. | |||
South Asian, Chinese and Black workers are younger, especially women
Among the employed population, women belonging to South Asian, Chinese and Black populations had higher renewal ratios than the rest of the female population. Specifically, this younger-to-older worker ratio for South Asian women was 2.26 in 2016, while it was also above replacement for Black (1.72), and Chinese (1.53) women (Table 1). The relative youth of these populations, helped to account for the larger number of workers who were closer to the beginning of their working lives (see South Asian, Black and Chinese populations are relatively young). In contrast, the renewal ratio for other employed women was just below replacement (0.96).
| Women | Men | |||
|---|---|---|---|---|
| Ratio of younger workers to older workers | Proportion of employed population aged 55 and over | Ratio of younger workers to older workers | Proportion of employed population aged 55 and over | |
| ratio | percent | ratio | percent | |
| Total population | 1.03 | 20.3 | 0.92 | 22.7 |
| South Asian | 2.26 | 12.0 | 1.61 | 16.2 |
| Chinese | 1.53 | 16.0 | 1.23 | 19.6 |
| Black | 1.72 | 14.0 | 1.64 | 14.5 |
| Rest of the population | 0.96 | 21.2 | 0.86 | 23.6 |
|
||||
The younger-to-older worker ratios were also above replacement for South Asian (1.61), Black (1.64) and Chinese (1.23) men, all of which were higher than the rest of the male population (0.86). For each of these groups, the ratios were lower for men than for women.
Consistent with their younger age profiles, South Asian, Chinese and Black populations had smaller shares of workers aged 55 and over. Among employed women, 16% of Chinese women were older workers in 2016, as were 14% of Black and 12% of South Asian women, all below the share for the rest of the female population (21%). One-fifth (20%) of employed Chinese men were aged 55 and over, higher than for South Asian (16%) or Black (14%) men, but lower than for other male workers (24%).Note
Renewal ratios higher for Canadian-born workers than for immigrants
Renewal ratios also differed depending on place of birth, hovering around replacement for Canadian-born workers, both women and men, while it was below one for those who were immigrants. This means that there were roughly equal numbers of younger and older workers born in Canada, but immigrant workers were older overall. There were differences, however, within these groups. Among employed South Asian, Chinese and Black women, the renewal ratios for Canadian-born women were well above replacement, and they were about one for immigrants. For example, for Canadian-born Chinese women, there were close to seven workers aged 25 to 34 (6.63) for each older worker, and for Canadian-born Black women, the renewal ratio was even higher (9.16), reflecting much younger employed populations compared with those born outside of Canada. Part of the explanation for these findings could be the large second-generation population—that is, Canadian-born children with at least one immigrant parent—within these groups.Note Also contributing to the large renewal ratios were smaller populations of workers aged 55 and over in these groups that were Canadian-born.Note Patterns were similar for men, although with lower ratios.
Most women and men in occupations not usually requiring a university degree
Occupations can be classified according to skill level as usually requiring a university degree, having no such requirement, and managers.Note Workers holding jobs with these different skill levels may vary in their age composition.
The majority of both female and male workers in 2016—about 7 in 10—were in occupations that did not usually require a university degree (Table 2). More than one-fifth of women and men (21% each) who held these types of occupations were aged 55 and over and the renewal ratio for both women and men was below replacement (Table 3).
| Women | Men | |||||||||
|---|---|---|---|---|---|---|---|---|---|---|
| Not usually requiring a university degree | Usually requiring a university degree | Management | Total | Total | Not usually requiring a university degree | Usually requiring a university degree | Management | Total | Total | |
| percent | number | percent | number | |||||||
| Total population | 69.8 | 21.3 | 8.9 | 100.0 | 8,306,000 | 70.1 | 16.2 | 13.7 | 100.0 | 8,924,000 |
| Immigrant | 71.2 | 20.6 | 8.3 | 100.0 | 1,952,000 | 66.4 | 20.6 | 12.9 | 100.0 | 2,155,000 |
| Canadian-born | 69.2 | 21.6 | 9.2 | 100.0 | 6,249,000 | 71.4 | 14.6 | 14.0 | 100.0 | 6,635,000 |
| South Asian | 71.8 | 20.9 | 7.3 | 100.0 | 395,000 | 66.6 | 21.5 | 11.9 | 100.0 | 526,000 |
| Immigrant | 73.8 | 18.9 | 7.4 | 100.0 | 305,000 | 66.9 | 20.9 | 12.3 | 100.0 | 412,000 |
| Canadian-born | 63.1 | 29.7 | 7.2 | 100.0 | 77,000 | 65.1 | 23.2 | 11.7 | 100.0 | 82,000 |
| Chinese | 63.3 | 27.3 | 9.4 | 100.0 | 365,000 | 56.4 | 29.6 | 14.0 | 100.0 | 365,000 |
| Immigrant | 64.7 | 25.4 | 9.8 | 100.0 | 275,000 | 56.5 | 28.6 | 14.9 | 100.0 | 272,000 |
| Canadian-born | 57.0 | 34.6 | 8.3 | 100.0 | 74,000 | 56.5 | 32.2 | 11.3 | 100.0 | 79,000 |
| Black | 76.5 | 18.7 | 4.8 | 100.0 | 268,000 | 78.7 | 15.1 | 6.2 | 100.0 | 264,000 |
| Immigrant | 76.7 | 19.0 | 4.3 | 100.0 | 177,000 | 77.6 | 16.2 | 6.2 | 100.0 | 177,000 |
| Canadian-born | 75.6 | 18.4 | 6.0 | 100.0 | 82,000 | 81.5 | 11.8 | 6.7 | 100.0 | 75,000 |
| Rest of the population | 69.7 | 21.2 | 9.1 | 100.0 | 7,278,000 | 70.7 | 15.3 | 14.0 | 100.0 | 7,769,000 |
| Immigrant | 71.2 | 20.1 | 8.7 | 100.0 | 1,194,000 | 66.9 | 19.5 | 13.6 | 100.0 | 1,294,000 |
| Canadian-born | 69.4 | 21.4 | 9.2 | 100.0 | 6,016,000 | 71.6 | 14.3 | 14.1 | 100.0 | 6,398,000 |
|
Notes: Totals may not add up to 100.0% due to rounding. Category for non-permanent residents not shown. Source: Statistics Canada, Census of Population, 2016. |
||||||||||
| Women | Men | |||||||||||
|---|---|---|---|---|---|---|---|---|---|---|---|---|
| Not usually requiring a university degree | Usually requiring a university degree | Management | Not usually requiring a university degree | Usually requiring a university degree | Management | |||||||
| Renewal ratio | Aged 55 and over | Renewal ratio | Aged 55 and over | Renewal ratio | Aged 55 and over | Renewal ratio | Aged 55 and over | Renewal ratio | Aged 55 and over | Renewal ratio | Aged 55 and over | |
| ratio | percent | ratio | percent | ratio | percent | ratio | percent | ratio | percent | ratio | percent | |
| Total population | 0.93 | 20.9 | 1.56 | 17.3 | 0.83 | 22.4 | 0.99 | 21.5 | 1.05 | 22.9 | 0.53 | 28.9 |
| South Asian | 1.86 | 13.0 | 4.35 | 8.7 | 2.11 | 12.5 | 1.45 | 16.7 | 2.49 | 13.3 | 1.28 | 18.2 |
| Chinese | 1.13 | 18.7 | 3.22 | 10.1 | 1.53 | 15.5 | 0.99 | 22.2 | 2.03 | 14.5 | 1.09 | 20.0 |
| Black | 1.64 | 14.3 | 2.02 | 13.5 | 2.08 | 11.9 | 1.68 | 14.2 | 1.52 | 15.5 | 1.39 | 15.3 |
| Rest of the population | 0.87 | 21.7 | 1.42 | 18.4 | 0.76 | 23.4 | 0.95 | 22.0 | 0.92 | 24.8 | 0.48 | 30.2 |
|
Note: The renewal ratio is defined as the number of workers aged 25 to 34 compared with the number of workers aged 55 and over. Source: Statistics Canada, Census of Population, 2016. |
||||||||||||
A larger share—closer to 8 in 10—of employed Black women and men held occupations not usually requiring a university degree, although they were comparatively younger, with 14% aged 55 and over. In contrast, a smaller share of Chinese female and male workers, 6 in 10, held this type of job, with Chinese women slightly younger than the rest of the female population in these occupations. Similar to the rest of the employed population, about 7 in 10 South Asian women and men were in occupations with this skill level, although they had a younger age profile.
Among the prevalent occupations for women not usually requiring a university degree were retail salespersons, general office workers, cashiers and cleaners (Appendix Tables 1.1 and 1.2).Note Women were generally concentrated in fewer occupations with this skill level than men.Note
Some women were overrepresented or underrepresented in certain common occupations not usually requiring a university degree relative to their overall proportion in occupations with that skill level (Chart 3). For example, while Black and Chinese women each accounted for about 4% of these occupations in 2016, Black women represented 10% of assisting occupations in support of health services, as did 2% of Chinese women.

Data table for Chart 3
| Occupation | South Asian | Chinese | Black |
|---|---|---|---|
| percent | |||
| All occupations not usually requiring a university degree | 4.9 | 4.0 | 3.5 |
| Assisting occupations in support of health services | 3.9 | 1.9 | 9.9 |
| Cleaners | 3.9 | 2.3 | 5.4 |
| Home care providers and educational support occupations | 4.3 | 2.1 | 4.1 |
| Cashiers | 7.7 | 3.9 | 3.9 |
| Food counter attendants, kitchen helpers and related support occupations | 7.8 | 4.6 | 3.7 |
| Retail salespersons | 5.2 | 4.2 | 3.5 |
| General office workers | 4.5 | 4.3 | 2.6 |
|
Note: Rest of the female population is not shown. Source: Statistics Canada, Census of Population, 2016. |
|||
Overall, there were few differences in the age composition between women and men holding occupations not usually requiring a university degree. Renewal ratios were above replacement for some of these prevalent positions, as was the case for cashiers. The fairly high ratios for South Asian (3.56), Black (3.33) and Chinese (1.64) female cashiers in 2016 may at least partially reflect their younger populations, while at the same time the ratio was well below replacement for other women (0.69). This pattern was also observed for retail salespersons, which, along with cashiers, are occupations characterized by below average pay,Note high turnover rates, and large numbers of vacancies.
Other occupations, such as home care providers and educational support occupations, were comprised of shares of female workers aged 55 and over—Black (22%), South Asian (20%) and the rest of the female population (26%)—that were above the average for each of these respective groups.Note
For men—including Black and South Asian men—the most common job not usually requiring a university degree in 2016 was motor vehicle and transit drivers. For South Asian men who held this occupation, the renewal ratio was 1.59, while it was below replacement for Black (0.46) and Chinese (0.40) men, as well as for their male counterparts in the rest of the population (0.30).
One-third of Canadian-born Chinese employed women in professional occupations
Differences in both prevalence and age composition between women and men were most notable for those holding occupations that usually required a university degree, also known as professional occupations. A larger share of women (21%) than men (16%) held jobs of this nature in 2016,Note with higher proportions for younger than for older workers.Note Less than one-fifth (17%) of women in these occupations were aged 55 and over, and the renewal ratio was 1.56. Close to one-quarter (23%) of men who held jobs with this skill level were older workers, and the younger-to-older worker ratio was just above replacement (1.05).
In 2016, Chinese women were more likely to have an occupation that usually required a university degree (27%) than South Asian (21%) women. Chinese women were also more likely to have a university degree.Note Chinese and South Asian women were even more likely to hold such occupations if they were born in Canada (35% and 30%, respectively) compared with those who were immigrants (25% and 19%, respectively), whose shares more closely reflected the rest of the female population. Despite having the largest participation rate of these three groups (see Labour force characteristics of South Asian, Chinese and Black women), the share of Black women holding professional occupations was the lowest of the three groups (19%). Among employed men, 30% of Chinese men and 21% of South Asian men were in professional occupations, as were 15% of Black men and other men.
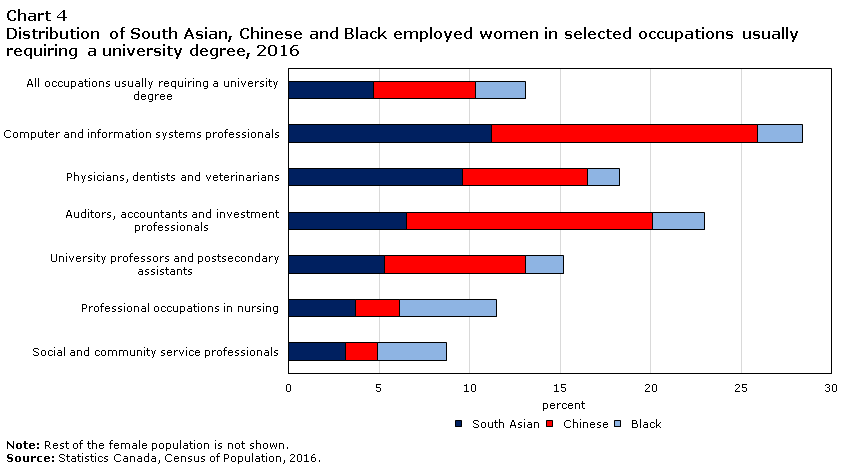
There is more overlap between women and men in the most common occupations that usually require a university degree (Appendix Tables 2.1 and 2.2) than in those with no such requirement (Appendix Tables 1.1 and 1.2). Among the 10 most prevalent such occupations for South Asian, Chinese and Black populations—both women and men—were secondary and elementary school teachers; auditors, accountants and investment professionals; human resources and business service professionals; and computer and information systems professionals. Physicians, dentists and veterinarians were in the top 10 for South Asian, Chinese and Black women, as well as for South Asian and Chinese men. Women in these three groups were overrepresented among certain professional occupations (Chart 4). While South Asian women accounted for 5% of workers in professional occupations, they accounted for 10% of physicians, dentists and veterinarians. On the other hand, Black women accounted for 3% of those in professional occupations, but were underrepresented among physicians, dentists and veterinarians, accounting for 2% of this occupational category.
Data table for Chart 4
| Occupation | South Asian | Chinese | Black |
|---|---|---|---|
| percent | |||
| All occupations usually requiring a university degree | 4.7 | 5.6 | 2.8 |
| Computer and information systems professionals | 11.2 | 14.7 | 2.5 |
| Physicians, dentists and veterinarians | 9.6 | 6.9 | 1.8 |
| Auditors, accountants and investment professionals | 6.5 | 13.6 | 2.9 |
| University professors and postsecondary assistants | 5.3 | 7.8 | 2.1 |
| Professional occupations in nursing | 3.7 | 2.4 | 5.4 |
| Social and community service professionals | 3.1 | 1.8 | 3.8 |
|
Note: Rest of the female population is not shown. Source: Statistics Canada, Census of Population, 2016. |
|||
Professional occupations in nursing also appeared uniquely in the top 10 most prevalent occupations for all groups of women in this study, while civil, mechanical, electrical, chemical and other engineers as well as judges, lawyers and Quebec notaries featured more predominantly among the top 10 for all groups of men. An exception is that civil, mechanical, electrical, chemical and other engineers was in the top 10 professional occupations for Chinese women. These findings reflect the continued predominance of men in science, technology, engineering and mathematics (STEM) occupations, despite the increasing share of women in these occupations over time.Note Notably, among women in the occupational group of computer and information systems professionals in 2016, 15% were Chinese and 11% were South Asian, more than double the shares of these women in professional occupations overall (6% and 5%, respectively).
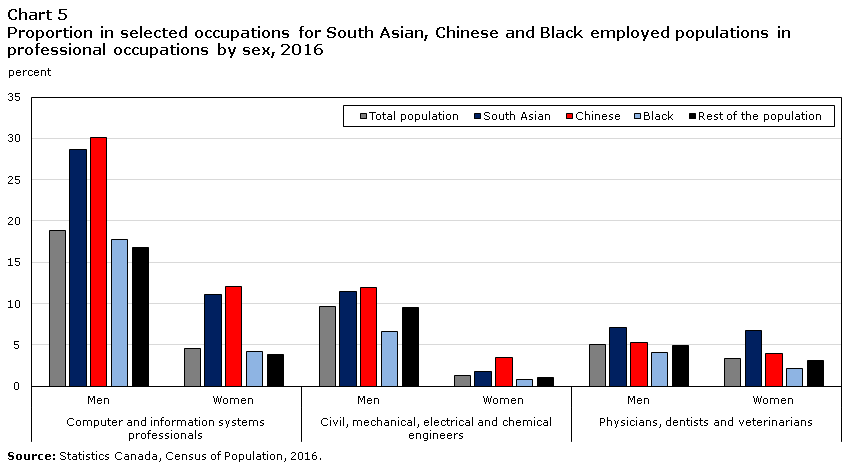
Comparing women and men in several professional occupations shows higher proportions for those who were South Asian and Chinese (Chart 5). The share of South Asian women in professional occupations who were physicians, dentists or veterinarians (7%) in 2016 was comparable to that of South Asian men, and exceeded that of all the other groups.
Data table for Chart 5
| Total population | South Asian | Chinese | Black | Rest of the population | |
|---|---|---|---|---|---|
| percent | |||||
| Computer and information systems professionals | |||||
| Men | 18.8 | 28.7 | 30.1 | 17.7 | 16.8 |
| Women | 4.6 | 11.1 | 12.1 | 4.2 | 3.8 |
| Civil, mechanical, electrical and chemical engineers | |||||
| Men | 9.7 | 11.5 | 12.0 | 6.6 | 9.5 |
| Women | 1.3 | 1.8 | 3.5 | 0.8 | 1.1 |
| Physicians, dentists and veterinarians | |||||
| Men | 5.1 | 7.1 | 5.3 | 4.1 | 4.9 |
| Women | 3.3 | 6.7 | 4.0 | 2.1 | 3.1 |
| Source: Statistics Canada, Census of Population, 2016. | |||||
South Asian women have highest renewal ratio and smallest share of workers 55 and over
Occupations characterized by higher ratios of younger-to-older workers are likely to be less affected by population aging, provided the occupation continues to be renewed with younger entrants. There were more than four (4.35) younger female South Asian workers in occupations usually requiring a university degree for each of these workers in their mid-fifties or older in 2016. The ratio of younger-to-older professional workers was well above replacement for Chinese (3.22) and Black (2.02) women, and all three groups were higher than the rest of the female population (1.42). Renewal ratios for South Asian, Chinese and Black men holding professional occupations were also above replacement, although this was not the case for other men (0.92).
Differences in the age composition of workers across diverse populations of women can also be observed for occupations that usually require a university degree. Overall, 10% of Chinese women, 9% of South Asian women and 13% of Black women in professional occupations were aged 55 and over in 2016. The share for the rest of the female employed population was 18%.Note Men in these groups generally had a larger share of older workers.
Given the aging population, the characteristics of health care workers are often of public policy interest, as many workers in this field are themselves growing older. Among professional occupations in nursing in 2016, the share of older employed women was lower for South Asian (9%), Chinese (15%) and Black (19%) women, than it was for other women (21%).
Among employed women, Chinese physicians, dentists and veterinarians had a renewal ratio of 3.94 in 2016, while it was 2.26 for South Asian women, and 2.11 for Black women, all higher than the 1.54 for the rest of the female population. In contrast, this occupational category was not among the top 10 for Black men. The renewal ratio was about replacement level for South Asian men (1.02) and below replacement for Chinese men (0.91) and the rest of the male population (0.37).Note
Retail and wholesale managers most prevalent management occupation
Among the three broad occupational skill levels, the smallest shares of the employed population were in management occupations in 2016: 9% of women and 14% of men. These occupations are typically held by older workers, given the level of skill and experience that is often required for these positions. Consequently, women and men in management occupations had the largest share of workers aged 55 and over (22% and 29%, respectively) and there was a below-replacement renewal ratio for both.
Similar to all employed women, 9% of Chinese women held management occupations, slightly higher than for South Asian (7%) and Black women (5%).Note There was little difference in the distribution of management occupations across South Asian, Chinese or Black women, with retail and wholesale trade managers as the most common occupation, accounting for about one-fifth of management positions for each population group (Appendix Tables 3.1 and 3.2). The proportions of men in management occupations were higher than for women—and this held across population groups— although retail and wholesale trade managers was also the predominant occupation.
In management occupations, 16% of Chinese women, 13% of South Asian women, and 12% of Black women were aged 55 and over, compared with 23% of other women.
Summary
While women often have different labour market characteristics compared with men, there are many within-group variations as well. This study has examined the prevalence of occupations and age composition for three diverse groups—South Asian, Chinese and Black—of employed women.
Among the most common occupations usually requiring a university degree, or professional occupations, South Asian and Chinese women were overrepresented in occupations such as computer and information systems professionals, and physicians, dentists and veterinarians, compared with Black women or the rest of the female employed population.
In the context of an aging population, maintaining a sufficient supply of workers is essential for a strong labour market. Renewal ratios and the share of workers aged 55 and over can provide a snapshot of the current age composition of workers across occupations. These indicators show that not only are women younger than men in many occupations, but that South Asian, Chinese and Black women are younger still. This is particularly notable for professional occupations that usually require a university degree.
A greater degree of replacement from a younger generation has the potential to moderate the pace of aging within the labour market. Being able to identify the extent to which older workers are being replaced allows policy-makers and planners to better understand the processes related to occupational rejuvenation.
Start of text boxThe Census of Population, conducted every five years, gathers demographic, social, economic and cultural information on the population. Most households are asked to provide basic information only, while 25% provide more detailed information, including their labour market activities during the week prior to enumeration and in the previous year.
The Labour Force Survey (LFS) is a monthly survey of more than 50,000 households. The LFS sample is representative of the civilian non-institutionalized population aged 15 and over in the 10 provinces. It gathers information on the labour force status of those surveyed, as well as detailed information on the nature of the main occupation of those employed. While the LFS produces data on the territories, the methodology used for these estimates differs from that of the provinces, and as a result, this information is excluded from the national totals. The LFS target population also does not include individuals living on-reserve and in other Indigenous settlements.
The employed population refers to people aged 15 and over who were paid workers, self-employed, or unpaid family workers during the week preceding the census. Paid workers earned a wage, salary, tips or commissions, or were paid in kind. The self-employed worked for profit in their own business, farm or professional practice, while unpaid family workers worked without pay in a family farm or business. Also included are people who were temporarily absent from their job or business, with or without pay, for the entire week because of vacation, illness, a labour dispute, maternity leave, family responsibilities or some other reason. Institutional residents living in collective dwellings, such as nursing homes and penal institutions, are excluded from the workforce. Unpaid household activities, unpaid child and elder care, and volunteer work are excluded from the definition of work.
The National Occupational Classification (NOC) is the nationally accepted taxonomy and organizational framework of occupations in the Canadian labour market. Occupations may be classified as skill level A Professionals, that is, those which usually require a university degree. Occupations classified as skill level B, C and D refer to those which do not usually require a university degree, and includes college or apprenticeship training, high school or job-specific training, and on-the-job training. Occupations classified as skill level A Managers refer to management occupations.
South Asian, Chinese and Black populations refer, in this study, to responses to the population group question of the Census. These are the three largest such groups defined by the Employment Equity Act as "persons, other than Indigenous peoples, who are non-Caucasian in race or non-white in colour".
The ‘rest of the [female] population’ refers to those who were not South Asian, Chinese or Black, recognizing that there is much variation that exists within this category. It includes other populations, such as Indigenous women—see Indigenous women and labour market characteristics—as well as other groups identified by the Employment Equity Act, many of which also had relatively high renewal ratios. For example, among Arab and West Asian women, there were close to three younger workers for every older worker in 2016. These particular populations have notably younger age structures and a lower employment rate for older women. The ‘rest of the [female] population’ also includes those who do not belong to a group identified by the Employment Equity Act. Unless otherwise indicated, the ‘rest of the female population’ and ‘other women’ are used interchangeably in this study.
Immigrants includes persons who are, or who have ever been, landed immigrants or permanent residents. Such persons have been granted the right to live in Canada permanently by immigration authorities. Immigrants who have obtained Canadian citizenship by naturalization are included in this category. In the 2016 Census, 'immigrants' includes immigrants who landed in Canada on or prior to May 10, 2016.
Renewal ratio is defined as the number of younger workers aged 25 to 34 to older workers aged 55 and over. The ratio of younger workers to older workers gives an indication of the renewal of the employed population. The majority of younger workers have completed the educational requirements necessary for most occupations and can be expected to remain in the labour force for many additional years, while older workers are nearer to exiting the labour force. A ratio greater than 1.0 means that there are more younger workers than older workers, or more relatively recent entrants compared with those expected to leave the labour market more quickly. Conversely, a ratio of less than 1.0 means more exits than recent entries and may indicate a difficulty in replacing retiring workers. A ratio equal to 1.0 indicates that there are as many younger workers as there are older workers.
Indigenous women also vary in their labour market characteristics compared with other women.Note Indigenous women had a lower employment rate (51.1%) and higher unemployment rate (12.8%) in 2016 than non-Indigenous women (56.9% and 6.8%, respectively). The complexities of the employment situation of the Indigenous population may not be reflected by these labour indicators as Indigenous women may also be engaged in traditional activities such as "making clothing or footwear; making arts or crafts; hunting, fishing or trapping; and gathering wild plants".Note
Within the population of Indigenous women, First Nations women had an employment rate of 46.1% in 2016 and an unemployment rate of 15.1%, while for Inuit women, the corresponding rates were 50.0% and 18.3%.
Fewer Indigenous women held occupations that usually required a university degree (15%) in 2016 compared with non-Indigenous women (22%), however, Indigenous women were twice as likely as Indigenous men (8%) to work in such occupations.
Given the younger age structure of Indigenous populations, these groups have smaller shares of workers aged 55 and over. Overall, 16% of employed Indigenous women were aged 55 and over in 2016, resulting in a renewal ratio of 1.41,Note with little difference for First Nations and Métis women. Inuit employed women were the youngest among the Indigenous groups, with 14% of workers aged 55 and over and a renewal ratio of 1.78.
| Women | Men | |||
|---|---|---|---|---|
| Ratio of younger workers to older workers | Proportion of employed population aged 55 and over | Ratio of younger workers to older workers | Proportion of employed population aged 55 and over | |
| ratio | percent | ratio | percent | |
| Total population | 1.03 | 20.3 | 0.92 | 22.7 |
| Indigenous Identity | 1.41 | 16.0 | 1.37 | 16.7 |
| First Nations | 1.41 | 15.8 | 1.52 | 15.5 |
| Métis | 1.42 | 16.1 | 1.21 | 18.2 |
| Inuit | 1.78 | 13.5 | 1.84 | 13.7 |
| Non-Indigenous Identity | 1.02 | 20.5 | 0.91 | 22.9 |
Source: Statistics Canada, Census of Population, 2016. |
||||
The younger age structures of the South Asian, Black and Chinese populations can be observed in their age pyramids.Note Specifically, the age pyramid of each of the South Asian and Black populations—both female and male—were characterized by a wider base in 2016, reflecting more children and youth relative to older adults. The distribution of Chinese women and men also shows a larger population overall from about age 15 to 54 than aged 55 and older. Indeed, these younger age structures can be seen in the median age—meaning that half of the population was older and half was younger—of the Black (29.6 years), South Asian (33.5 years) and Chinese (38.4 years) populations, compared with the rest of the population (42.0 years). Consequently, the younger age composition of these three groups results in larger renewal ratios, owing to a greater number of people aged 25 to 34 than aged 55 and over.

Data table for Chart 6
| Age | South Asian | Chinese | Black | Rest of the population | ||||
|---|---|---|---|---|---|---|---|---|
| Female | Male | Female | Male | Female | Male | Female | Male | |
| per 1,000 | ||||||||
| 0 | 6.7 | 6.9 | 4.6 | 4.9 | 9.1 | 9.2 | 5.0 | 5.2 |
| 1 | 6.7 | 6.8 | 5.2 | 5.7 | 8.6 | 8.9 | 5.0 | 5.3 |
| 2 | 6.7 | 7.1 | 5.1 | 5.2 | 8.9 | 8.9 | 5.1 | 5.4 |
| 3 | 6.9 | 7.2 | 5.7 | 5.9 | 8.9 | 9.4 | 5.2 | 5.5 |
| 4 | 7.0 | 7.7 | 5.1 | 5.2 | 9.1 | 9.4 | 5.3 | 5.6 |
| 5 | 7.0 | 7.6 | 4.8 | 5.3 | 9.0 | 9.6 | 5.4 | 5.6 |
| 6 | 7.2 | 7.7 | 4.8 | 5.1 | 9.0 | 9.4 | 5.5 | 5.8 |
| 7 | 7.4 | 7.8 | 5.1 | 5.1 | 9.1 | 9.2 | 5.5 | 5.9 |
| 8 | 7.5 | 7.7 | 5.4 | 5.7 | 9.4 | 9.5 | 5.6 | 5.9 |
| 9 | 7.1 | 7.7 | 5.0 | 5.1 | 8.9 | 9.0 | 5.4 | 5.7 |
| 10 | 7.2 | 7.7 | 4.7 | 4.8 | 8.4 | 8.7 | 5.3 | 5.6 |
| 11 | 6.9 | 7.6 | 5.3 | 4.9 | 8.1 | 8.4 | 5.2 | 5.5 |
| 12 | 6.9 | 7.5 | 4.8 | 4.7 | 8.4 | 8.7 | 5.2 | 5.6 |
| 13 | 6.5 | 7.0 | 5.5 | 4.8 | 8.3 | 8.1 | 5.2 | 5.5 |
| 14 | 6.3 | 6.9 | 4.7 | 5.0 | 8.0 | 8.1 | 5.2 | 5.5 |
| 15 | 6.3 | 6.8 | 5.9 | 5.7 | 8.4 | 8.5 | 5.2 | 5.6 |
| 16 | 6.3 | 7.0 | 5.9 | 5.8 | 8.0 | 8.3 | 5.5 | 5.9 |
| 17 | 6.1 | 6.7 | 6.0 | 6.2 | 8.2 | 8.6 | 5.4 | 5.8 |
| 18 | 6.6 | 7.2 | 6.7 | 6.4 | 8.4 | 8.5 | 5.5 | 5.8 |
| 19 | 6.6 | 8.2 | 7.7 | 7.8 | 8.1 | 8.6 | 5.6 | 6.0 |
| 20 | 6.6 | 8.1 | 9.1 | 8.9 | 8.5 | 8.8 | 5.9 | 6.2 |
| 21 | 6.6 | 7.9 | 9.4 | 9.5 | 8.4 | 8.4 | 6.0 | 6.3 |
| 22 | 6.4 | 7.5 | 8.8 | 9.1 | 8.2 | 8.1 | 6.0 | 6.3 |
| 23 | 6.8 | 8.1 | 9.2 | 9.2 | 8.1 | 7.9 | 6.1 | 6.3 |
| 24 | 7.0 | 8.4 | 8.1 | 8.1 | 8.1 | 7.6 | 6.3 | 6.5 |
| 25 | 7.4 | 8.3 | 8.9 | 8.2 | 7.9 | 7.5 | 6.4 | 6.6 |
| 26 | 7.8 | 8.5 | 8.9 | 8.5 | 8.5 | 7.4 | 6.5 | 6.5 |
| 27 | 8.1 | 8.4 | 8.7 | 8.6 | 7.5 | 7.0 | 6.3 | 6.3 |
| 28 | 8.6 | 8.3 | 7.8 | 7.5 | 7.6 | 6.6 | 6.3 | 6.2 |
| 29 | 8.7 | 8.3 | 7.2 | 6.9 | 8.1 | 6.6 | 6.3 | 6.2 |
| 30 | 8.9 | 8.5 | 7.2 | 6.8 | 8.1 | 7.4 | 6.5 | 6.4 |
| 31 | 9.1 | 8.4 | 7.2 | 6.6 | 8.6 | 7.0 | 6.6 | 6.5 |
| 32 | 8.7 | 8.4 | 7.7 | 6.5 | 8.2 | 6.9 | 6.6 | 6.5 |
| 33 | 9.2 | 8.4 | 7.7 | 6.5 | 8.4 | 7.3 | 6.6 | 6.4 |
| 34 | 9.2 | 8.5 | 7.7 | 6.3 | 8.0 | 6.9 | 6.6 | 6.4 |
| 35 | 9.1 | 8.3 | 6.6 | 5.7 | 8.4 | 7.1 | 6.7 | 6.5 |
| 36 | 8.9 | 8.0 | 6.8 | 5.4 | 8.3 | 7.5 | 6.6 | 6.4 |
| 37 | 8.7 | 8.1 | 6.8 | 5.6 | 7.9 | 7.3 | 6.6 | 6.2 |
| 38 | 8.4 | 7.8 | 6.5 | 5.3 | 7.8 | 7.1 | 6.5 | 6.2 |
| 39 | 8.3 | 7.9 | 6.8 | 5.4 | 7.9 | 7.3 | 6.6 | 6.3 |
| 40 | 8.3 | 7.9 | 6.8 | 5.2 | 7.7 | 7.2 | 6.5 | 6.3 |
| 41 | 8.1 | 7.9 | 7.2 | 5.4 | 7.7 | 7.1 | 6.6 | 6.3 |
| 42 | 7.3 | 7.3 | 7.8 | 6.1 | 7.2 | 6.8 | 6.4 | 6.1 |
| 43 | 7.2 | 7.4 | 8.3 | 6.5 | 7.5 | 6.8 | 6.4 | 6.2 |
| 44 | 7.2 | 7.1 | 8.8 | 6.7 | 7.1 | 6.5 | 6.6 | 6.4 |
| 45 | 6.9 | 7.1 | 9.0 | 6.7 | 6.9 | 6.7 | 6.9 | 6.7 |
| 46 | 6.7 | 7.3 | 9.1 | 6.9 | 7.1 | 6.4 | 6.9 | 6.6 |
| 47 | 6.6 | 6.9 | 10.4 | 7.6 | 7.0 | 6.4 | 6.7 | 6.5 |
| 48 | 6.3 | 6.9 | 9.0 | 7.0 | 6.7 | 6.2 | 6.8 | 6.5 |
| 49 | 6.1 | 6.4 | 7.4 | 6.3 | 6.5 | 5.9 | 7.0 | 6.8 |
| 50 | 6.2 | 6.5 | 7.9 | 7.1 | 6.5 | 6.0 | 7.4 | 7.1 |
| 51 | 5.8 | 6.3 | 8.6 | 7.5 | 6.2 | 5.8 | 8.0 | 7.7 |
| 52 | 5.4 | 5.8 | 9.9 | 8.9 | 5.9 | 5.6 | 8.2 | 7.9 |
| 53 | 5.2 | 5.7 | 9.8 | 8.6 | 5.7 | 5.3 | 8.3 | 8.0 |
| 54 | 5.2 | 5.3 | 7.4 | 6.5 | 5.1 | 4.7 | 8.3 | 7.9 |
| 55 | 5.0 | 5.4 | 7.4 | 6.3 | 5.0 | 4.6 | 8.3 | 8.0 |
| 56 | 4.8 | 5.3 | 7.2 | 6.0 | 5.0 | 4.4 | 8.2 | 7.9 |
| 57 | 4.8 | 4.9 | 7.0 | 5.9 | 4.1 | 4.0 | 8.0 | 7.6 |
| 58 | 4.5 | 5.0 | 6.9 | 6.0 | 4.1 | 3.7 | 7.9 | 7.7 |
| 59 | 4.5 | 4.7 | 7.0 | 6.3 | 3.7 | 3.4 | 7.8 | 7.4 |
| 60 | 4.6 | 4.6 | 6.6 | 5.9 | 3.6 | 3.2 | 7.5 | 7.1 |
| 61 | 4.7 | 4.8 | 6.4 | 5.6 | 3.5 | 3.1 | 7.5 | 7.1 |
| 62 | 4.2 | 4.1 | 5.9 | 5.2 | 3.3 | 2.9 | 7.1 | 6.7 |
| 63 | 4.4 | 4.0 | 5.7 | 4.9 | 3.1 | 2.8 | 6.8 | 6.4 |
| 64 | 4.0 | 3.9 | 5.8 | 5.1 | 3.1 | 2.5 | 6.5 | 6.2 |
| 65 | 4.0 | 3.9 | 5.4 | 4.8 | 3.4 | 2.7 | 6.4 | 6.0 |
| 66 | 3.9 | 3.8 | 5.5 | 4.8 | 3.1 | 2.5 | 6.2 | 5.8 |
| 67 | 3.6 | 3.6 | 5.1 | 4.6 | 3.1 | 2.5 | 6.0 | 5.6 |
| 68 | 3.6 | 3.5 | 4.3 | 4.0 | 3.0 | 2.5 | 6.1 | 5.7 |
| 69 | 3.3 | 3.2 | 4.1 | 3.7 | 2.9 | 2.3 | 6.0 | 5.6 |
| 70 | 3.1 | 3.0 | 3.1 | 2.8 | 2.6 | 2.1 | 4.9 | 4.6 |
| 71 | 2.8 | 2.8 | 3.0 | 2.6 | 2.5 | 1.9 | 4.6 | 4.3 |
| 72 | 2.6 | 2.6 | 2.8 | 2.4 | 2.2 | 1.8 | 4.5 | 4.1 |
| 73 | 2.5 | 2.7 | 2.7 | 2.1 | 2.2 | 1.7 | 4.2 | 3.9 |
| 74 | 2.1 | 2.1 | 2.5 | 2.2 | 1.9 | 1.6 | 3.9 | 3.5 |
| 75 | 2.1 | 2.0 | 2.6 | 2.2 | 1.7 | 1.3 | 3.7 | 3.2 |
| 76 | 2.1 | 2.1 | 2.6 | 2.1 | 1.7 | 1.2 | 3.4 | 3.0 |
| 77 | 1.8 | 1.8 | 2.6 | 2.2 | 1.5 | 1.0 | 3.2 | 2.8 |
| 78 | 1.6 | 1.6 | 2.5 | 2.1 | 1.3 | 1.0 | 3.0 | 2.5 |
| 79 | 1.5 | 1.4 | 2.4 | 2.1 | 1.2 | 0.9 | 2.7 | 2.3 |
| 80 | 1.4 | 1.3 | 2.2 | 2.0 | 1.1 | 0.8 | 2.6 | 2.2 |
| 81 | 1.3 | 1.2 | 2.0 | 1.8 | 1.0 | 0.6 | 2.4 | 2.0 |
| 82 | 1.0 | 1.0 | 1.9 | 1.8 | 0.8 | 0.5 | 2.2 | 1.8 |
| 83 | 1.0 | 0.9 | 1.7 | 1.7 | 0.7 | 0.5 | 2.1 | 1.7 |
| 84 | 0.8 | 0.7 | 1.5 | 1.4 | 0.6 | 0.4 | 1.9 | 1.5 |
| 85 | 0.7 | 0.6 | 1.3 | 1.2 | 0.7 | 0.3 | 1.7 | 1.3 |
| 86 | 0.6 | 0.5 | 1.2 | 1.0 | 0.5 | 0.3 | 1.5 | 1.1 |
| 87 | 0.5 | 0.5 | 1.0 | 0.8 | 0.4 | 0.2 | 1.3 | 0.9 |
| 88 | 0.4 | 0.3 | 0.9 | 0.7 | 0.3 | 0.1 | 1.1 | 0.8 |
| 89 | 0.3 | 0.3 | 0.7 | 0.5 | 0.3 | 0.1 | 0.9 | 0.6 |
| 90+ | 1.1 | 0.8 | 2.7 | 1.6 | 1.4 | 0.5 | 3.2 | 1.6 |
|
Note: The category for age 90+ includes all Canadians 90 years and older. Source: Statistics Canada, Census of Population, 2016. |
||||||||
Despite the relatively high level of participation for women overall, labour market characteristics can vary for diverse populations of women. Overall, Black women (66.1%) had the highest participation rate according to the 2016 Census compared with South Asian (59.6%), Chinese (55.9%) or other women (61.2%).Note This was also the case for the employment rate. However, the unemployment rate of Black (12.2%) and South Asian (11.1%) women was notably higher than for Chinese (8.1%) women or the rest of the female population (6.6%).Note There could be many reasons accounting for these patterns, although it has been noted in a recent study that Black employees in Canada were more likely than other workers to report that they experienced unfair treatment or discrimination in the workplace in the previous 12 months.Note
Differences can also be observed for women who were born in Canada compared with those who were immigrants, with higher participation rates and employment rates for the former. There could be challenges related to labour market integration for immigrant women, such as insufficient fluency in an official language, lack of recognition of educational credentials and lack of experience in the Canadian labour market.Note Furthermore, the relationship between attitudes of immigrant women and their labour force participation in Canada is influenced by female labour force participation in the source countries.Note
The unemployment rate for Canadian-born Black women (12.9%) in 2016 was higher than for immigrant women (11.2%). In contrast, among the rest of the female population, this rate was lower for Canadian-born (6.5%) than for immigrant (7.2%) women.
Participation and employment rates were higher for South Asian and Black immigrant men—although not for Chinese or other immigrant men—than for their Canadian-born counterparts. Previous research has shown that immigrant women take longer to integrate into the labour force than do immigrant men.Note
| Women | Men | |||||
|---|---|---|---|---|---|---|
| Participation rate | Employment rate | Unemployment rate | Participation rate | Employment rate | Unemployment rate | |
| percent | ||||||
| South Asian | 59.6 | 52.9 | 11.1 | 74.5 | 68.8 | 7.7 |
| Immigrant | 57.8 | 51.5 | 11.0 | 75.7 | 70.6 | 6.7 |
| Canadian-born | 67.2 | 59.6 | 11.2 | 67.9 | 59.8 | 11.9 |
| Chinese | 55.9 | 51.4 | 8.1 | 63.3 | 58.5 | 7.7 |
| Immigrant | 55.1 | 50.9 | 7.6 | 64.8 | 60.4 | 6.8 |
| Canadian-born | 70.3 | 64.7 | 8.0 | 70.5 | 64.1 | 9.0 |
| Black | 66.1 | 58.0 | 12.2 | 72.2 | 63.0 | 12.8 |
| Immigrant | 65.3 | 58.0 | 11.2 | 75.1 | 67.0 | 10.8 |
| Canadian-born | 68.3 | 59.5 | 12.9 | 67.0 | 56.2 | 16.2 |
| Rest of the population | 61.2 | 57.2 | 6.6 | 69.5 | 63.8 | 8.2 |
| Immigrant | 55.2 | 51.3 | 7.2 | 66.3 | 61.7 | 6.9 |
| Canadian-born | 62.6 | 58.5 | 6.5 | 70.2 | 64.2 | 8.5 |
| Source: Statistics Canada, Census of Population, 2016. | ||||||
References
Arriagada, Paula. 2016. “First Nations, Métis and Inuit Women.” Women in Canada: A Gender-based Statistical Report. February. Statistics Canada Catalogue no. 89-503-X.
Dionne-Simard, Dominique, Diane Galarneau and Sébastien LaRochelle-Côté. 2016. "Women in scientific occupations." Insights on Canadian Society. Statistics Canada Catalogue no. 75-006-X.
Frank, Kristyn and Feng Hou. 2015. “Source-country female labour force participation and the wages of immigrant women in Canada.” Analytical Research Paper Series. no. 365. Statistics Canada Catalogue no. 11F0019M.
Fulford, Meghan and Martha Patterson. 2019. “Multiple jobholders in Canada.” Labour Statistics at a Glance. Statistics Canada Catalogue no. 71-222-X.
Hudon, Tamara. 2015. “Immigrant women.” Women in Canada: A Gender-based Statistical Report. October. Statistics Canada Catalogue no. 89-503-X.
Moyser, Melissa. 2017. “Women and Paid Work.” Women in Canada: A Gender-based Statistical Report. March. Statistics Canada Catalogue no. 89-503-X.
Ouellet-Léveillé, Bertrand and Anne Milan. 2019. “Occupations with older workers.” Insights on Canadian Society. July. Statistics Canada Catalogue no. 75-006-X.
Patterson, Martha. 2018. “Who works part time and why?” Labour Statistics at a Glance. Statistics Canada Catalogue no. 71-222-X.
Statistics Canada. 2020. “Canada’s Black population: Education, labour and resilience.” Ethnicity, Language and Immigration Thematic Series. Statistics Canada Catalogue no. 89-657-X.
Uppal, Sharanjit and Sébastien LaRochelle-Côté. 2014. “Changes in the occupational profile of young men and women in Canada.” Insights on Canadian Society. April. Statistics Canada Catalogue no. 75-006-X.
Appendix Tables
| Workers aged 15 and over | Distribution | Renewal ratio | Proportion of workers aged 55 and over | |
|---|---|---|---|---|
| number | percent | ratio | percent | |
| South Asian | ||||
| Total occupations not usually requiring a university degree | 284,000 | 100.0 | 1.86 | 13.0 |
| Cashiers | 20,000 | 7.0 | 3.56 | 6.0 |
| Retail salespersons | 19,000 | 6.5 | 1.96 | 10.3 |
| Food counter attendants, kitchen helpers and related support occupations | 18,000 | 6.2 | 2.63 | 8.7 |
| Paraprofessional occupations in legal, social, community and education services | 16,000 | 5.5 | 2.22 | 10.9 |
| General office workers | 15,000 | 5.3 | 2.08 | 13.2 |
| Labourers in processing, manufacturing and utilities | 15,000 | 5.1 | 1.00 | 17.0 |
| Administrative and regulatory occupations | 13,000 | 4.5 | 1.87 | 15.5 |
| Customer and information services representatives | 13,000 | 4.4 | 3.69 | 9.1 |
| Home care providers and educational support occupations | 12,000 | 4.2 | 0.72 | 20.3 |
| Assisting occupations in support of health services | 11,000 | 3.7 | 1.96 | 14.2 |
| All other occupations not usually requiring a university degree | 135,000 | 47.5 | 1.77 | 14.1 |
| Chinese | ||||
| Total occupations not usually requiring a university degree | 231,000 | 100.0 | 1.13 | 18.7 |
| Retail salespersons | 15,000 | 6.5 | 1.20 | 16.2 |
| General office workers | 15,000 | 6.3 | 1.38 | 17.8 |
| Administrative and regulatory occupations | 13,000 | 5.8 | 1.38 | 19.3 |
| Occupations in food and beverage service | 13,000 | 5.5 | 2.68 | 9.2 |
| Finance, insurance and related administrative support workers | 11,000 | 4.6 | 1.30 | 17.0 |
| Food counter attendants, kitchen helpers and related support occupations | 10,000 | 4.5 | 0.47 | 23.0 |
| Cashiers | 10,000 | 4.4 | 1.64 | 11.0 |
| Insurance, real estate and financial sales occupations | 10,000 | 4.3 | 1.51 | 18.3 |
| Office administrative assistants - General, legal and medical | 9,000 | 4.0 | 1.13 | 22.9 |
| Paraprofessional occupations in legal, social, community and education services | 9,000 | 3.9 | 2.03 | 13.2 |
| All other occupations not usually requiring a university degree | 116,000 | 50.3 | 0.95 | 20.6 |
| Black | ||||
| Total occupations not usually requiring a university degree | 205,000 | 100.0 | 1.64 | 14.3 |
| Assisting occupations in support of health services | 27,000 | 13.2 | 0.82 | 21.2 |
| Paraprofessional occupations in legal, social, community and education services | 17,000 | 8.1 | 2.28 | 12.0 |
| Retail salespersons | 12,000 | 6.1 | 2.61 | 7.7 |
| Cleaners | 12,000 | 5.8 | 0.72 | 24.2 |
| Home care providers and educational support occupations | 11,000 | 5.6 | 0.80 | 22.3 |
| Customer and information services representatives | 11,000 | 5.4 | 5.23 | 6.6 |
| Cashiers | 10,000 | 4.9 | 3.33 | 5.0 |
| Administrative and regulatory occupations | 9,000 | 4.4 | 2.44 | 11.9 |
| General office workers | 9,000 | 4.3 | 2.07 | 14.0 |
| Food counter attendants, kitchen helpers and related support occupations | 8,000 | 4.1 | 1.63 | 10.6 |
| All other occupations not usually requiring a university degree | 78,000 | 38.2 | 1.86 | 13.6 |
| Rest of the female population | ||||
| Total occupations not usually requiring a university degree | 5,075,000 | 100.0 | 0.87 | 21.7 |
| Administrative and regulatory occupations | 330,000 | 6.5 | 0.73 | 25.5 |
| Paraprofessional occupations in legal, social, community and education services | 315,000 | 6.2 | 1.68 | 15.6 |
| Retail salespersons | 310,000 | 6.1 | 0.73 | 21.2 |
| General office workers | 299,000 | 5.9 | 0.67 | 26.3 |
| Office administrative assistants - General, legal and medical | 293,000 | 5.8 | 0.57 | 29.7 |
| Home care providers and educational support occupations | 248,000 | 4.9 | 0.63 | 25.9 |
| Assisting occupations in support of health services | 230,000 | 4.5 | 0.87 | 22.0 |
| Cashiers | 220,000 | 4.3 | 0.69 | 15.6 |
| Cleaners | 197,000 | 3.9 | 0.36 | 32.8 |
| Occupations in food and beverage service | 192,000 | 3.8 | 3.12 | 7.6 |
| All other occupations not usually requiring a university degree | 2,441,000 | 48.1 | 0.96 | 20.9 |
|
Note: The renewal ratio is defined as the number of workers aged 25 to 34 compared with the number of workers aged 55 and over. Source: Statistics Canada, Census of Population, 2016. |
||||
| Workers aged 15 and over | Distribution | Renewal ratio | Proportion of workers aged 55 and over | |
|---|---|---|---|---|
| number | percent | ratio | percent | |
| South Asian | ||||
| Total occupations not usually requiring a university degree | 350,000 | 100.0 | 1.45 | 16.7 |
| Motor vehicle and transit drivers | 62,000 | 17.8 | 1.59 | 14.6 |
| Retail salespersons | 18,000 | 5.0 | 1.67 | 13.1 |
| Chefs and cooks | 13,000 | 3.7 | 2.21 | 11.9 |
| Security guards and related security service occupations | 12,000 | 3.4 | 0.74 | 28.3 |
| Insurance, real estate and financial sales occupations | 11,000 | 3.2 | 1.15 | 21.3 |
| Longshore workers and material handlers | 10,000 | 2.9 | 1.47 | 16.3 |
| Cleaners | 10,000 | 2.8 | 0.59 | 28.7 |
| Food counter attendants, kitchen helpers and related support occupations | 10,000 | 2.8 | 1.80 | 10.5 |
| Labourers in processing, manufacturing and utilities | 10,000 | 2.7 | 0.58 | 28.9 |
| Supply chain logistics, tracking and scheduling coordination occupations | 10,000 | 2.7 | 1.64 | 15.2 |
| All other occupations not usually requiring a university degree | 185,000 | 52.9 | 1.59 | 16.3 |
| Chinese | ||||
| Total occupations not usually requiring a university degree | 206,000 | 100.0 | 0.99 | 22.2 |
| Chefs and cooks | 20,000 | 9.7 | 0.80 | 25.0 |
| Retail salespersons | 12,000 | 5.6 | 1.20 | 19.8 |
| Insurance, real estate and financial sales occupations | 9,000 | 4.3 | 1.07 | 25.0 |
| Motor vehicle and transit drivers | 8,000 | 3.7 | 0.40 | 31.8 |
| Food counter attendants, kitchen helpers and related support occupations | 7,000 | 3.3 | 0.88 | 18.5 |
| Technical occupations in computer and information systems | 6,000 | 3.1 | 2.78 | 9.4 |
| Administrative and regulatory occupations | 6,000 | 2.7 | 1.36 | 22.0 |
| Cleaners | 6,000 | 2.7 | 0.30 | 36.3 |
| Occupations in food and beverage service | 6,000 | 2.7 | 2.26 | 11.9 |
| Technical occupations in electronics and electrical engineering | 5,000 | 2.3 | 0.80 | 23.9 |
| All other occupations not usually requiring a university degree | 124,000 | 59.9 | 1.03 | 21.8 |
| Black | ||||
| Total occupations not usually requiring a university degree | 208,000 | 100.0 | 1.68 | 14.2 |
| Motor vehicle and transit drivers | 19,000 | 9.1 | 0.46 | 27.5 |
| Cleaners | 12,000 | 5.7 | 1.13 | 19.6 |
| Longshore workers and material handlers | 10,000 | 4.8 | 1.88 | 13.1 |
| Retail salespersons | 9,000 | 4.2 | 2.71 | 8.9 |
| Labourers in processing, manufacturing and utilities | 8,000 | 3.7 | 1.63 | 15.1 |
| Security guards and related security service occupations | 7,000 | 3.6 | 2.27 | 12.4 |
| Supply chain logistics, tracking and scheduling coordination occupations | 7,000 | 3.5 | 2.03 | 12.9 |
| Food counter attendants, kitchen helpers and related support occupations | 6,000 | 3.1 | 3.37 | 5.2 |
| Customer and information services representatives | 6,000 | 3.1 | 7.76 | 4.9 |
| Chefs and cooks | 6,000 | 2.7 | 3.07 | 8.2 |
| All other occupations not usually requiring a university degree | 118,000 | 56.6 | 1.84 | 13.5 |
| Rest of the male population | ||||
| Total occupations not usually requiring a university degree | 5,493,000 | 100.0 | 0.95 | 22.0 |
| Motor vehicle and transit drivers | 383,000 | 7.0 | 0.30 | 38.5 |
| Cleaners | 238,000 | 4.3 | 0.42 | 32.1 |
| Retail salespersons | 233,000 | 4.2 | 0.82 | 22.2 |
| Automotive service technicians | 160,000 | 2.9 | 1.10 | 20.8 |
| Machining, metal forming, shaping and erecting trades | 156,000 | 2.8 | 1.19 | 20.3 |
| Carpenters and cabinetmakers | 154,000 | 2.8 | 1.30 | 20.9 |
| Electrical trades and electrical power line and telecommunications workers | 148,000 | 2.7 | 1.82 | 16.6 |
| Trades helpers and labourers | 148,000 | 2.7 | 1.73 | 14.9 |
| Machinery and transportation equipment mechanics (except motor vehicles) | 147,000 | 2.7 | 1.04 | 22.4 |
| Supply chain logistics, tracking and scheduling coordination occupations | 139,000 | 2.5 | 0.85 | 23.5 |
| All other occupations not usually requiring a university degree | 3,588,000 | 65.3 | 1.06 | 20.2 |
|
Note: The renewal ratio is defined as the number of workers aged 25 to 34 compared with the number of workers aged 55 and over. Source: Statistics Canada, Census of Population, 2016. |
||||
| Workers aged 15 and over | Distribution | Renewal ratio | Proportion of workers aged 55 and over | |
|---|---|---|---|---|
| number | percent | ratio | percent | |
| South Asian | ||||
| Total occupations usually requiring a university degree | 83,000 | 100.0 | 4.35 | 8.7 |
| Auditors, accountants and investment professionals | 12,000 | 14.9 | 3.50 | 10.2 |
| Secondary and elementary school teachers and educational counsellors | 11,000 | 13.0 | 2.52 | 11.5 |
| Professional occupations in nursing | 10,000 | 12.5 | 4.26 | 9.4 |
| Computer and information systems professionals | 9,000 | 11.1 | 10.31 | 4.4 |
| Human resources and business service professionals | 7,000 | 8.3 | 6.58 | 6.6 |
| Policy and program researchers, consultants and officers | 6,000 | 7.2 | 6.45 | 6.1 |
| Physicians, dentists and veterinarians | 6,000 | 6.7 | 2.26 | 13.2 |
| Social and community service professionals | 3,000 | 4.1 | 3.76 | 9.6 |
| University professors and postsecondary assistants | 3,000 | 4.0 | 4.40 | 7.9 |
| Pharmacists, dietitians and nutritionists | 2,000 | 2.8 | 6.19 | 7.0 |
| All other occupations usually requiring a university degree | 13,000 | 15.5 | 4.99 | 7.7 |
| Chinese | ||||
| Total occupations usually requiring a university degree | 100,000 | 100.0 | 3.22 | 10.1 |
| Auditors, accountants and investment professionals | 26,000 | 25.7 | 3.48 | 9.1 |
| Computer and information systems professionals | 12,000 | 12.1 | 2.31 | 9.3 |
| Policy and program researchers, consultants and officers | 8,000 | 7.8 | 4.66 | 8.5 |
| Human resources and business service professionals | 7,000 | 7.4 | 5.80 | 6.3 |
| Secondary and elementary school teachers and educational counsellors | 7,000 | 6.8 | 2.53 | 13.0 |
| Professional occupations in nursing | 7,000 | 6.7 | 2.17 | 15.4 |
| University professors and postsecondary assistants | 5,000 | 4.9 | 4.65 | 7.3 |
| Physicians, dentists and veterinarians | 4,000 | 4.0 | 3.94 | 10.7 |
| Civil, mechanical, electrical and chemical engineers | 4,000 | 3.5 | 4.98 | 5.8 |
| Pharmacists, dietitians and nutritionists | 3,000 | 3.2 | 3.63 | 12.7 |
| All other occupations usually requiring a university degree | 18,000 | 17.8 | 2.58 | 12.3 |
| Black | ||||
| Total occupations usually requiring a university degree | 50,000 | 100.0 | 2.02 | 13.5 |
| Professional occupations in nursing | 15,000 | 30.1 | 1.19 | 18.8 |
| Secondary and elementary school teachers and educational counsellors | 6,000 | 12.2 | 1.55 | 15.0 |
| Auditors, accountants and investment professionals | 5,000 | 10.8 | 3.35 | 9.2 |
| Social and community service professionals | 4,000 | 8.3 | 1.41 | 16.3 |
| Human resources and business service professionals | 4,000 | 8.2 | 5.52 | 6.6 |
| Policy and program researchers, consultants and officers | 4,000 | 7.6 | 2.94 | 10.4 |
| Computer and information systems professionals | 2,000 | 4.2 | 3.51 | 8.4 |
| University professors and postsecondary assistants | 1,000 | 2.6 | 3.75 | 7.8 |
| Judges, lawyers and Quebec notaries | 1,000 | 2.3 | 4.05 | 8.2 |
| Physicians, dentists and veterinarians | 1,000 | 2.1 | 2.11 | 13.5 |
| All other occupations usually requiring a university degree | 6,000 | 11.5 | 2.94 | 10.9 |
| Rest of the female population | ||||
| Total occupations usually requiring a university degree | 1,540,000 | 100.0 | 1.42 | 18.4 |
| Secondary and elementary school teachers and educational counsellors | 327,000 | 21.2 | 1.75 | 14.8 |
| Professional occupations in nursing | 245,000 | 15.9 | 1.21 | 21.4 |
| Auditors, accountants and investment professionals | 145,000 | 9.4 | 1.05 | 21.0 |
| Human resources and business service professionals | 129,000 | 8.4 | 1.95 | 15.3 |
| Policy and program researchers, consultants and officers | 114,000 | 7.4 | 1.53 | 16.9 |
| Social and community service professionals | 99,000 | 6.4 | 1.12 | 22.2 |
| Computer and information systems professionals | 58,000 | 3.8 | 1.18 | 17.1 |
| University professors and postsecondary assistants | 53,000 | 3.5 | 1.37 | 19.5 |
| Creative and performing artists | 48,000 | 3.1 | 0.85 | 26.0 |
| Physicians, dentists and veterinarians | 48,000 | 3.1 | 1.54 | 19.1 |
| All other occupations usually requiring a university degree | 274,000 | 17.8 | 1.60 | 17.8 |
|
Note: The renewal ratio is defined as the number of workers aged 25 to 34 compared with the number of workers aged 55 and over. Source: Statistics Canada, Census of Population, 2016. |
||||
| Number of workers aged 15 and over | Distribution | Renewal ratio | Share of workers aged 55 and over (%) | |
|---|---|---|---|---|
| number | percent | ratio | percent | |
| South Asian | ||||
| Total occupations usually requiring a university degree | 113,000 | 100.0 | 2.49 | 13.3 |
| Computer and information systems professionals | 32,000 | 28.7 | 7.58 | 5.1 |
| Auditors, accountants and investment professionals | 19,000 | 16.6 | 1.74 | 18.6 |
| Civil, mechanical, electrical and chemical engineers | 13,000 | 11.5 | 1.71 | 18.0 |
| Physicians, dentists and veterinarians | 8,000 | 7.1 | 1.02 | 21.9 |
| Human resources and business service professionals | 7,000 | 6.0 | 3.04 | 11.8 |
| Policy and program researchers, consultants and officers | 6,000 | 5.2 | 2.30 | 13.7 |
| Other engineers | 6,000 | 4.9 | 3.35 | 10.4 |
| University professors and postsecondary assistants | 5,000 | 4.1 | 2.22 | 14.3 |
| Secondary and elementary school teachers and educational counsellors | 2,000 | 2.2 | 1.78 | 16.0 |
| Pharmacists, dietitians and nutritionists | 2,000 | 1.9 | 2.43 | 16.2 |
| All other occupations usually requiring a university degree | 13,000 | 11.7 | 1.75 | 16.8 |
| Chinese | ||||
| Total occupations usually requiring a university degree | 108,000 | 100.0 | 2.03 | 14.5 |
| Computer and information systems professionals | 32,000 | 30.1 | 2.69 | 9.6 |
| Auditors, accountants and investment professionals | 17,000 | 15.5 | 2.78 | 13.8 |
| Civil, mechanical, electrical and chemical engineers | 13,000 | 12.0 | 1.35 | 18.2 |
| Physicians, dentists and veterinarians | 6,000 | 5.3 | 0.91 | 27.4 |
| University professors and postsecondary assistants | 6,000 | 5.2 | 2.80 | 13.3 |
| Human resources and business service professionals | 6,000 | 5.1 | 2.61 | 13.3 |
| Policy and program researchers, consultants and officers | 6,000 | 5.1 | 2.97 | 11.3 |
| Other engineers | 5,000 | 4.8 | 1.78 | 13.7 |
| Secondary and elementary school teachers and educational counsellors | 2,000 | 2.2 | 3.33 | 11.6 |
| Physical science professionals | 2,000 | 1.7 | 0.94 | 17.4 |
| All other occupations usually requiring a university degree | 14,000 | 12.9 | 1.40 | 20.8 |
| Black | ||||
| Total occupations usually requiring a university degree | 40,000 | 100.0 | 1.52 | 15.5 |
| Computer and information systems professionals | 7,000 | 17.7 | 3.46 | 8.0 |
| Auditors, accountants and investment professionals | 6,000 | 14.7 | 2.38 | 12.5 |
| Policy and program researchers, consultants and officers | 3,000 | 7.9 | 1.63 | 15.3 |
| Secondary and elementary school teachers and educational counsellors | 3,000 | 7.9 | 0.50 | 23.3 |
| Human resources and business service professionals | 3,000 | 6.7 | 2.29 | 12.0 |
| Social and community service professionals | 3,000 | 6.6 | 0.51 | 25.9 |
| Civil, mechanical, electrical and chemical engineers | 3,000 | 6.6 | 1.70 | 17.6 |
| Professional occupations in nursing | 2,000 | 4.4 | 1.15 | 17.1 |
| University professors and postsecondary assistants | 2,000 | 4.3 | 1.53 | 15.4 |
| Creative and performing artists | 2,000 | 4.1 | 2.31 | 13.0 |
| All other occupations usually requiring a university degree | 7,000 | 18.9 | 1.02 | 18.5 |
| Rest of the male population | ||||
| Total occupations usually requiring a university degree | 1,188,000 | 100.0 | 0.92 | 24.8 |
| Computer and information systems professionals | 200,000 | 16.8 | 1.93 | 13.2 |
| Auditors, accountants and investment professionals | 145,000 | 12.2 | 0.83 | 28.6 |
| Civil, mechanical, electrical and chemical engineers | 112,000 | 9.5 | 1.20 | 23.0 |
| Secondary and elementary school teachers and educational counsellors | 107,000 | 9.0 | 1.13 | 18.9 |
| Human resources and business service professionals | 78,000 | 6.6 | 0.82 | 27.0 |
| Policy and program researchers, consultants and officers | 78,000 | 6.6 | 1.01 | 23.6 |
| Physicians, dentists and veterinarians | 59,000 | 4.9 | 0.37 | 41.5 |
| University professors and postsecondary assistants | 54,000 | 4.5 | 0.95 | 26.0 |
| Judges, lawyers and Quebec notaries | 48,000 | 4.0 | 0.47 | 40.6 |
| Creative and performing artists | 46,000 | 3.9 | 0.91 | 25.4 |
| All other occupations usually requiring a university degree | 259,000 | 21.8 | 0.75 | 27.7 |
|
Note: The renewal ratio is defined as the number of workers aged 25 to 34 compared with the number of workers aged 55 and over. Source: Statistics Canada, Census of Population, 2016. |
||||
| Workers aged 15 and over | Distribution | Renewal ratio | Proportion of workers aged 55 and over | |
|---|---|---|---|---|
| number | percent | ratio | percent | |
| South Asian | ||||
| Total management occupations | 29,000 | 100.0 | 2.11 | 12.5 |
| Retail and wholesale trade managers | 6,000 | 22.1 | 1.98 | 13.1 |
| Managers in financial and business services | 5,000 | 16.7 | 4.09 | 8.6 |
| Managers in food service and accommodation | 4,000 | 15.3 | 2.28 | 11.5 |
| Administrative services managers | 4,000 | 13.8 | 2.51 | 12.0 |
| Managers in engineering, architecture, science and information systems | 1,000 | 4.9 | 2.96 | 8.5 |
| All other management occupations | 8,000 | 27.2 | 1.24 | 16.1 |
| Chinese | ||||
| Total management occupations | 35,000 | 100.0 | 1.53 | 15.5 |
| Retail and wholesale trade managers | 7,000 | 20.2 | 1.36 | 17.3 |
| Managers in financial and business services | 6,000 | 17.8 | 2.80 | 11.4 |
| Administrative services managers | 5,000 | 15.5 | 1.92 | 11.8 |
| Managers in food service and accommodation | 5,000 | 14.9 | 1.28 | 18.6 |
| Legislators and senior management | 2,000 | 6.1 | 0.73 | 19.2 |
| All other management occupations | 9,000 | 25.4 | 1.28 | 16.6 |
| Black | ||||
| Total management occupations | 13,000 | 100.0 | 2.08 | 11.9 |
| Retail and wholesale trade managers | 3,000 | 21.5 | 3.65 | 9.4 |
| Managers in financial and business services | 2,000 | 16.1 | 2.10 | 12.5 |
| Administrative services managers | 2,000 | 13.7 | 2.24 | 9.6 |
| Managers in food service and accommodation | 1,000 | 10.7 | 3.32 | 10.1 |
| Managers in education and social and community services | 1,000 | 8.5 | 0.82 | 17.2 |
| All other management occupations | 4,000 | 29.6 | 1.37 | 13.6 |
| Rest of the female population | ||||
| Total management occupations | 664,000 | 100.0 | 0.76 | 23.4 |
| Retail and wholesale trade managers | 145,000 | 21.9 | 1.03 | 21.4 |
| Administrative services managers | 87,000 | 13.1 | 0.72 | 21.4 |
| Managers in financial and business services | 80,000 | 12.0 | 1.39 | 16.9 |
| Managers in food service and accommodation | 65,000 | 9.7 | 1.27 | 19.2 |
| Legislators and senior management | 57,000 | 8.5 | 0.24 | 33.3 |
| All other management occupations | 230,000 | 34.7 | 0.56 | 26.3 |
|
Note: The renewal ratio is defined as the number of workers aged 25 to 34 compared with the number of workers aged 55 and over. Source: Statistics Canada, Census of Population, 2016. |
||||
| Workers aged 15 and over | Distribution | Renewal ratio | Proportion of workers aged 55 and over | |
|---|---|---|---|---|
| number | percent | ratio | percent | |
| South Asian | ||||
| Total management occupations | 63,000 | 100.0 | 1.28 | 18.2 |
| Retail and wholesale trade managers | 14,000 | 22.7 | 1.33 | 19.4 |
| Managers in food service and accommodation | 8,000 | 12.2 | 1.68 | 16.4 |
| Managers in financial and business services | 7,000 | 10.6 | 2.41 | 12.2 |
| Managers in engineering, architecture, science and information systems | 6,000 | 9.4 | 2.06 | 10.5 |
| Legislators and senior management | 6,000 | 9.2 | 0.46 | 27.2 |
| All other management occupations | 23,000 | 36.0 | 1.12 | 19.5 |
| Chinese | ||||
| Total management occupations | 51,000 | 100.0 | 1.09 | 20.0 |
| Retail and wholesale trade managers | 12,000 | 23.0 | 1.09 | 20.4 |
| Managers in food service and accommodation | 7,000 | 12.9 | 1.06 | 23.2 |
| Managers in financial and business services | 6,000 | 12.2 | 2.13 | 13.4 |
| Managers in construction and facility operation and maintenance | 5,000 | 10.0 | 0.90 | 24.8 |
| Legislators and senior management | 5,000 | 9.7 | 0.53 | 24.3 |
| All other management occupations | 16,000 | 32.2 | 1.14 | 18.1 |
| Black | ||||
| Total management occupations | 17,000 | 100.0 | 1.39 | 15.3 |
| Retail and wholesale trade managers | 3,000 | 18.0 | 1.87 | 14.0 |
| Managers in construction and facility operation and maintenance | 2,000 | 13.9 | 1.47 | 15.6 |
| Managers in financial and business services | 2,000 | 10.0 | 3.31 | 7.8 |
| Legislators and senior management | 1,000 | 8.8 | 0.57 | 20.6 |
| Administrative services managersTable A3.2 Note 1 | 1,000 | 8.5 | 1.26 | 15.2 |
| All other management occupations | 7,000 | 40.6 | 1.20 | 16.4 |
| Rest of the male population | ||||
| Total management occupations | 1,088,000 | 100.0 | 0.48 | 30.2 |
| Retail and wholesale trade managers | 197,000 | 18.1 | 0.61 | 27.8 |
| Managers in construction and facility operation and maintenance | 151,000 | 13.9 | 0.62 | 27.9 |
| Legislators and senior management | 149,000 | 13.6 | 0.19 | 38.5 |
| Managers in agriculture, horticulture and aquaculture | 116,000 | 10.7 | 0.21 | 51.3 |
| Managers in financial and business services | 72,000 | 6.6 | 0.89 | 22.7 |
| All other management occupations | 404,000 | 37.1 | 0.61 | 24.4 |
Source: Statistics Canada, Census of Population, 2016. |
||||
- Date modified: